Adaptive Fractal Grid Scalping StrategyThis Pine Script v6 component implements an "Adaptive Fractal Grid Scalping Strategy" with an added volatility threshold feature.
Here's how it works:
Fractal Break Detection: Uses ta.pivothigh and ta.pivotlow to identify local highs and lows.
Volatility Clustering: Measures volatility using the Average True Range (ATR).
Adaptive Grid Levels: Dynamically adjusts grid levels based on ATR and user-defined multipliers.
Directional Bias Filter: Uses a Simple Moving Average (SMA) to determine trend direction.
Volatility Threshold: Introduces a new input to specify a minimum ATR value required to activate the strategy.
Trade Execution Logic: Places limit orders at grid levels based on trend direction and fractal levels, but only when ATR exceeds the volatility threshold.
Profit-Taking and Stop-Loss: Implements profit-taking at grid levels and a trailing stop-loss based on ATR.
How to Use
Inputs: Customize the ATR length, SMA length, grid multipliers, trailing stop multiplier, and volatility threshold through the input settings.
Visuals: The script plots fractal points and grid levels on the chart for easy visualization.
Trade Signals: The strategy automatically places buy/sell orders based on the detected fractals, trend direction, and volatility threshold.
Profit and Risk Management: The script includes logic for taking profits and setting stop-loss levels to manage trades effectively.
This strategy is designed to capitalize on micro-movements during high volatility and avoid overtrading during low-volatility trends. Adjust the input parameters to suit your trading style and market conditions.
ATR

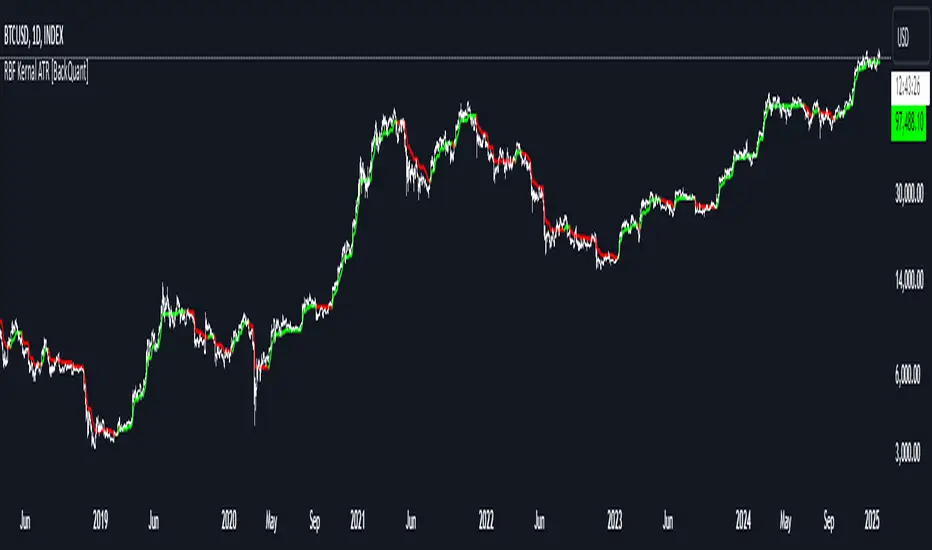
Radial Basis Kernal ATR [BackQuant]Radial Basis Kernel ATR
The Radial Basis Kernel ATR is a trading indicator that combines the classic Average True Range (ATR) with advanced Radial Basis Function (RBF) kernel smoothing . This innovative approach creates a highly adaptive and precise tool for detecting volatility, identifying trends, and providing dynamic support and resistance levels.
With its configurable parameters and ability to adjust to market conditions, this indicator offers traders a robust framework for making informed decisions across various assets and timeframes.
Key Feature: Radial Basis Function Kernel Smoothing
The Radial Basis Function (RBF) kernel is at the heart of this indicator, applying sophisticated mathematical techniques to smooth price data and calculate an enhanced version of ATR. By weighting data points dynamically, the RBF kernel ensures that recent price movements are given appropriate emphasis without overreacting to short-term noise.
The RBF kernel uses a gamma factor to control the degree of smoothing, making it highly adaptable to different asset classes and market conditions:
Gamma Factor Adjustment :
For low-volatility data (e.g., indices), a smaller gamma (0.05–0.1) ensures smoother trends and avoids overly sharp responses.
For high-volatility data (e.g., cryptocurrencies), a larger gamma (0.1–0.2) captures the increased price fluctuations while maintaining stability.
Experimentation is Key : Traders are encouraged to backtest and visually compare different gamma values to find the optimal setting for their specific asset and strategy.
The gamma factor dynamically adjusts based on the variance of the source data, ensuring the indicator remains effective across a wide range of market conditions.
Average True Range (ATR) with Dynamic Bands
The ATR is a widely used volatility measure that captures the degree of price movement over a specific period. This indicator enhances the traditional ATR by integrating the RBF kernel, resulting in a smoothed and adaptive ATR calculation.
Dynamic bands are created around the RBF kernel output using a user-defined ATR factor , offering valuable insights into potential support and resistance zones. These bands expand and contract based on market volatility, providing a visual representation of potential price movement.
Moving Average Confluence
For additional confirmation, the indicator includes the option to overlay a moving average on the smoothed ATR. Traders can choose from several moving average types, such as EMA , SMA , or Hull , and adjust the lookback period to suit their strategy. This feature helps identify broader trends and potential confluence areas, making the indicator even more versatile.
Long and Short Trend Detection
The indicator provides long and short signals based on the directional movement of the smoothed ATR:
Long Signal : Triggered when the ATR crosses above its previous value, indicating bullish momentum.
Short Signal : Triggered when the ATR crosses below its previous value, signaling bearish momentum.
These trend signals are visually highlighted on the chart with green and red bar coloring (optional), providing clear and actionable insights.
Customization Options
The Radial Basis Kernel ATR offers extensive customization options, allowing traders to tailor the indicator to their preferences:
RBF Kernel Settings
Source : Select the price data (e.g., close, high, low) used for the kernel calculation.
Kernel Length : Define the lookback period for the RBF kernel, controlling the smoothing effect.
Gamma Factor : Adjust the smoothing sensitivity, with smaller values for smoother trends and larger values for responsiveness.
ATR Settings
ATR Period : Set the period for ATR calculation, with shorter periods capturing more short-term volatility and longer periods providing a broader view.
ATR Factor : Adjust the scaling of ATR bands for dynamic support and resistance levels.
Confluence Settings
Moving Average Type : Choose from various moving average types for additional trend confirmation.
Moving Average Period : Define the lookback period for the moving average overlay.
Visualization
Trend Coloring : Enable or disable bar coloring based on trend direction (green for long, red for short).
Background Highlighting : Add optional background shading to emphasize long and short trends visually.
Line Width : Customize the thickness of the plotted ATR line for better visibility.
Alerts and Automation
To help traders stay on top of market movements, the indicator includes built-in alerts for trend changes:
Kernel ATR Trend Up : Triggered when the ATR indicates a bullish trend.
Kernel ATR Trend Down : Triggered when the ATR signals a bearish trend.
These alerts ensure traders never miss important opportunities, providing timely notifications directly to their preferred device.
Suggested Gamma Values
The effectiveness of the gamma factor depends on the asset type and the selected kernel length:
Low Volatility Assets (e.g., indices): Use a smaller gamma factor (approximately 0.05–0.1) for smoother trends.
High Volatility Assets (e.g., crypto): Use a larger gamma factor (approximately 0.1–0.2) to capture sharper price movements.
Experimentation : Fine-tune the gamma factor using backtests or visual comparisons to optimize for specific assets and strategies.
Trading Applications
The Radial Basis Kernel ATR is a versatile tool suitable for various trading styles and strategies:
Trend Following : Use the smoothed ATR and dynamic bands to identify and follow trends with confidence.
Reversal Trading : Spot potential reversals by observing interactions with dynamic ATR bands and moving average confluence.
Volatility Analysis : Analyze market volatility to adjust risk management strategies or position sizing.
Final Thoughts
The Radial Basis Kernel ATR combines advanced mathematical techniques with the practical utility of ATR, offering traders a powerful and adaptive tool for volatility analysis and trend detection. Its ability to dynamically adjust to market conditions through the RBF kernel and gamma factor makes it a unique and indispensable part of any trader's toolkit.
By combining sophisticated smoothing , dynamic bands , and customizable visualization , this indicator enhances the ability to read market conditions and make more informed trading decisions. As always, backtesting and incorporating it into a broader strategy are recommended for optimal results.
Comprehensive Volume and Metrics with Pre-Market Volume Data
This script is designed for traders who want a detailed view of market activity, including regular market and pre-market volume, dollar volume, relative volume (RVOL), average daily range (ADR), average true range (ATR), relative strength index (RSI), and the QQQ’s percentage change.
The script includes customizable metrics displayed in tables on the chart for easy analysis, with the option to toggle the visibility of each metric.
Key Features:
Volume and Dollar Volume:
Displays the volume of shares traded during the current day (or pre-market, if enabled).
Includes a calculation of dollar volume, representing the total dollar amount of trades (Volume × Close Price).
Relative Volume (RVOL):
Displays RVOL Day, which is the relative volume of the current day compared to the 2-day moving average.
Shows RVOL 90D, indicating relative volume over the past 90 days.
Both RVOL metrics are calculated as percentages and display the percentage change compared to the standard (100%).
Pre-Market Data:
Includes pre-market volume (PVOL) and pre-market dollar volume (P$ VOL) which are displayed only if pre-market data is enabled.
Tracks volume and dollar volume during pre-market hours (4:00 AM to 9:30 AM Eastern Time) for more in-depth analysis.
Optionally, shows pre-market RSI based on volume-weighted close prices.
Average Daily Range (ADR):
Displays the percentage change between the highest and lowest prices over the defined ADR period (default is 20 days).
Average True Range (ATR):
Shows the ATR, a popular volatility indicator, for a given period (default is 14 bars).
RSI (Relative Strength Index):
Displays RSI for the given period (default is 14).
RSI is calculated using pre-market data when available.
QQQ:
Shows the percentage change of the QQQ ETF from the previous day’s close.
The QQQ percentage change is color-coded: green for positive, red for negative, and gray for no change.
Customizable Inputs:
Visibility Options: Toggle the visibility of each metric, such as volume, dollar volume, RVOL, ADR, ATR, RSI, and QQQ.
Pre-Market Data: Enable or disable the display of pre-market data for volume and dollar volume.
Table Positioning: Adjust the position of tables displaying the metrics either at the bottom-left or bottom-right of the chart.
Text Color and Table Background: Choose between white or black text for the tables and customize the background color.
Tables:
The script utilizes tables to display multiple metrics in an organized and easy-to-read format.
The values are updated dynamically, reflecting real-time data as the market moves.
Pre-Market Data:
The script calculates pre-market volume and dollar volume, along with other key metrics like RSI and RVOL, to help assess market sentiment before the market officially opens.
The pre-market data is accumulated from 4:00 AM to 9:30 AM ET, allowing for pre-market analysis and comparison to regular market hours.
User-Friendly and Flexible:
This script is designed to be highly customizable, giving you the ability to toggle which metrics to display and where they appear on the chart. You can easily focus on the data that matters most to your trading strategy.

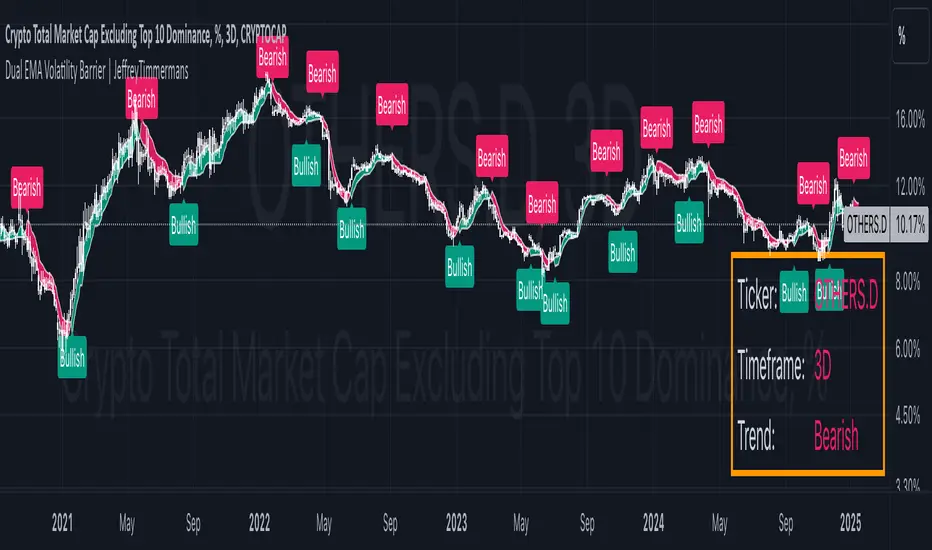
Dual EMA Volatility Barrier | JeffreyTimmermansDual EMA Volatility Barrier
The "Dual EMA Volatility Barrier" indicator combines the power of the Double Exponential Moving Average (DEMA) with volatility-based stops to provide a robust trend-following system. This indicator helps traders identify and confirm trends, offering a way to filter out noise using volatility measures like the Average True Range (ATR) and a higher timeframe filter for additional trend validation.
Key Features
Dual Exponential Moving Average (DEMA):
DEMA Calculation: A more responsive moving average that reduces lag compared to standard EMAs. This helps detect trend changes faster.
Source Customization: Allows traders to choose the source (default is close), which can help adapt the strategy for different market conditions.
Volatility Barrier (Vstop):
Volatility-Based Stops: The Vstop is calculated using the Average True Range (ATR) multiplied by a user-defined factor. This forms a dynamic stop level that adjusts based on market volatility.
Trend Direction: The Vstop adapts to whether the market is in an uptrend or downtrend, providing a stop-loss level that moves accordingly.
Higher Timeframe Trend Filter:
Higher Timeframe DEMA: The higher timeframe filter uses a DEMA from a larger timeframe to confirm the trend direction. Only consider bullish signals if the price is above the higher timeframe DEMA.
Customizable Higher Timeframe: Traders can select any timeframe (e.g., D for daily) to check the trend from a higher perspective.
Signal Generation:
Bullish Signal: Triggered when the trend is up, and the price is above the higher timeframe DEMA, with a corresponding Vstop change indicating an upward trend.
Bearish Signal: Triggered when the trend is down and the price is below the higher timeframe DEMA, with a corresponding Vstop change indicating a downward trend.
Trend Reversals: Identifies key trend reversals by showing the transition between uptrend and downtrend states.
Plotting and Visuals:
DEMA and Vstop Plot: The indicator plots both the DEMA and the Vstop on the chart, providing a visual guide for trend and volatility.
Background Color Fill: The area between the DEMA and Vstop is filled with a color (green for bullish, red for bearish) to provide a clear visual representation of the trend.
Signal Labels: Plot arrows and labels ("Bullish" and "Bearish") directly on the chart to highlight trend changes.
Dashboard:
Ticker & Timeframe Display: The dashboard in the bottom-right corner shows the current symbol (ticker) and timeframe, along with the current trend (Bullish or Bearish).
Real-Time Updates: The dashboard updates in real time, providing traders with quick insights into the current market conditions.
Alerts:
Bullish Alert: Activated when the trend is bullish and confirmed by the higher timeframe DEMA.
Bearish Alert: Activated when the trend is bearish and confirmed by the higher timeframe DEMA.
Customizable Messages: Alerts provide details about the ticker and trend conditions for easy action.
Improvements:
Higher Timeframe Filtering: The higher timeframe DEMA filter ensures that traders align their trades with the broader market trend, improving the overall accuracy of signals.
Volatility-Based Stops: The ATR-based volatility stops allow for adaptive risk management that responds to changing market conditions.
Dynamic Signal Detection: The bullish and bearish signals change in real time, providing actionable insights for traders.
Visual and Dashboard Updates: The chart visually reflects the trend and volatility dynamics, while the dashboard provides summary information at a glance.
Customizable Alerts: Alerts based on trend changes make it easy to stay informed without constantly monitoring the chart.
Use Cases:
Trend Following: Ideal for identifying and following strong trends by combining short-term and long-term trend indicators.
Volatility-Based Risk Management: Use the Vstop to manage trade exits, as it adjusts to market volatility.
Higher Timeframe Confirmation: Use the higher timeframe DEMA to ensure that the trade aligns with the overall market trend.
Alerts for Real-Time Action: Set alerts to notify when the market signals a shift, whether bullish or bearish.
The Dual EMA Volatility Barrier is a powerful tool for traders seeking to combine trend-following with volatility management. The integration of DEMA, ATR, and a higher timeframe filter allows for a more nuanced understanding of market conditions, ensuring traders can make informed decisions with minimal lag.
This script is inspired by "viResearch" . However, it is more advanced and includes additional features and options.
-Jeffrey
Trendilo ARTrendilo AR is a custom trading indicator designed to identify market trends using advanced techniques such as the Arnaud Legoux Moving Average (ALMA), volume confirmations, and dynamic volatility bands. This indicator provides a clear visualization of trends, including significant changes and custom alerts.
Review of Indicators Used
1. ALMA
Description:
ALMA is a moving average that applies an advanced filter to smooth price data, reducing noise and focusing on actual trends.
Usage in the Indicator:
Used to calculate the smoothed percentage price change and determine trend direction. Customizable parameters include:
- Length: Defines the number of bars to consider.
- Offset: Adjusts sensitivity toward recent prices.
- Sigma: Controls the degree of smoothing.
Advantages:
- Reduced lag in trend detection.
- Resistance to market noise.
2. ATR
Description:
ATR measures the market’s average volatility by considering the range between high and low prices over a given period.
Usage in the Indicator:
ATR is used to calculate "dynamic smoothing", adjusting the indicator’s sensitivity based on current market volatility.
Advantages:
- Adapts to high or low volatility conditions.
- Helps define dynamic support and resistance levels.
3. SMA
Description:
SMA calculates the average of prices or volume over a specific time period.
Usage in the Indicator:
Used to calculate the volume moving average (Volume SMA) to confirm whether the current volume supports the detected trend.
Advantages:
- Easy to understand and calculate.
- Provides volume-based trend confirmation.
4. RMS Bands
Description:
RMS Bands calculate the standard deviation of percentage price changes, creating upper and lower levels that act as overbought and oversold indicators.
Usage in the Indicator:
- Define the range within which the market is considered neutral.
- Crosses above or below the bands indicate trend changes.
Advantages:
- Visual identification of strong trends.
- Helps filter false signals.
Colors and Visuals Used in the Indicator
1. ALMA Line
Colors:
- Green: Indicates a confirmed uptrend (with sufficient volume).
- Red: Indicates a confirmed downtrend (with sufficient volume).
- Gray: Indicates a neutral phase or insufficient volume to confirm a trend.
2. RMS Bands
- Upper and Lower Lines:
- Purple (with transparency): These lines represent the RMS bands (upper and lower) and
adjust opacity based on trend strength.
- Stronger trends result in less transparency (more solid colors).
3. Highlighted Background (Strong Trends)
- Color:
- Light Green (transparent): Highlights a strong trend when the smoothed percentage change (ALMA) exceeds 1.5 times the RMS.
4. Horizontal Lines
- Baseline (0):
- Dark Gray: Serves as a central reference to identify the directionality of percentage changes.
- Additional Line (0.1):
- Blue: A customizable line to mark user-defined key levels.
5. Bar Colors
- Bar Colors:
- Green: When the price is in a confirmed uptrend.
- Red: When the price is in a confirmed downtrend.
- No color: When there is insufficient volume or no clear trend.
How to Use the Indicator
1. Initial Setup
1. Add the Indicator to Your Chart: Copy the code into the Pine Editor on TradingView and apply it to your chart.
2. Customize Parameters: Adjust values based on your trading strategy:
- Smoothing: Controls the level of smoothing for percentage changes.
- Lookback Length: Defines the observation period for calculations.
- Band Multiplier: Adjusts the width of RMS bands.
2. Signal Interpretation
1. Indicator Colors:
- Green: Confirmed uptrend.
- Red: Confirmed downtrend.
- Gray: No clear trend or insufficient volume.
2. RMS Bands:
- If the ALMA line (smoothed percentage change) crosses above the upper RMS band, it signals a potential uptrend.
- If it crosses below the lower RMS band, it signals a potential downtrend.
3. Volume Confirmation:
- The indicator's color activates only if the current volume exceeds the Volume SMA.
3. Alerts and Decisions
1. Trend Change Alerts:
- The indicator automatically triggers alerts when an uptrend or downtrend is detected.
- Configure these alerts to receive real-time notifications.
2. Strong Trend Signals:
- When the magnitude of the percentage change exceeds 1.5 times the RMS, the chart background highlights the strong trend.
4. Trading Strategies
1. Buy:
- Enter long positions when:
- The indicator turns green.
- Volume confirms the trend.
- Consider placing a stop-loss just below the lower RMS band.
2. Sell:
- Enter short positions when:
- The indicator turns red.
- Volume confirms the trend.
- Consider placing a stop-loss just above the upper RMS band.
3. Neutral:
- Avoid trading when the indicator is gray, as no clear trend or insufficient volume is present.
Disclaimer: As this is my first published indicator, please use it with caution. Feedback is highly appreciated to improve its performance.
Happy Trading!

00 Averaging Down Backtest Strategy by RPAlawyer v21FOR EDUCATIONAL PURPOSES ONLY! THE CODE IS NOT YET FULLY DEVELOPED, BUT IT CAN PROVIDE INTERESTING DATA AND INSIGHTS IN ITS CURRENT STATE.
This strategy is an 'averaging down' backtester strategy. The goal of averaging/doubling down is to buy more of an asset at a lower price to reduce your average entry price.
This backtester code proves why you shouldn't do averaging down, but the code can be developed (and will be developed) further, and there might be settings even in its current form that prove that averaging down can be done effectively.
Different averaging down strategies exist:
- Linear/Fixed Amount: buy $1000 every time price drops 5%
- Grid Trading: Placing orders at price levels, often with increasing size, like $1000 at -5%, $2000 at -10%
- Martingale: doubling the position size with each new entry
- Reverse Martingale: decreasing position size as price falls: $4000, then $2000, then $1000
- Percentage-Based: position size based on % of remaining capital, like 10% of available funds at each level
- Dynamic/Adaptive: larger entries during high volatility, smaller during low
- Logarithmic: position sizes increase logarithmically as price drops
Unlike the above average costing strategies, it applies averaging down (I use DCA as a synonym) at a very strong trend reversal. So not at a certain predetermined percentage negative PNL % but at a trend reversal signaled by an indicator - hence it most closely resembles a dynamically moving grid DCA strategy.
Both entering the trade and averaging down assume a strong trend. The signals for trend detection are provided by an indicator that I published under the name '00 Parabolic SAR Trend Following Signals by RPAlawyer', but any indicator that generates numeric signals of 1 and -1 for buy and sell signals can be used.
The indicator must be connected to the strategy: in the strategy settings under 'External Source' you need to select '00 Parabolic SAR Trend Following Signals by RPAlawyer: Connector'. From this point, the strategy detects when the indicator generates buy and sell signals.
The strategy considers a strong trend when a buy signal appears above a very conservative ATR band, or a sell signal below the ATR band. The conservative ATR is chosen to filter ranging markets. This very conservative ATR setting has a default multiplier of 8 and length of 40. The multiplier can be increased up to 10, but there will be very few buy and sell signals at that level and DCA requirements will be very high. Trade entry and DCA occur at these strong trends. In the settings, the 'ATR Filter' setting determines the entry condition (e.g., ATR Filter multiplier of 9), and the 'DCA ATR' determines when DCA will happen (e.g., DCA ATR multiplier of 6).
The DCA levels and DCA amounts are determined as follows:
The first DCA occurs below the DCA Base Deviation% level (see settings, default 3%) which acts as a threshold. The thick green line indicates the long position avg price, and the thin red line below the green line indicates the 3% DCA threshold for long positions. The thick red line indicates the short position avg price, and the thin red line above the thick red line indicates the short position 3% DCA threshold. DCA size multiplier defines the DCA amount invested.
If the loss exceeds 3% AND a buy signal arrives below the lower ATR band for longs, or a sell signal arrives above the upper ATR band for shorts, then the first DCA will be executed. So the first DCA won't happen at 3%, rather 3% is a threshold where the additional condition is that the price must close above or below the ATR band (let's say the first DCA occured at 8%) – this is why the code resembles a dynamic grid strategy, where the grid moves such that alongside the first 3% threshold, a strong trend must also appear for DCA. At this point, the thick green/red line moves because the avg price is modified as a result of the DCA, and the thin red line indicating the next DCA level also moves. The next DCA level is determined by the first DCA level, meaning modified avg price plus an additional +8% + (3% * the Step Scale Multiplier in the settings). This next DCA level will be indicated by the modified thin red line, and the price must break through this level and again break through the ATR band for the second DCA to occur.
Since all this wasn't complicated enough, and I was always obsessed by the idea that when we're sitting in an underwater position for days, doing DCA and waiting for the price to correct, we can actually enter a short position on the other side, on which we can realize profit (if the broker allows taking hedge positions, Binance allows this in Europe).
This opposite position in this strategy can open from the point AFTER THE FIRST DCA OF THE BASE POSITION OCCURS. This base position first DCA actually indicates that the price has already moved against us significantly so time to earn some money on the other side. Breaking through the ATR band is also a condition for entry here, so the hedge position entry is not automatic, and the condition for further DCA is breaking through the DCA Base Deviation (default 3%) and breaking through the ATR band. So for the 'hedge' or rather opposite position, the entry and further DCA conditions are the same as for the base position. The hedge position avg price is indicated by a thick black line and the Next Hedge DCA Level is indicated by a thin black line.
The TPs are indicated by green labels for base positions and red labels for hedge positions.
No SL built into the strategy at this point but you are free to do your coding.
Summary data can be found in the upper right corner.
The fantastic trend reversal indicator Machine learning: Lorentzian Classification by jdehorty can be used as an external indicator, choose 'backtest stream' for the external source. The ATR Band multiplicators need to be reduced to 5-6 when using Lorentz.
The code can be further developed in several aspects, and as I write this, I already have a few ideas 😊

Risk-Adjusted Trend IndicatorThe Risk-Adjusted Trend Indicator is a comprehensive tool designed to evaluate market trends while factoring in risk levels. By combining trend strength, volatility, and dynamic scaling, this indicator provides traders with clear, actionable signals for optimal entries and exits. Its focus on risk-adjusted metrics ensures that signals are both reliable and contextually informed by prevailing market conditions.
Key Features:
1. Exponential Moving Average (EMA):
• The EMA serves as the foundation for trend detection, offering a smoothed representation of price movement over a user-defined period.
• Aids in distinguishing bullish and bearish trends effectively.
2. Average True Range (ATR):
• ATR is used to gauge market volatility, ensuring that the indicator adapts to changing market conditions.
• Facilitates the normalization of trend strength relative to current market volatility.
3. Risk-Adjusted Trend Score:
• Computes the difference between the price and EMA and normalizes it using the ATR to account for risk.
• This metric allows traders to focus on trends with favorable risk-reward ratios, filtering out weak or high-risk setups.
4. Dynamic Scaling:
• Adjusts the risk-adjusted score to fit within the chart’s price range, making the visualization intuitive and easy to interpret.
5. Buy/Sell Signals:
• Buy signals are triggered when the risk-adjusted score crosses above a positive threshold.
• Sell signals are triggered when the score crosses below a negative threshold.
• Signals are plotted directly on the chart with intuitive markers for quick decision-making.
6. Background Color Zones:
• Highlights bullish and bearish trend zones using subtle background shading, enhancing visual clarity.
Reason for Combining These Elements
The Risk-Adjusted Trend Indicator blends elements of trend analysis, volatility measurement, and risk assessment to address a fundamental challenge in trading: identifying high-confidence trades that align with a trader’s risk tolerance. Here’s why these components were chosen and how they work together:
1. EMA (Trend Detection):
• Provides a reliable baseline for trend direction, ensuring that the indicator aligns with the market’s prevailing trend.
2. ATR (Volatility Normalization):
• Adjusts trend strength calculations based on market volatility, allowing the indicator to adapt to varying market conditions and avoid false signals in high-volatility environments.
3. Risk-Adjusted Score:
• By factoring in both trend strength and volatility, this score ensures that only trends with favorable risk-reward dynamics are highlighted.
• This approach minimizes overtrading and reduces exposure to high-risk setups.
4. Dynamic Scaling:
• Ensures that the indicator’s outputs remain visually accessible, regardless of the asset or timeframe being analyzed.
• Enhances usability by aligning the score with price action on the chart.
5. Visual Aids (Signals and Background Zones):
• The inclusion of visual signals and background zones simplifies decision-making, making the tool suitable for both novice and experienced traders.

Improved Trend Shot | JeffreyTimmermansImproved Trend Shot
The "Improved Trend Shot" is an advanced trend-following tool that integrates cutting-edge features and the principles of John Ehlers’ SuperSmoother Filter to provide traders with more accurate trend detection and better decision-making. This enhanced version includes multiple smoothing types, customizable lengths, dynamic alerts, and a comprehensive dashboard to help traders quickly interpret market conditions.
This script is inspired by "TRW" . However, it is more advanced and includes additional features and options.
Key Features and Improvements
Smoothed Lines and Trend Detection
The core of the Improved Smooth Trend Shot relies on three key lines to capture market momentum:
Fast Line: Highly sensitive to short-term price changes, offering rapid responsiveness to market movements.
Middle Line: Provides a medium-term view of market trends, acting as a more stable reference.
Slow Line: Focuses on long-term trends, offering a broader perspective on market direction.
These three smoothed lines interact dynamically to create a visual color-coded cloud that helps traders easily interpret market conditions:
Green Cloud: Indicates an upward trend when the Fast line is above the Slow line.
Red Cloud: Signals a downward trend when the Fast line is below the Slow line.
The cloud color adjusts based on the relative positioning of the Fast, Middle, and Slow lines, helping traders to identify bullish or bearish trends with ease.
Dynamic Cloud Visualization and Alerts
The cloud and trend lines adapt to market conditions, updating in real-time to reflect changes in trend strength and momentum. Traders can also set up real-time alerts to notify them of important trend shifts, such as:
Fast and Slow Crossovers: Alerts when the Fast line crosses the Slow line.
Middle and Slow Crossovers: Alerts when the Middle line crosses the Slow line.
This makes it easier to capture trading opportunities and respond promptly to market changes.
Enhanced Smoothing Options
Traders can now choose from multiple smoothing types, including:
EMA (Exponential Moving Average)
SMA (Simple Moving Average)
DEMA (Double Exponential Moving Average)
WMA (Weighted Moving Average)
Each smoothing type has different properties, allowing traders to select the best fit for their trading style. The smoothing length can also be customized, offering flexibility in fine-tuning how sensitive or stable the trend lines should be.
Improved Signal Logic and Precision
The signal logic has been optimized for better precision. Now, the system provides more accurate buy and sell alerts based on:
Trend Detection: The color-coded cloud and the relative positions of the Fast, Middle, and Slow lines help visualize whether the trend is bullish or bearish.
Rising and Falling Indicators: The indicator also checks if each line is rising or falling over the last three bars, offering early signals of momentum shifts.
Dashboard Insights
The dashboard provides real-time updates on the positions and movements of the smoothed lines:
Line Positions: Displays the positions of the Fast, Middle, and Slow lines.
Trend Direction: Shows whether each line is rising or falling.
Price Levels: Displays the price levels for each of the smoothed lines, offering clear reference points for market evaluation.
These features help traders better understand the state of the market, offering valuable insights for both trend-following and reversal-based strategies.
Crossovers and Signal Triggers
The Improved Smooth Trend Shot focuses on crossovers between the different smoothed lines as primary trading signals. There are two types of crossovers:
Fast Shots: This occurs when the Fast line crosses the Slow line.
Slow Shots: This occurs when the Middle line crosses the Slow line.
These crossovers serve as key entry or exit points for traders, helping them spot potential trend reversals. The improved logic ensures that crossovers are accurately detected, reducing the chances of false signals.
Customization Options
The Improved Smooth Trend Shot offers a high degree of customization:
Smoothing Length: Adjust the smoothing period to balance between fast responses and stable trends.
Source Selection: Default to the average of high and low prices (hl2), or choose other price sources.
Smoothing Type: Select from EMA, SMA, DEMA, or WMA for personalized trend analysis.
Signal Type: Choose between Fast Shots or Slow Shots based on the type of crossover you want to focus on.
Long, Medium, and Short-Term Applications
Although the default settings are optimized for long-term trend analysis, the Improved Smooth Trend Shot is highly adaptable. By adjusting the smoothing length and selecting different smoothing types, traders can use the tool for:
Short-Term Trading: Focus on fast responses to market shifts using shorter smoothing periods.
Medium-Term Trading: Tailor the settings to capture intermediate trends.
Long-Term Trend Analysis: Use longer smoothing periods for a more stable and comprehensive view of market dynamics.
Advanced ATR Filtering and Alerts
The inclusion of ATR (Average True Range) filtering helps ensure that signals are triggered only when significant price movements occur. This helps reduce noise and false signals, ensuring traders only act on meaningful market shifts.
Conclusion
The Improved Smooth Trend Shot is a powerful and versatile tool that enhances the original SuperSmoother Filter with advanced features like customizable smoothing options, real-time alerts, and an intuitive dashboard. Whether you're a day trader, swing trader, or long-term investor, this enhanced indicator provides a comprehensive and actionable view of market trends.
The combination of enhanced signal accuracy, dynamic trend visualization, and in-depth customization ensures that the Improved Smooth Trend Shot is an indispensable tool for traders across all market conditions.
-Jeffrey

DAILY ATR LEVELS AND EXPECTED MOVE LEVELSThis Pine Script code is designed to visualize ATR (Average True Range) levels and expected move levels on a chart. It provides useful inputs for customizing how these levels are displayed, such as line width, style, and color. The script is divided into several sections, each focused on a different feature:
1. User Inputs for Customization:
- Line Width and Style: Users can customize the line width, style (solid, dotted, or dashed), and color for various levels.
- Offset for Line Placement: The rightOffset input controls how far in the future the lines extend (measured in minutes).
- Show Labels: Labels can be toggled on/off for ATR levels and expected move lines, with customizable text colors.
2. ATR Levels and ATR Settings:
- The ATR length (atrLength) and the multiplier (atrMultiplier) control the calculation of ATR levels.
- The script plots ATR levels based on the daily open price, including key levels like ATR +25%, ATR +50%, etc., for both positive and negative movements.
- Line Drawing: The script dynamically creates lines for each ATR level, and the lines are customized according to the user's inputs. For each level, the line.new function is used to plot a line from the start of the day (daily open) to a point offset in the future.
- Labels: Labels are added near each ATR level to make them more identifiable, such as "ATR +25%" or "Daily Open."
3. Expected Move Calculation and Logic:
- The script calculates the expected move for the next trading session based on the previous close price and the volatility derived from the VIX (Volatility Index).
- The expected move is calculated as a percentage of the previous close and is added and subtracted from the previous close price to generate upper and lower levels.
- Volatility Adjustment: The VIX value is adjusted by the square root of 252 (the number of average trading days in a year) to calculate the daily volatility.
- Upper and Lower Lines: Lines are drawn for the expected move's upper and lower bounds, showing the potential price movement based on volatility.
4. Customizable Expected Move Lines:
- Line Style and Color: The upper and lower expected move lines can be customized in terms of width, style, and color, as specified by the user.
- Labels for Expected Move Levels: Labels are added for the upper and lower expected move lines, such as "Expected Move Upper" and "Expected Move Lower."
5. Logic for Drawing Lines:
- The script continuously evaluates whether the levels should be displayed based on the user's preferences.
- If showATRLevels or showLineEM is enabled, the script will draw the respective lines and labels on the chart.
- It uses line.new to draw the lines and label.new to position the labels at the correct levels on the chart.
6. Handling Time and Line Deletion:
- The script handles the dynamic nature of the chart by deleting previous lines (using line.delete) to avoid cluttering the chart with outdated lines.
- The time for the lines is set dynamically using the startTime and endTime variables, ensuring that lines are drawn within the correct timeframe.
Summary of Key Features:
- ATR Levels: Plots key levels of ATR, such as daily open, ATR +25%, ATR -25%, etc., with customizable colors and line styles.
- Expected Move Levels: Calculates and plots the upper and lower bounds of the expected move based on the VIX and previous close price.
- Customization Options: Users can control the appearance (line width, style, color) and whether to show labels for the ATR and expected move levels.
- Dynamic Updates: The lines and labels update dynamically throughout the trading day, adjusting based on market conditions.
Overall, this script is designed to help traders visualize volatility and potential price movement on a daily chart by providing ATR-based levels and expected move projections. It offers a high degree of customization to suit different charting preferences.

ADR Table BY @ICT_YEROADR Table BY @ICT_YERO
Created by: @ICT_YERO
This custom indicator is designed to provide the Average Daily Range (ADR) for multiple timeframes, including Daily, 4-Hour, and 1-Hour. The indicator is tailored to assist traders in understanding price volatility and making informed trading decisions.
Key Features
Multi-Timeframe ADR Calculation:
Automatically calculates and displays the ADR for Daily, 4-Hour, and 1-Hour timeframes.
Helps traders identify potential price movement ranges for different trading sessions.
Dynamic Range Visualization:
Clear visual representation of the ADR on the chart, making it easy to spot price extremes.
Real-time updates to reflect changes in price movement.
Custom Alerts:
Option to set alerts when the price approaches the ADR high or low.
Useful for identifying potential reversal zones or breakout opportunities.
User-Friendly Interface:
Simple and intuitive settings to customize colors, levels, and display preferences.
Seamlessly integrates with your existing TradingView setup.
ICT-Inspired Methodology:
Designed for traders who follow ICT concepts, focusing on precision and high-probability setups.
Applications
Range Trading: Helps determine the high and low boundaries for scalping or intraday setups.
Volatility Analysis: Understand market behavior during different times of the day or week.
Reversal Zones: Identify areas where price is likely to reverse, based on ADR extremes.
Whether you're a scalper, day trader, or swing trader, this indicator provides a comprehensive overview of price volatility across multiple timeframes, making it an essential tool for your trading arsenal.

DAILY ATR LEVELSThis script is a custom technical indicator for use in TradingView, designed to display daily Average True Range (ATR) levels on the chart, along with the daily opening price. It provides a customizable way to track price levels relative to the daily ATR, which can be useful for traders looking for volatility-based price targets or ranges.
///////////////////////////////////////////////////////////////////////////////////////////////////////////////////////////////////////////////////////
Customization Options:
- Line Width: Determines the thickness of the plotted lines for the ATR levels and daily open line, ranging from 1 to 10.
- Right Offset (minutes): A time offset (in minutes) that shifts the end of the daily opening price line to the right for visual clarity.
- Line Style: The user can choose between solid, dashed, or dotted lines for all the plotted levels.
- Display Options: Users can toggle the visibility of the daily opening price line (showDayLevel), labels (showLabels), and ATR levels (showATRLevels).
- Colors: Customizable colors for the daily opening price line (dayLevelColor), labels (labelTextColor), and the ATR levels for both positive and negative values (atrLevelPlusColor and atrLevelMinusColor).
ATR Settings:
- ATR Length: Defines the number of periods (bars) to use when calculating the ATR. The default is 180, which corresponds to the ATR calculated on the daily chart using the last 180 bars.
- ATR Multiplier: Allows the user to scale the ATR levels by a multiplier (from 0.1 to 5.0), adjusting the sensitivity of the levels.
- ATR Levels: Users can toggle visibility for several predefined ATR levels, such as +25%, +50%, +75%, +100%, -25%, -50%, -75%, and -100%. These levels represent price points above or below the daily open based on the ATR.
///////////////////////////////////////////////////////////////////////////////////////////////////////////////////////////////////////////////////////
ATR Levels Calculation:
- The ATR is calculated based on the daily chart using the ta.atr() function with the specified ATR length, default is set at 180.
- The script computes multiple ATR levels above and below the daily open price, adjusting each level by 25%, 50%, 75%, and 100% of the ATR value (scaled by the ATR multiplier).
ATR Level Plotting:
- For each ATR level (positive and negative), a line is drawn across the chart at the corresponding price level.
- The color, line style, and width of these lines can be customized.
- Each ATR level also has an optional label showing the percentage level (e.g., "ATR +25%") at the specified price, which is positioned at the end of the line.
- The labels are removed from the previous bars to avoid clutter.
Workflow:
- The script first calculates the daily opening price using the request.security() function to pull the open price from the daily chart.
- It then calculates the ATR based on the selected length and multiplier.
- The start time for the daily open line is determined by the bar's timestamp at the start of the day, and the end time is adjusted using the user-defined right offset.
- After determining the relevant price levels (for the opening price and ATR levels), the script plots these levels on the chart as lines. It handles the drawing and deletion of lines to ensure that the chart remains updated in real time.
- If labels are enabled, text labels are displayed next to the ATR levels and the daily open line, providing clear markers for the user.
Practical Use:
- Volatility Analysis: This indicator is useful for identifying key price levels based on daily volatility (ATR). Traders can use it to set potential targets or support/resistance levels that are adjusted for volatility.
- Day Trading or Swing Trading: The daily opening price line helps traders quickly see where the price opened for the day, and the ATR levels give a dynamic range for the day's potential price movement.
Overall, this script is designed to provide a clear, customizable view of daily price levels in relation to the ATR, helping traders make informed decisions based on volatility and price action.

AI InfinityAI Infinity – Multidimensional Market Analysis
Overview
The AI Infinity indicator combines multiple analysis tools into a single solution. Alongside dynamic candle coloring based on MACD and Stochastic signals, it features Alligator lines, several RSI lines (including glow effects), and optionally enabled EMAs (20/50, 100, and 200). Every module is individually configurable, allowing traders to tailor the indicator to their personal style and strategy.
Important Note (Disclaimer)
This indicator is provided for educational and informational purposes only.
It does not constitute financial or investment advice and offers no guarantee of profit.
Each trader is responsible for their own trading decisions.
Past performance does not guarantee future results.
Please review the settings thoroughly and adjust them to your personal risk profile; consider supplementary analyses or professional guidance where appropriate.
Functionality & Components
1. Candle Coloring (MACD & Stochastic)
Objective: Provide an immediate visual snapshot of the market’s condition.
Details:
MACD Signal: Used to identify bullish and bearish momentum.
Stochastic: Detects overbought and oversold zones.
Color Modes: Offers both a simple (two-color) mode and a gradient mode.
2. Alligator Lines
Objective: Assist with trend analysis and determining the market’s current phase.
Details:
Dynamic SMMA Lines (Jaw, Teeth, Lips) that adjust based on volatility and market conditions.
Multiple Lengths: Each element uses a separate smoothing period (13, 8, 5).
Transparency: You can show or hide each line independently.
3. RSI Lines & Glow Effects
Objective: Display the RSI values directly on the price chart so critical levels (e.g., 20, 50, 80) remain visible at a glance.
Details:
RSI Scaling: The RSI is plotted in the chart window, eliminating the need to switch panels.
Dynamic Transparency: A pulse effect indicates when the RSI is near critical thresholds.
Glow Mode: Choose between “Direct Glow” or “Dynamic Transparency” (based on ATR distance).
Custom RSI Length: Freely adjustable (default is 14).
4. Optional EMAs (20/50, 100, 200)
Objective: Utilize moving averages for trend assessment and identifying potential support/resistance areas.
Details:
20/50 EMA: Select which one to display via a dropdown menu.
100 EMA & 200 EMA: Independently enabled.
Color Logic: Automatically green (price > EMA) or red (price < EMA). Each EMA’s up/down color is customizable.
Configuration Options
Candle Coloring:
Choose between Gradient or Simple mode.
Adjust the color scheme for bullish/bearish candles.
Transparency is dynamically based on candle body size and Stochastic state.
Alligator Lines:
Toggle each line (Jaw/Teeth/Lips) on or off.
Select individual colors for each line.
RSI Section:
RSI Length can be set as desired.
RSI lines (0, 20, 50, 80, 100) with user-defined colors and transparency (pulse effect).
Additional lines (e.g., RSI 40/60) are also available.
Glow Effects:
Switch between “Dynamic Transparency” (ATR-based) and “Direct Glow”.
Independently applied to the RSI 100 and RSI 0 lines.
EMAs (20/50, 100, 200):
Activate each one as needed.
Each EMA’s up/down color can be customized.
Example Use Cases
Trend Identification:
Enable Alligator lines to gauge general trend direction through SMMA signals.
Timing:
Watch the Candle Colors to spot potential overbought or oversold conditions.
Fine-Tuning:
Utilize the RSI lines to closely monitor important thresholds (50 as a trend barometer, 80/20 as possible reversal zones).
Filtering:
Enable a 50 EMA to quickly see if the market is trading above (bullish) or below (bearish) it.

Catalyst TrendCatalyst Trend – A Comprehensive Trend and Regime Analyzer
The Catalyst Trend indicator was designed to dynamically and intuitively merge various classic analytical techniques. The goal is to filter out short-term market noise and reveal reliable trend phases or potential turning points. Below is a detailed explanation of its core elements and practical usage.
1. Concept and Idea
Multidimensional Trend Detection
This indicator goes beyond a simple momentum or volatility focus. It factors in multiple measurements to provide a more well-rounded market perspective.
Versatile Indicator Fusion
Linear Regression (LinReg): Multiple LinReg calculations are combined to smooth out price fluctuations and produce a robust trendline—known here as the “Cycle Reduced Line.”
ADX (Average Directional Index): Measures trend strength.
RSI (Relative Strength Index): Flags potential overbought or oversold conditions, in both the current timeframe and a higher timeframe.
ATR (Average True Range): Assesses volatility; used to dynamically adjust calculation lengths.
By weaving these elements together, the indicator adds value beyond simply stacking multiple indicators. It adapts to real-time market conditions, aiming to highlight genuine trends and reduce false signals.
2. Key Functions and Calculations
Dynamic Length & Smoothing
A blend of volatility (ATR), ADX values, and RSI inputs determines how many candles are used in the LinReg calculations and how heavily the data is smoothed.
This allows the indicator to respond promptly during periods of high volatility, while automatically adjusting to filter out unnecessary noise in quieter phases.c
Cycle Reduced Line
The script averages several offset LinReg calculations to produce a cleaner overall signal. Random outliers are thus minimized, making the trend path more visually consistent.
An additional EMA smoothing (“Final Smoothing”) further stabilizes this trendline, reducing the impact of minor price fluctuations.
Channel Bands (Optional)
These bands are derived from the standard deviation of the price residual (the difference between the smoothed price and the trendline).
They highlight potential over-extension zones: the upper band can mark short-term overbought areas, while the lower band might indicate oversold conditions.
Trend and Sideways Determination
Slope Calculation: The slope of the trendline (comparing the current bar to the previous one) helps identify short-term directional shifts.
DX Threshold: Once the ADX surpasses a user-defined threshold and the slope is positive, it may indicate a developing uptrend. Similarly, if the slope is negative and ADX > threshold, it could signal a potential downtrend.
Multi-Level Color Coding
Original Mode: Interpolated colors reflect uptrends, downtrends, and sideways phases, factoring in metrics like ADX and RSI.
Single Color: For a neutral look, the indicator can be displayed in one uniform color.
HTF RSI: This mode uses the higher-timeframe RSI to color the trendline (Long/Short/Neutral), offering a quick gauge of overarching market pressure.
3. Use Cases and Interpretation
Timeframes & Markets
The indicator is versatile and adapts well to different intervals, from 5-minute charts to weekly views.
It can be applied to various markets—crypto, forex, stocks—since volatility and trend strength are universal concepts.
Signal Recognition
Color Swings into a more pronounced upward hue (e.g., green) may signal mounting strength.
Neutral or mixed tones often point to sideways phases, which breakout traders might watch for potential price surges.
A shift to downward colors (e.g., red) may indicate a growing bearish trend.
Channel Bands & Volatility
When the bands spread widely, it’s wise to proceed with caution: abrupt spikes above the upper band or below the lower band can flag rapid short-term extremes.
These bands are more of a reference for potential overextension than a strict buy or sell trigger.
Additional Confirmations
Not a standalone panacea: The Catalyst Trend indicator is an analytical tool, best used alongside other methods such as volume analysis or price action (candlestick patterns, support/resistance levels) to bolster confidence in trading decisions.
4. Practical Tips
Parameter Adjustments
Depending on the market—crypto vs. traditional currency pairs—different ADX, RSI, or smoothing periods may be more effective. Experiment with the settings to tailor the indicator to your preferred timeframe.
Strategic Integration
Trailing Stops: For those riding a trend, the trendline or the channel bands may serve as a reference to trail stop-loss orders.
Trend Confirmation: Using RSI and ADX filters can help traders avoid sideways markets or stay the course when the trend is strong.
5. Important Final Notes
No Guarantee of Profits
No indicator can predict the future. Markets are inherently volatile and often unpredictable.
Responsible Risk Management
Test the indicator in a demo environment or with smaller positions before committing to large trades.

DAILY Supertrend + EMA Crossover with RSI FilterThis strategy is a technical trading approach that combines multiple indicators—Supertrend, Exponential Moving Averages (EMAs), and the Relative Strength Index (RSI)—to identify and manage trades.
Core Components:
1. Exponential Moving Averages (EMAs):
Two EMAs, one with a shorter period (fast) and one with a longer period (slow), are calculated. The idea is to spot when the faster EMA crosses above or below the slower EMA. A fast EMA crossing above the slow EMA often suggests upward momentum, while crossing below suggests downward momentum.
2. Supertrend Indicator:
The Supertrend uses Average True Range (ATR) to establish dynamic support and resistance lines. These lines shift above or below price depending on the prevailing trend. When price is above the Supertrend line, the trend is considered bullish; when below, it’s considered bearish. This helps ensure that the strategy trades only in the direction of the overall trend rather than against it.
3. RSI Filter:
The RSI measures momentum. It helps avoid buying into markets that are already overbought or selling into markets that are oversold. For example, when going long (buying), the strategy only proceeds if the RSI is not too high, and when going short (selling), it only proceeds if the RSI is not too low. This filter is meant to improve the quality of the trades by reducing the chance of entering right before a reversal.
4. Time Filters:
The strategy only triggers entries during user-specified date and time ranges. This is useful if one wants to limit trading activity to certain trading sessions or periods with higher market liquidity.
5. Risk Management via ATR-based Stops and Targets:
Both stop loss and take profit levels are set as multiples of the ATR. ATR measures volatility, so when volatility is higher, both stops and profit targets adjust to give the trade more breathing room. Conversely, when volatility is low, stops and targets tighten. This dynamic approach helps maintain consistent risk management regardless of market conditions.
Overall Logic Flow:
- First, the market conditions are analyzed through EMAs, Supertrend, and RSI.
- When a buy (long) condition is met—meaning the fast EMA crosses above the slow EMA, the trend is bullish according to Supertrend, and RSI is below the specified “overbought” threshold—the strategy initiates or adds to a long position.
- Similarly, when a sell (short) condition is met—meaning the fast EMA crosses below the slow EMA, the trend is bearish, and RSI is above the specified “oversold” threshold—it initiates or adds to a short position.
- Each position is protected by an automatically calculated stop loss and a take profit level based on ATR multiples.
Intended Result:
By blending trend detection, momentum filtering, and volatility-adjusted risk management, the strategy aims to capture moves in the primary trend direction while avoiding entries at excessively stretched prices. Allowing multiple entries can potentially amplify gains in strong trends but also increases exposure, which traders should consider in their risk management approach.
In essence, this strategy tries to ride established trends as indicated by the Supertrend and EMAs, filter out poor-quality entries using RSI, and dynamically manage trade risk through ATR-based stops and targets.

ATR/DTR with Custom Percentage DisplayThis Pine Script indicator provides a detailed view of the Average True Range (ATR) and Daily True Range (DTR), along with additional calculated metrics to assist in analyzing price volatility. The key features of the indicator include:
ATR Calculation:
The ATR is calculated over a user-defined timeframe, allowing traders to assess average market volatility over a specific period.
DTR Calculation:
The DTR represents the absolute range (high - low) of the current or chosen timeframe, providing insights into the day's price movement.
ATR/DTR Percentage:
This metric calculates the DTR as a percentage of the ATR, showing how the daily range compares to the average range, with dynamic coloring to highlight when it exceeds a user-defined threshold.
Custom Percentage of ATR:
Users can input a custom percentage to calculate and display a corresponding value of the ATR. For example, entering 15% will compute and display 15% of the ATR in the indicator’s table.
Dynamic Table Display:
The indicator outputs all these metrics in a well-organized table that is overlaid on the chart. The table includes:
ATR
DTR
ATR/DTR percentage
The user-defined percentage of ATR
Customizable Features:
Color Coding: The table dynamically changes its background color when the ATR/DTR percentage exceeds a user-defined threshold.
Placement Options: The table's position on the chart can be adjusted (e.g., bottom-right, top-center) for optimal visibility.
Use Case:
This indicator is ideal for traders who want a deeper understanding of market volatility and prefer visual representation of how current price movements compare to historical averages. It is especially useful for:
Setting volatility-based stop-loss levels.
Identifying high-volatility trading opportunities.
Tailoring strategies around price movement patterns.

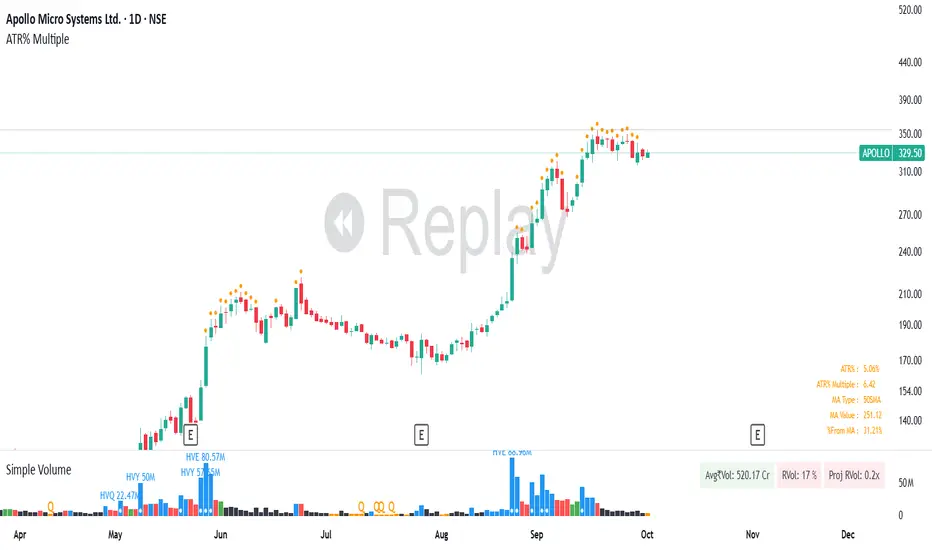
ATR% multiple historyThe average true range (ATR) is a technical analysis indicator introduced by market technician J. Welles Wilder Jr. in his book New Concepts in Technical Trading Systems. It measures market volatility by decomposing the entire range of an asset's price for that period.
The true range is calculated as the greatest of the following: the current high minus the current low; the absolute value of the current high minus the previous close; and the absolute value of the current low minus the previous close.
The ATR is then a moving average, generally using 14 days, of the true ranges. Therefore, the parameter "Length" in this indicator is set to 14 by default.
This indicator offers three "Smoothing" techniques: RMA, SMA, and EMA, to calculate ATR. RMA is set as the default.
ATR% is calculated by dividing the ATR by the close of the latest bar.
The ATR% multiple builds on ATR%, serving as a measurable gauge of price extension from 50-MA. It is calculated by dividing the distance between the price and the 50-MA by ATR%. Users can change how the distance between the price and the 50-MA is calculated by switching the "Price" parameter among the high, close, and open of the bar.
Each security has a historical ATR% multiple at which it tends to retrace. This is not necessarily a "short" signal. Instead, it can be used as a signal to sell further into strength or avoid initiating new/additional entries.
ATR% multiples from the 50-MA can also be used as a tool for monitoring market indices, assessing technical headwinds versus tailwinds, and determining whether to take on risk or hold positions and wait.
This indicator can show the real-time ATR% multiple from the 50-MA as well as historical data. As shown in the chart above, SPY usually pulls back at over a 5X ATR% multiple in its history, so new exposures can be avoided at that time.
There are five horizontal lines in this indicator, with values of 0, 4, 6, 8, and 10. These five lines can be hidden, and their colors and line widths can be customized. When the ATR% multiple drops below zero, the line's color turns red.

Visual ATR StopThis indicator uses the Average True Range (ATR) to display a visual range for stop placement. Two multiplier values (example, 1 and 3) can be set to create a filled area below the price. This area represents the range between the two ATR levels, adjusted by subtracting the current price, providing a simple way to visualize stop-loss placement based on volatility.
The indicator is customizable; for example, negative values can place the area above the price for short positions. The filled color can also be removed, which allows precise levels to be marked above and below.

Precision Trading Strategy: Golden EdgeThe PTS: Golden Edge strategy is designed for scalping Gold (XAU/USD) on lower timeframes, such as the 1-minute chart. It captures high-probability trade setups by aligning with strong trends and momentum, while filtering out low-quality trades during consolidation or low-volatility periods.
The strategy uses a combination of technical indicators to identify optimal entry points:
1. Exponential Moving Averages (EMAs): A fast EMA (3-period) and a slow EMA (33-period) are used to detect short-term trend reversals via crossover signals.
2. Hull Moving Average (HMA): A 66-period HMA acts as a higher-timeframe trend filter to ensure trades align with the overall market direction.
3. Relative Strength Index (RSI): A 12-period RSI identifies momentum. The strategy requires RSI > 55 for long trades and RSI < 45 for short trades, ensuring entries are backed by strong buying or selling pressure.
4. Average True Range (ATR): A 14-period ATR ensures trades occur only during volatile conditions, avoiding choppy or low-movement markets.
By combining these tools, the PTS: Golden Edge strategy creates a precise framework for scalping and offers a systematic approach to capitalize on Gold’s price movements efficiently.

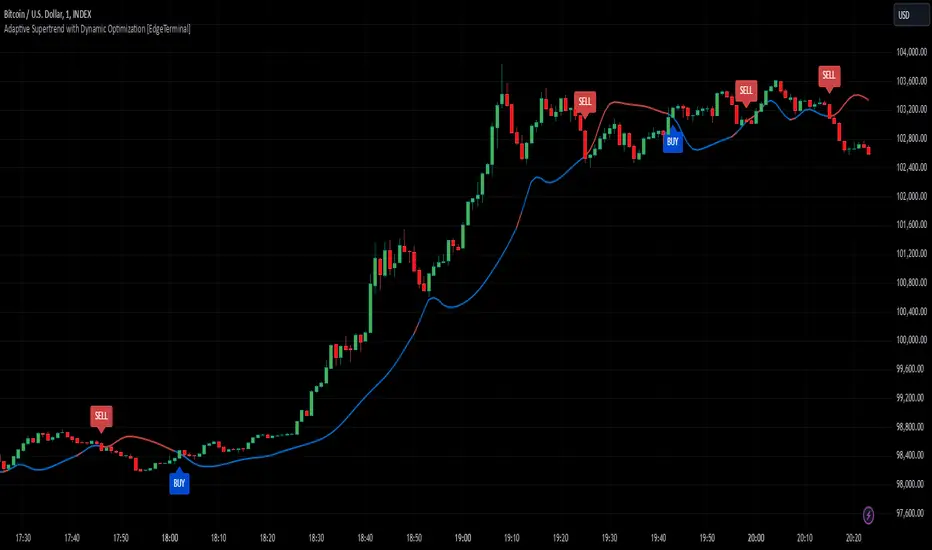
Adaptive Supertrend with Dynamic Optimization [EdgeTerminal]The Enhanced Adaptive Supertrend represents a significant evolution of the traditional Supertrend indicator, incorporating advanced mathematical optimization, dynamic volatility adjustment, intelligent signal filtering, reduced noise and false positives.
Key Features
Dynamic volatility-adjusted bands
Self-optimizing multiplier
Intelligent signal filtering system
Cooldown period to prevent signal clustering
Clear buy/sell signals with optimal positioning
Smooth trend visualization
RSI and MACD integration for confirmation
Performance-based optimization
Dynamic Band Calculation
Dynamic Band Calculation automatically adapts to market volatility, generates wider bands in volatile periods, reducing false signals. It also generates tighter bands in stable periods, capturing smaller moves and smooth transitions between different volatility regimes.
RSI Integration
The RSI and MACD play multiple crucial roles in the Adaptive Supertrend.
It first helps with momentum factor calculation. This dynamically adjusts band width based on momentum conditions. When the RSI is oversold, bands widen by 20% to prevent false signals during strong downtrends and provide more room for price movements in extreme conditions.
When the RSI is overbought, brands tighten by 20% and they become more sensitive to potential reversals to help catch trend changes earlier.
This reduces false signals in strong trends, helps detect potential reversals earlier than the usual, create adaptive band width based on market conditions and finally, better protection against whipsaws.
MACD Integration
The MACD in this supertrend indicator serves as a trend confirmation tool. The idea is to use MACD crossovers to confirm trend changes to reduce false trend change signals and enhance the signal quality.
For this to become a signal, MACD crossovers must align with price movement to help filter out weak or false signals, which acts as an additional layer of trend confirmation.
Additionally, MACD line position relative to signal line indicates trend strength, helps maintain positions in strong trends and assists in early detection of trend weakening.
Momentum Integration
Momentum Integration prevents false signals in extreme conditions, It adjusts dynamic bands based on market momentum, improves trend confirmation in strong moves and reduces whipsaws during consolidations.
Improved signals
There are a few systems to generate better signals, allowing for generally faster signals compared to original supertrend, such as:
Enforced cooldown period between signals
Prevents signal clustering
Clearer entry/exit points
Reduced false signals during choppy markets
Performance Optimization
This script implements a Sharpe ratio-inspired optimization algorithm to balance returns against risk, penalize large drawdowns, adapt parameters in real-time and improve risk-adjusted performance
Parameter Settings
ATR Period: 10 (default) - adjust based on timeframe
Initial Multiplier: 3.0 (default) - will self-optimize
Optimization Period: 50 (default) - longer periods for more stability
Smoothing Period: 3 (default) - adjust for signal smoothness
Best Practices
Use on multiple timeframes for confirmation
Allow the optimization process to run for at least 50 bars
Monitor the adaptive multiplier for trend strength indication
Consider RSI and MACD alignment for stronger signals
Icaro [VekiSeba]
Icaro Indicator: Monitoring Price Extensions
Overview
The Icarus Indicator is a tool designed to help traders identify critical points in the price movements of financial assets. Inspired by the Greek myth of Icarus , this indicator alerts on potential exhaustions in bullish movements or significant price extensions. It is ideal for traders looking to optimize profitability and make strategic decisions on when to exit a position, thereby minimizing the risk of dramatic price reversals.
How the Indicator Works: The Icarus Indicator combines various volatility and trend metrics to provide signals:
ATR (Average True Range): Measures the asset’s volatility, providing insight into the intensity of price movements. This component is crucial for understanding the strength behind the asset’s fluctuations.
Gain from Average Trend: This metric calculates how much the current price has deviated from an average trend line. It helps identify how extended or overvalued the price might be in relation to its overall trend.
ATR Acceleration: Assesses how the pace of volatility change compares to its recent average, indicating rapid changes in volatility that might suggest an increase in momentum or an early warning of overextension.
Visual Signals:
Wing Momentum (Purple Cross): Indicates a significant increase in volatility acceleration, suggesting that the price may be entering a phase of unusual momentum. There is also the potential that this signal could lead to a correction.
Solar Roof (Red Circle): Activates when the price reaches an exhaustion level as defined by the user’s threshold, indicating a possible turning point or correction.
NASDAQ:SMCI
Configuration and Use: Users can customize the "Flight Threshold" to adjust the sensitivity of the indicator to their specific trading strategies. Modifying this threshold allows the indicator to be less or more reactive to the asset’s fluctuations.
Originality and Utility of the Indicator: Icarus stands out from other indicators with its unique focus on measuring volatility, offering a dynamic perspective on the asset's conditions. A notable feature of Icarus is its ability to reduce the number of false signals through its specialized formula, which prioritizes accuracy over the frequency of alerts. Although this may mean that the indicator does not react to all price extensions and might occasionally overlook some, it is intentionally designed to provide a higher percentage of correct signals when it does issue an alert. This "lower frequency, higher accuracy" approach is particularly valuable for traders who prefer the quality of signals over quantity, thus minimizing reactions to incorrect market movements and optimizing trading decisions based on highly reliable indicators. However, it is important to note that no indicator, including Icarus, can guarantee 100% effectiveness. Indeed, we cannot quantify the exact success rate of Icarus, as its performance can vary widely depending on the volatility of each asset and the market context at any given time.

ATR% Multiple from Key Moving AverageThis script gives signal when the ATR% multiple from any chosen moving average is beyond the configurable threshold value. This indicator quantifies how extended the stock is from a given key moving average.
A lot of traders use ATR% multiple from 10DMA, 21EMA, 50SMA or 200SMA to determine how extended a stock is and accordingly sell partials or exit. By default the indicator takes 50SMA and when the ATR% multiple is greater than 7 then it gives the signal to take partials. You can back test this indicator with previous trades and determine the ideal threshold for the signal. For small and midcaps a threshold of 7 to 10 ATR% multiples from 50SMA is where partials can be taken while large caps can revert to mean even earlier at 3 to 5 ATR% multiples from 50SMA.
You can modify this script and use it anyway you please as long as you make it opensource on TradingView.
Position Sizing Calculator (Real-Time)█ SUMMARY
The following indicator is a Position Sizing Calculator based on Average True Range (ATR), originally developed by market technician J. Welles Wilder Jr., intended for real-time trading.
This script utilizes the user's account size, acceptable risk percentage, and a stop-loss distance based on ATR to dynamically calculate the appropriate position size for each trade in real time.
█ BACKGROUND
Developed for use on the 5-minute timeframe, this script provides traders with continuously updated, dynamic position sizes. It enables traders to instantly determine the exact number of shares and dollar amount to use for entering a trade within their acceptable risk tolerance whenever a trade opportunity arises.
This real-time position sizing tool helps traders make well-informed decisions when planning trade entries and calculating maximum stop-loss levels, ultimately enhancing risk management.
█ USER INPUTS
Trading Account Size: Total dollar value of the user's trading account.
Acceptable Risk (%): Maximum percentage of the trading account that the user is willing to risk per trade.
ATR Multiplier for Stop-Loss: Multiplier used to determine the distance of the stop-loss from the current price, based on the ATR value.
ATR Length: The length of the lookback period used to calculate the ATR value.

Ultimate Volatility RateUltimate Volatility Rate
This indicator measures the volatility of price movements.
Support and Resistance Identification:
High volatility periods indicate larger price movements, which can be useful in assessing the potential for support and resistance levels to be broken.
Stop Loss (SL) and Take Profit (TP) Calculations:
The average volatility can be used to calculate dynamic Stop Loss (SL) and Take Profit (TP) levels:
SL: Placing it at a certain volatility multiplier below/above the entry price.
TP: Setting it at a certain volatility multiplier below/above the entry price.
For example:
SL: Entry price +/- (UVR × 1.5)
TP: Entry price +/- (UVR × 2)
Market Condition Analysis:
When the indicator value is high, it suggests that the market is volatile (active).
When the value is low, it indicates the market is in consolidation (sideways movement).
This information helps traders decide whether to take trend-following or consolidation-based positions.
Trend Reversal Monitoring:
A sudden increase in volatility often signals the start of a strong trend.
Conversely, a decrease in volatility can signal the slowing down or end of a trend.
