Kozlod - Yet Another Moving Average Cross Alerts (9 MA types)You can choose one of these MA types in params:
Simple Moving Average ( SMA )
Exponential Moving Average ( EMA )
Weighted Moving Average ( WMA )
Arnaud Legoux Moving Average ( ALMA )
Hull Moving Average ( HMA )
Volume-weighted Moving Average ( VWMA )
Least Square Moving Average ( LSMA )
Smoothed Moving Average ( SMMA )
Double Exponential Moving Average ( DEMA )
Also you can select SL/PT % levels.
There are 4 alerts available: LONG/SHORT/EXIT LONG/EXIT SHORT
Same script as strategy:
Alma

Kozlod - Yet Another Moving Average Cross Strategy (9 MA types)You can choose one of these MA types in params:
Simple Moving Average (SMA)
Exponential Moving Average (EMA)
Weighted Moving Average (WMA)
Arnaud Legoux Moving Average (ALMA)
Hull Moving Average (HMA)
Volume-weighted Moving Average (VWMA)
Least Square Moving Average (LSMA)
Smoothed Moving Average (SMMA)
Double Exponential Moving Average (DEMA)
Also you can select SL/PT % levels.

Multi-Bollinger [DW]This is an experimental study designed to visualize trend activity and volatility using a set of two Bollinger Bands calculated with a basis moving average type of your choice.
The available moving averages in this script are:
-Exponential Moving Average
-Simple Moving Average
-Weighted Moving Average
-Volume Weighted Moving Average
-Hull Moving Average
-Least Squares Moving Average
-Arnaud Legoux Moving Average
-Coefficient of Variation Weighted Moving Average
-Fractal Adaptive Moving Average
-Kaufman's Adaptive Moving Average
In addition, a middle filter is calculated by taking the median of the two basis lines.
Multi-Timeframe functionality is included. You can choose any timeframe that Tradingview supports as the basis resolution for the bands.
Custom bar color scheme is included with four options to choose from.

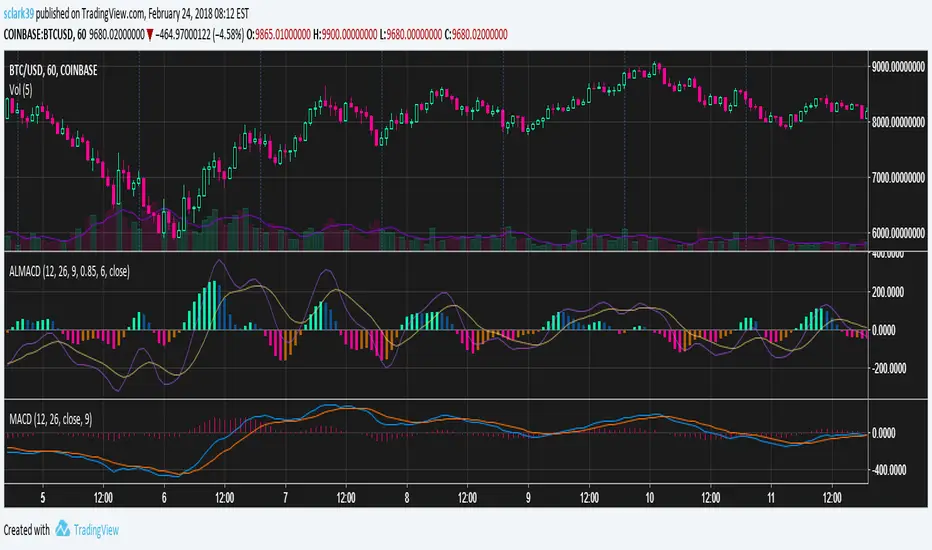
Arnaud Legoux MACD (ALMA, 4 Color, Color-blind Friendly)MACD built out of two Arnaud Legoux Moving Average lines of different periods. The signal line is still an EMA of the MACD line, just like with the normal MACD.
Colors are picked to be friendly with partial colorblindness, and can be modified in the indicator settings.
Squeeze Box [DW]This is an experimental study designed using data from Bollinger Bands to determine price squeeze ranges and active levels of support and resistance.
First, a set of Bollinger Bands using a Coefficient of Variation weighted moving average as the basis is calculated.
Then, the relative percentage of current bandwidth to maximum bandwidth over the specified sampling period determines the relative squeeze.
The box is outlined by drawing the current highest and lowest source value over the sampling period whenever a squeeze is active.
I've included the COVWMA in the visualization for additional confirmation of price activity.
Custom Bar color scheme is included.

Stratus [DW]This is an experimental study designed to identify trend activity, and potential support and resistance areas.
First, Coefficient of Variation Weighted Moving Average (COVWMA) is calculated, and its intersection points are used as anchor values.
Next, a fast period COVWMA calculated for a signal line.
For the cloud, its mid level is calculated first by taking the median of the range between price and the last anchor value.
The upper and lower cloud values are calculated by slicing the range in half two more times on each side. The result looks similar to stratus clouds, hence the name.
Finally, the result is offset by half of the specified period.
Custom bar colors are included.

Ultra RSI [DW]This is an RSI Variation with six different averaging methods to choose from.
The averaging methods I've included in this script are:
- Exponential Moving Average
- Simple Moving Average
- Smoothed Moving Average
- Weighted Moving Average
- Volume Weighted Moving Average
- Arnaud Legoux Moving Average
Each method produces a different, yet significant gauge of relative strength.
Custom bar colors are included.

Ultra MACD [DW]This is a variation of Gerald Appel's MACD with seven moving average source types to choose from.
The MA types I've included in this script are:
- Kaufman's Adaptive Moving Average
- Geometric Moving Average
- Hull Moving Average
- Volume Weighted Moving Average
- Least Squares Moving Average
- Arnaud Legoux Moving Average
- Exponential Moving Average
Custom bar color scheme is included with two different colorization methods - one based on the MACD, and the other based on the histogram.

Moving Average Range Channels [DW]This study is an experiment based off the concept used in my Dynamic Range Channel indicator.
Rather than using a McGinley Dynamic, a moving average of your choice is used in this calculation.
There are eight different moving average types to choose from in this script:
- Kaufman's Adaptive Moving Average
- Geometric Moving Average
- Hull Moving Average
- Volume Weighted Moving Average
- Least Squares Moving Average
- Arnaud Legoux Moving Average
- Exponential Moving Average
- Simple Moving Average
For a more refined picture of volatility, I've added upper and lower extension channels. They are calculated by adding the upper half range to the channel high, and subtracting the lower half range from the channel low.
The new custom bar color scheme indicates trends, midline crosses, MA crosses, and overbought and oversold conditions.

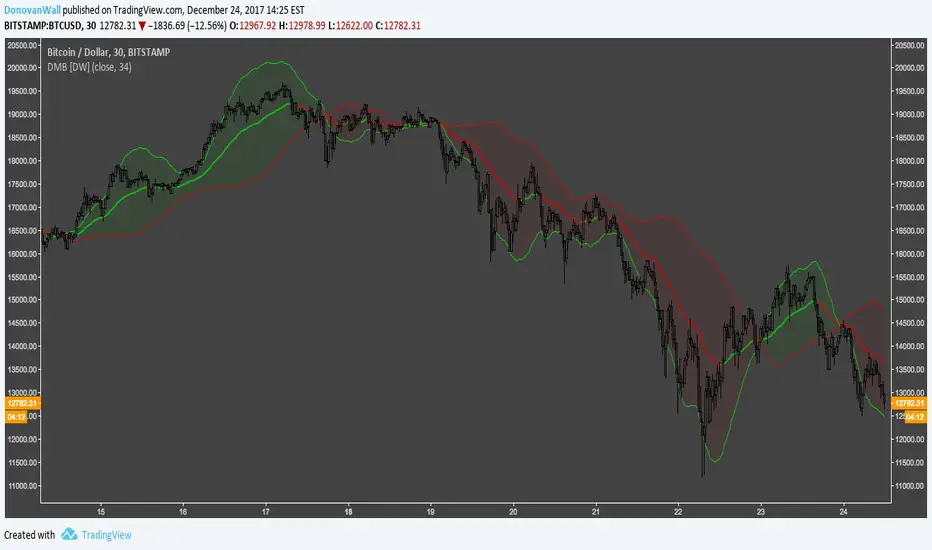
Directional Movement Bands [DW]This is a simple experimental study designed to outline trend activity and volatility.
In this study, the amount of change between current source and source of a specified lookback is calculated, then added to and subtracted from current source.
Next an exponential moving average is taken of the values for smoothing over the specified period.
Lastly, a midline is generated by taking the median of both bands.
Idō Heikin Ichimoku [DW]This is an experimental study inspired by Goichi Hosoda's Ichimoku Kinkō Hyō.
In this study, a McGinley Dynamic replaces the Tenkan-Sen and Kaufman's Adaptive Moving Average replaces the Kijun-Sen.
The cloud is calculated by taking the mean of the highest high and lowest low, adding a golden mean standard deviation above and below, and offsetting it over the specified period.
The lagging span is calculated by offsetting the closing price by the same amount as the cloud period.

Fibonacci Time Moving Average Ribbons [DW]This is an experimental study that takes a moving average of price, then offsets the average by up to 11 consecutive Fibonacci numbers from 1 to 144.
Choose between Kaufman's Adaptive Moving Average, Hull Moving Average, Fractal Adaptive Moving Average, Geometric Moving Average, or Exponential Moving Average.

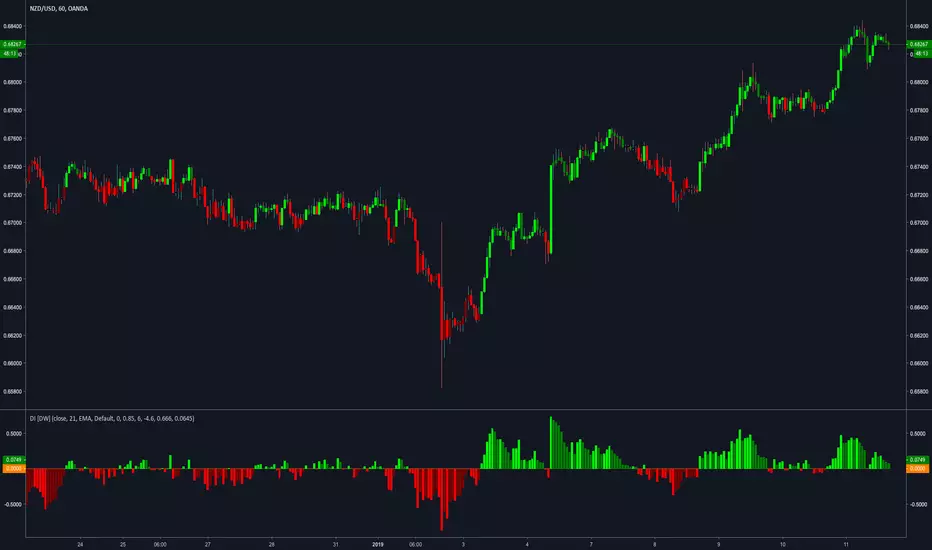
Disparity Index [DW]This is an iteration of Steve Nison's Disparity Index that includes 5 different moving average types to choose from.


ALMA Candles V1.0 by @overratedtraderChanges the solid colored candles based on the price action around the Arnaud Legoux Moving Average. Please modify / improve and share with the community.
B3 ALMA PendulumB3 Pendulums, quick little indicators that do change print inside the current bar, so beware. It is good for anticipation, but it is important to make sure the current and next bars follow through.
Ever wanted an indicator that really points out the micro term action in the form of a pendulum swing? This my attempt to show the market ups and downs in the smallest amount of lag possible. This indicator is designed to bounce back and forth from 100 to -100 as it shows you the price's relationship to ALMA. Really its just a simple deviance from mean study made to amplify the quick ups and downs, and kind of the neatest on Heikin Ashi setups. It looks like Arabic language at first glance, lol.
This should be easy to template out to your own MA's. ~I hope you are enjoying the B3 scripts, that is now 9 open source shares and a couple protected ones. I still plan on a few more give-a-ways, as I prepare some of the algorithmic things I do for subscription. Feel free to comment about things you would like to see! ~B3

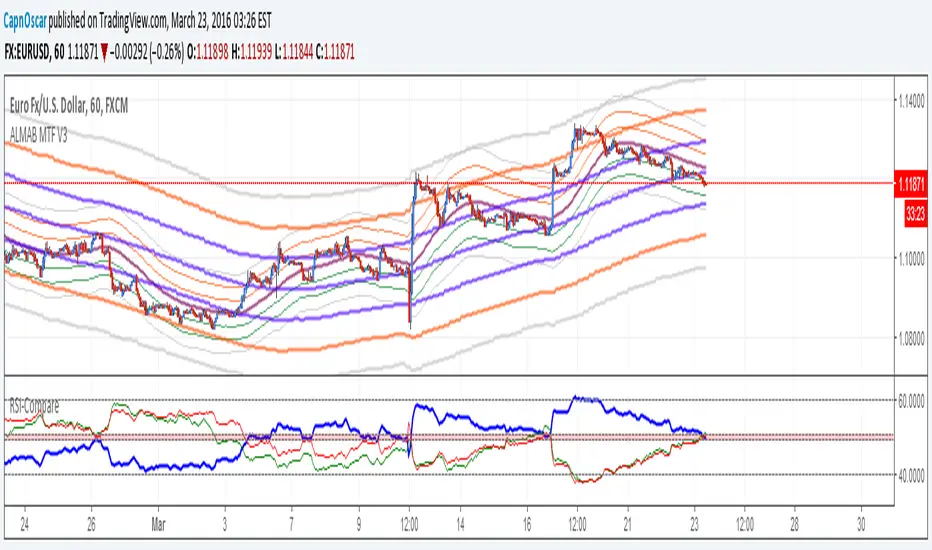
Arnaud Legoux Moving Average Bands MTF V3Ok I got it.. This is final with ALMA Bands.. You can ignore last 2 because this one covers all if you are interested.. If you like to know why I prefer ALMA for Bands this website may give you some insight. www.arnaudlegoux.com