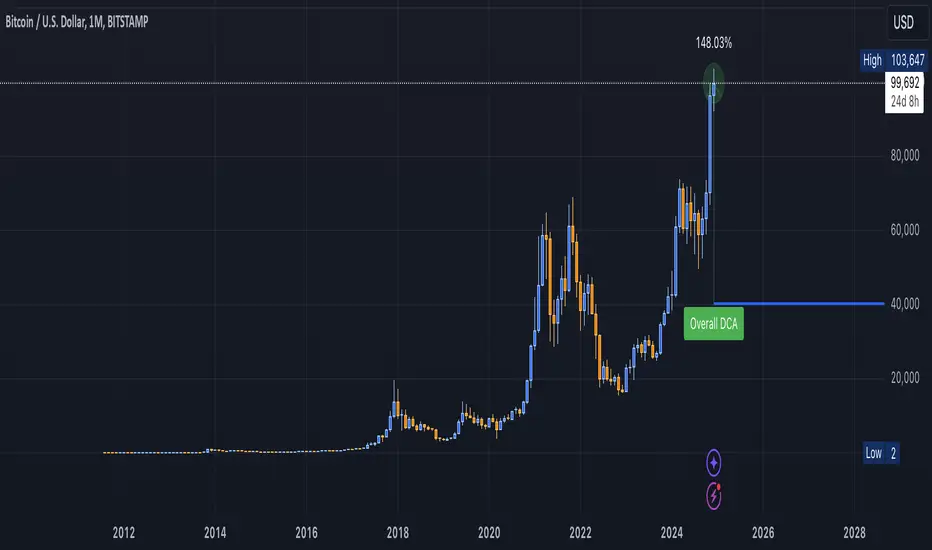
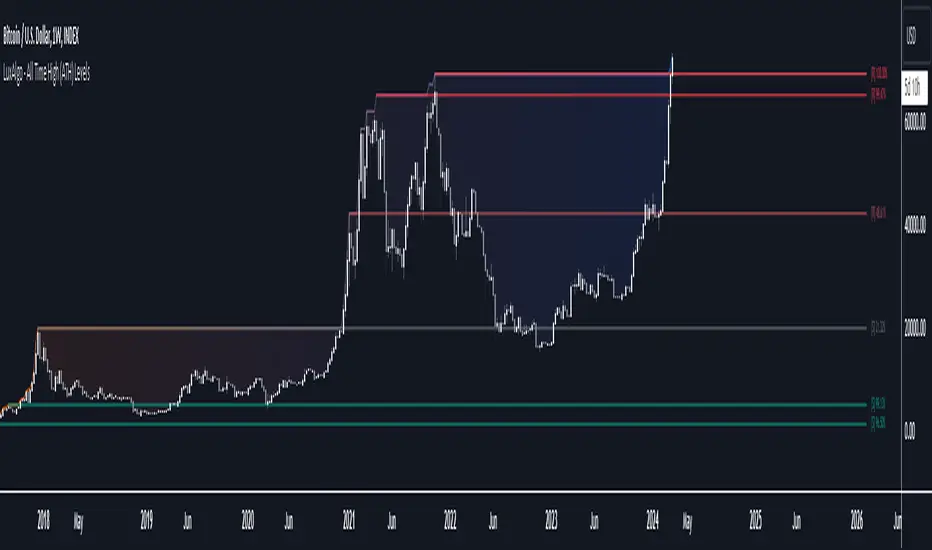
ATH/ATL/DaysThis indicator displays the All-Time High (ATH) and All-Time Low (ATL) — or more precisely, the highest and lowest price within the last N days. It works on any timeframe and uses only local chart data (no security() calls), ensuring stable and accurate results.
It plots horizontal lines for both the ATH and ATL and includes a clean, compact table showing:
Date of the extreme
Days since it occurred
Price
% distance from current price
$ distance from current price
A reliable tool for identifying local extremes, spotting market structure shifts, and tracking short-term price ranges.
Indikator Pine Script®