OPEN-SOURCE SCRIPT
Diupdate [ChasinAlts] All-Timers [MO]
*** PLEASE NOTE: THIS SCRIPT WILL MAKE TV's SERVERS FLEX IT'S MUSCLES SO IT WILL SLOW DOWN OTHER PROCESSES WITHIN TV (HIDE THEM IF NECESSARY TO REGAIN THE SPEED/FUNCTION...OR DELETE THEM...WHAT DO I CARE???) ESP IF YOU HAVE 3-4 ITERATIONS AS I DO TO SHOW THE WHOLE KUCOIN MARGIN MARKET ***
G'day Tradeurs, Hope everyone is having a FAN-FRIGGIN-TASTIC DAY!!! Right now (November 2nd, 2022) is a GREAT time to look for coins that are near their ALL-Time Low
due to the incoming bull market rearing its head around the corner (I'd wait for ONE MORE big dump to be safe though). And how GREAT would it be to even have
$50 of a coin with 10X leverage (I wouldn't suggest this to others though) at the near bottom said market? That is the reason for me publishing this.
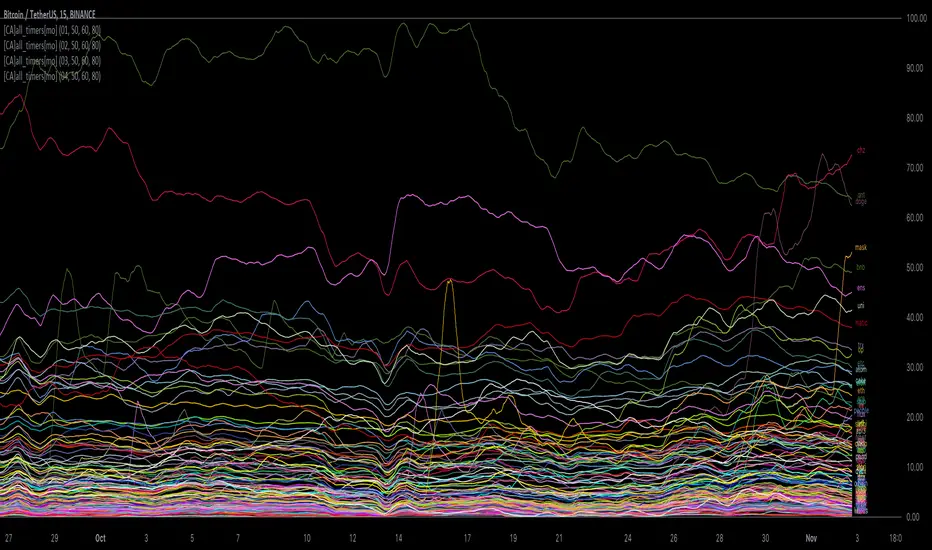
This is a quick little scanner script thats part of my "Market Overview" series. Nothing monumental or advanced regarding the ATH/ATL calculations.
Perhaps one thing slightly different here than others is both the % from ATH and % from ATL is calculated and the result is the % that the price is between it's ATH/ATL.
So, it will show the All Time High/All Time Low BUT ONLY to the extent that the TF will allow. Ie. For the Free Planned Users, they can only get data as far back as
5,000 bars would provide. Thus, the ATH/ATL will not show the ACTUAL ATH/ATL but the highest high/lowest low within the last 5,000 bars. So if you want to get more
granular then I suggest you going with a Lower TF but if you want to see the ACTUAL ATH/ATL then the Daily TF or higher is what you're looking for. Make sure to note
that when a coin's plot is staying even with the 0 or 100 line(0 being the ATL within the TF and vise versa) that means the coin is pushing the ATH/ATL further than it
previously was, Also, as with many of my other scripts, I've included a coin filter that will either allow or disallow the plot to be printed depending on if the
"Printed Bar Count" is selected and if it's % is above the threshold (set by the user). This filter will pretty much be useless on the higher TF so don't expect a change
in the data output if you're using a HTF and have that filter selected for use. Elaboration on the inner-workings of MOST inputs can be found in the tooltips provided
along side it and viewed within the settings menu by hovering your curser over the little circled "i" next to the appropriate setting (or near it if the tooltips are
referencing each other or other inputs around itself). May the force be with your trades (in my best Darth Vader voice). Toodles. -ChasinAlts
G'day Tradeurs, Hope everyone is having a FAN-FRIGGIN-TASTIC DAY!!! Right now (November 2nd, 2022) is a GREAT time to look for coins that are near their ALL-Time Low
due to the incoming bull market rearing its head around the corner (I'd wait for ONE MORE big dump to be safe though). And how GREAT would it be to even have
$50 of a coin with 10X leverage (I wouldn't suggest this to others though) at the near bottom said market? That is the reason for me publishing this.
This is a quick little scanner script thats part of my "Market Overview" series. Nothing monumental or advanced regarding the ATH/ATL calculations.
Perhaps one thing slightly different here than others is both the % from ATH and % from ATL is calculated and the result is the % that the price is between it's ATH/ATL.
So, it will show the All Time High/All Time Low BUT ONLY to the extent that the TF will allow. Ie. For the Free Planned Users, they can only get data as far back as
5,000 bars would provide. Thus, the ATH/ATL will not show the ACTUAL ATH/ATL but the highest high/lowest low within the last 5,000 bars. So if you want to get more
granular then I suggest you going with a Lower TF but if you want to see the ACTUAL ATH/ATL then the Daily TF or higher is what you're looking for. Make sure to note
that when a coin's plot is staying even with the 0 or 100 line(0 being the ATL within the TF and vise versa) that means the coin is pushing the ATH/ATL further than it
previously was, Also, as with many of my other scripts, I've included a coin filter that will either allow or disallow the plot to be printed depending on if the
"Printed Bar Count" is selected and if it's % is above the threshold (set by the user). This filter will pretty much be useless on the higher TF so don't expect a change
in the data output if you're using a HTF and have that filter selected for use. Elaboration on the inner-workings of MOST inputs can be found in the tooltips provided
along side it and viewed within the settings menu by hovering your curser over the little circled "i" next to the appropriate setting (or near it if the tooltips are
referencing each other or other inputs around itself). May the force be with your trades (in my best Darth Vader voice). Toodles. -ChasinAlts
Catatan Rilis
Just changing the charts image to show more smoothed out plots for easier viewing. Much love people...much love.Skrip open-source
Dengan semangat TradingView yang sesungguhnya, penulis skrip ini telah menjadikannya sumber terbuka, sehingga para trader dapat meninjau dan memverifikasi fungsinya. Hormat untuk penulisnya! Meskipun anda dapat menggunakannya secara gratis, ingatlah bahwa penerbitan ulang kode tersebut tunduk pada Tata Tertib kami.
Pernyataan Penyangkalan
Informasi dan publikasi tidak dimaksudkan untuk menjadi, dan bukan merupakan saran keuangan, investasi, perdagangan, atau rekomendasi lainnya yang diberikan atau didukung oleh TradingView. Baca selengkapnya di Persyaratan Penggunaan.
Skrip open-source
Dengan semangat TradingView yang sesungguhnya, penulis skrip ini telah menjadikannya sumber terbuka, sehingga para trader dapat meninjau dan memverifikasi fungsinya. Hormat untuk penulisnya! Meskipun anda dapat menggunakannya secara gratis, ingatlah bahwa penerbitan ulang kode tersebut tunduk pada Tata Tertib kami.
Pernyataan Penyangkalan
Informasi dan publikasi tidak dimaksudkan untuk menjadi, dan bukan merupakan saran keuangan, investasi, perdagangan, atau rekomendasi lainnya yang diberikan atau didukung oleh TradingView. Baca selengkapnya di Persyaratan Penggunaan.