INVITE-ONLY SCRIPT
Diupdate Cyatophilum Screener
This indicator lets you get a quick glimpse at the market by choosing up to 6 pairs in the indicator settings. (But we will see how to show more below)
Each pair can be turned on/off, and has its own configurable timeframe.
The indicator will return the following information in real time:
- Price
The source retrieved by the indicator can be configured as well (close,low,high,open, etc.)
- Pair trend direction and strength
- A 200 EMA is sent to each pair, used to find if the pair is either "Bearish" or "Bullish".
- The indicator uses the Average Directional Index to tell if the pair is either "Trending" or "Going Sideways".
- Volume
- The indicator retrieves volume data for each pair, and tells if it is increasing ("Buy/Sell Volume") or decreasing ("Low Buy/Sell Volume") by looking at previous volume and price data.
- ATH/LTH
- "ALL TIME HIGH" or "ALL TIME LOW" will flash if the pair is making new highs/lows in the period of available data.
- RSI
- "Overbought" or "Oversold" will flash if the pair's RSI is above/below 30/70
Graphics:
- The labels size can be configured in the settings.
- The labels color will change to green when the pair is bullish, and red when it is bearish.
- Pairs price plot can be edited in the style tab (color change, display, etc.)
Tip:
To monitor more than 6 pairs at once, add the indicator on the chart another time and move it to a new pane.

To get access to the indicator, please use the link just below.
Each pair can be turned on/off, and has its own configurable timeframe.
The indicator will return the following information in real time:
- Price
The source retrieved by the indicator can be configured as well (close,low,high,open, etc.)
- Pair trend direction and strength
- A 200 EMA is sent to each pair, used to find if the pair is either "Bearish" or "Bullish".
- The indicator uses the Average Directional Index to tell if the pair is either "Trending" or "Going Sideways".
- Volume
- The indicator retrieves volume data for each pair, and tells if it is increasing ("Buy/Sell Volume") or decreasing ("Low Buy/Sell Volume") by looking at previous volume and price data.
- ATH/LTH
- "ALL TIME HIGH" or "ALL TIME LOW" will flash if the pair is making new highs/lows in the period of available data.
- RSI
- "Overbought" or "Oversold" will flash if the pair's RSI is above/below 30/70
Graphics:
- The labels size can be configured in the settings.
- The labels color will change to green when the pair is bullish, and red when it is bearish.
- Pairs price plot can be edited in the style tab (color change, display, etc.)
Tip:
To monitor more than 6 pairs at once, add the indicator on the chart another time and move it to a new pane.
To get access to the indicator, please use the link just below.
Catatan Rilis
Updated text color for better readability.Catatan Rilis
Updated labels positioning: no more empty space between 2 labels.Added positioning settings for vertical and horizontal align.
Catatan Rilis
Major update:- Up to 40 pairs instead of 6
- Better display
Catatan Rilis
- Updated to pine version 6.
- The screener now allows to scan up to 240 pairs.
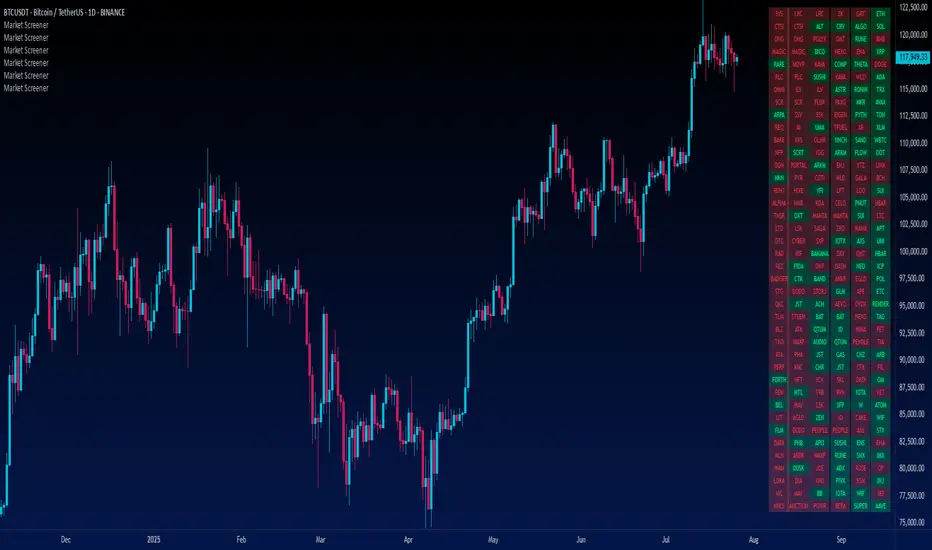
How to use:
The indicator inputs allows to choose a "market", for example BTC, which will be the quote currency of our pairs.
The exchange to retrieve the data from is configurable, and is Binance by default.
Use the condition menu to switch between:
"Rising" - is price rising ?
"Volume" - is the volume spiking ?
"Overbought" - is the RSI overbought ? (> 80)
"Oversold" - is the RSI oversold ? (< 20)
The pairs which condition is verified will turn green, red otherwise.
Additional conditions can be added upon request in future versions.
Pair/ticker groups: The indicator has 6 groups in total, allowing to scan 240 pairs. Each group contains 40 tickers. By default, the groups are filled with Binance's BTC market pairs.
To visualize the 240 pairs on a single chart like below, you need to add 6 copies of the indicator on your chart, then change the group number in the inputs.
🔥Get the Cyatophilum Indicators today and automate them on Binance! => blockchainfiesta.com/strategies/
Discord Server: discord.gg/RVwBkpnQzm
I am taking PineScript Commissions ✔
=> blockchainfiesta.com/contact/
Discord Server: discord.gg/RVwBkpnQzm
I am taking PineScript Commissions ✔
=> blockchainfiesta.com/contact/
Skrip hanya-undangan
Akses ke skrip ini dibatasi hanya bagi pengguna yang telah diberi otorisasi oleh penulisnya dan biasanya membutuhkan pembayaran untuk dapat menggunakannya. Anda dapat menambahkannya ke favorit anda, tetapi anda hanya akan dapat menggunakannya setelah meminta izin dan mendapatkan aksesnya dari pembuat skripnya. Hubungicyatophilum untuk informasi lebih lanjut, atau ikuti instruksi penulisnya dibawah ini.
TradingView tidak menyarankan untuk membayar untuk sebuah skrip dan menggunakannya kecuali anda 100% mempercayai pembuatnya dan memahami cara kerja skrip tersebut. Dalam banyak kasus, anda dapat menemukan alternatif skrip sumber terbuka yang bagus secara gratis di Skrip Komunitas kami.
Instruksi penulis
″This indicator access can be purchased through a subscription on my website: https://blockchainfiesta.com/strategy/Cyatophilum-Screener/38/
Inggin menggunakan skrip ini pada chart?
Peringatan: harap membaca sebelum meminta akses.
🔥Get the Cyatophilum Indicators today and automate them on Binance! => blockchainfiesta.com/strategies/
Discord Server: discord.gg/RVwBkpnQzm
I am taking PineScript Commissions ✔
=> blockchainfiesta.com/contact/
Discord Server: discord.gg/RVwBkpnQzm
I am taking PineScript Commissions ✔
=> blockchainfiesta.com/contact/
Pernyataan Penyangkalan
Informasi dan publikasi tidak dimaksudkan untuk menjadi, dan bukan merupakan saran keuangan, investasi, perdagangan, atau rekomendasi lainnya yang diberikan atau didukung oleh TradingView. Baca selengkapnya di Persyaratan Penggunaan.