OPEN-SOURCE SCRIPT
Diupdate SMC Structures and FVG
The SMC Structures and FVG indicator allows the user to easily identify trend continuations (Break Of Structure) or trend changes (CHange Of CHaracter) on any time frame. In addition, it display all FVG areas, whether they are bullish, bearish, or even mitigated.
Fair Value Gap :
The FVG process shows every bullish, bearish or even mitigated FVG liquidity area. When a FVG is fully mitigated it will directly be removed of the chart.
There is an history of FVG to show. By selecting specific number of FVG to show in the chart, the user can focus its analysis on lasts liquidity area.
Here's the rules for FVG color :
Structures analysis:
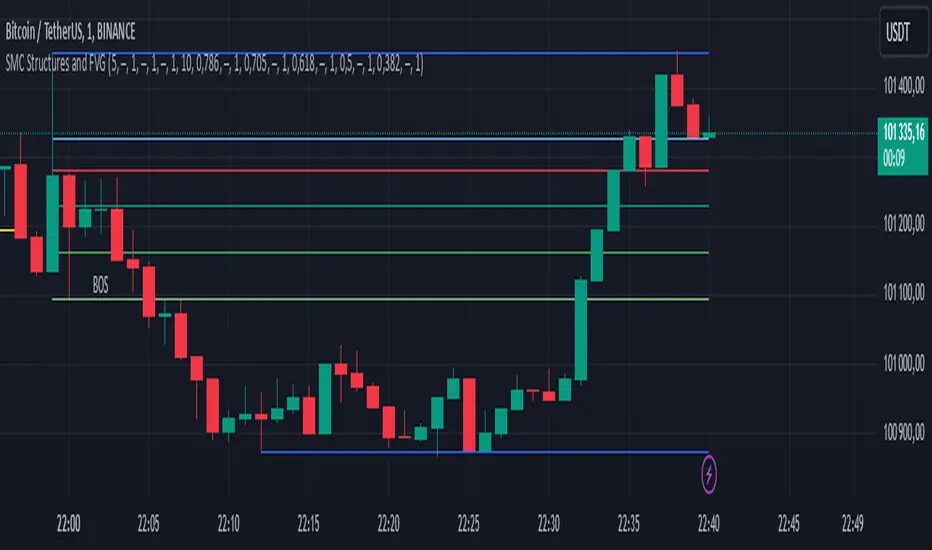
The Structure process show BOS in grey lines and CHoCH in yellow lines. It shows to the user the lasts price action pattern.
The blue lines are the high value and the low value of the current structure.
Fair Value Gap :
The FVG process shows every bullish, bearish or even mitigated FVG liquidity area. When a FVG is fully mitigated it will directly be removed of the chart.
There is an history of FVG to show. By selecting specific number of FVG to show in the chart, the user can focus its analysis on lasts liquidity area.
Here's the rules for FVG color :
- Green when it's a bullish FVG and has not been mitigated
- Red when it's a bearish FVG and has not been mitigated
- Gray when the bullish / bearish FVG has been mitigated
- Removed when the FVG has been fully mitigated
Structures analysis:
The Structure process show BOS in grey lines and CHoCH in yellow lines. It shows to the user the lasts price action pattern.
The blue lines are the high value and the low value of the current structure.
Catatan Rilis
Adding the "Reduce mitigated FVG" parameterUser can check this parameter to reduce mitigated FVG area. This will show exactly where is FVG that has not been mitigated on the chart.
The mitigated FVG color is still grey.
This new parameter is disabled by default but can be enabled at any time
Catatan Rilis
Adding alerts when FVG is mitigatedWith this new feature, user can add an alert directly from the indicator. It will be sent when a FVG area has been mitigated.
Catatan Rilis
Set bullish and bearish BOS/CHoCH colorWith this new feature, user can now change BOS and CHoCH color compared to its direction (bullish or bearish).
With this new version, there can now be up to 4 different colors during a structure change.
Catatan Rilis
Adding Fibonacci retracement levels of the current structureIn this new version, the user can display up to 5 Fibonacci retracement levels that will be applied to the current structure.
The user can also modify the value, color, style, and thickness of the line associated to each retracement.
The default values are as follows: 0.786, 0.705, 0.618, 0.5, and 0.382.
Catatan Rilis
Fix fibonacci line style parameterCatatan Rilis
Addition of Alerts During a BOS / CHOCH.To add this feature, you will need to use the "Create an Alert" tool and select the condition "SMC Structures and FVG."
Two alerts are currently available for BOS / CHOCH (do not select "Any alert() function call").
Skrip open-source
Dengan semangat TradingView yang sesungguhnya, pembuat skrip ini telah menjadikannya sebagai sumber terbuka, sehingga para trader dapat meninjau dan memverifikasi fungsinya. Salut untuk penulisnya! Meskipun Anda dapat menggunakannya secara gratis, perlu diingat bahwa penerbitan ulang kode ini tunduk pada Tata Tertib kami.
Pernyataan Penyangkalan
Informasi dan publikasi ini tidak dimaksudkan, dan bukan merupakan, saran atau rekomendasi keuangan, investasi, trading, atau jenis lainnya yang diberikan atau didukung oleh TradingView. Baca selengkapnya di Ketentuan Penggunaan.