INVITE-ONLY SCRIPT
Cumulative Volume Ratio v1.0
Diupdate

Simple.
NYSE only.
0700am-1200pm only.
5 minute candles only.
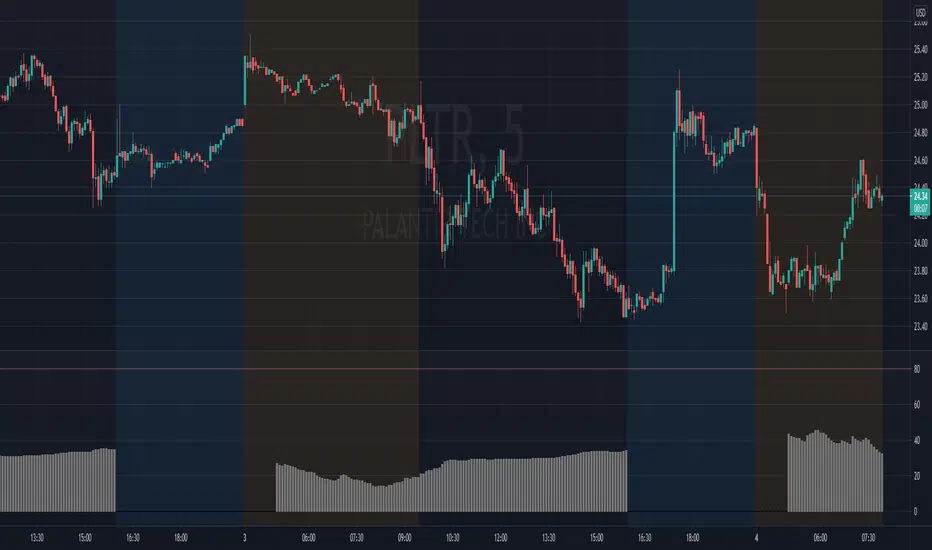
The code compares the cumulative volume of the current day to the 20 day cumulative average up to that same point in time.
This is commonly referenced as the Zanger Ratio.
The colors are based on the that version.
Below 60 = drying up (grey)
Above 60 = below average (orange)
Above 80 = average (pink)
Above 120 = High (magenta)
Above 200 = Extreme (red)
I purposely have these bars slightly transparent so we can quickly identify this indicator apart from my Specific Bar Volume Ratio or other bar based indicator.
This example is in Central time.
Contact me if you are interested.
Catatan Rilis
Start time set to 0700 EST.Catatan Rilis
Code now starts at 0500 EST (NYSE)There are two Inputs:
Shut Off Pre Market? , this helps visualization when the PM action is significantly higher than the opening action.
Disable Prior Days? , this helps visualization when the previous day's action is significantly higher than the current day's action.
Catatan Rilis
Applied two corrections when lacking sufficient historical data:If the 100SMA does not exist than the lookback period is cut to 10 days.
If the study has a max_bars_back study error ( ! ) ; switch the setting labeled such and the lookback will be cut to 5 days.
These changes are important when trading relatively new stocks. The code scans every 5 minute bar from 0400 EST to 1600 EST. When there is not steady liquidity the code fails because there is too much missing data.
Catatan Rilis
Corrected previous resolution to repair study errors. The code will now reference the 20MA cumulative ratio unless there is not enough data (ticker has not been trading for at least 20 days).
If there is less than 20 days and more than 10 days, it will reference the 10MA.
If there is less than 10 days of trading, the plot will be zero.
Skrip hanya-undangan
Akses ke skrip ini dibatasi hanya bagi pengguna yang telah diberi otorisasi oleh penulisnya dan biasanya membutuhkan pembayaran untuk dapat menggunakannya. Anda dapat menambahkannya ke favorit anda, tetapi anda hanya akan dapat menggunakannya setelah meminta izin dan mendapatkan aksesnya dari pembuat skripnya. Hubungikmack282 untuk informasi lebih lanjut, atau ikuti instruksi penulisnya dibawah ini.
TradingView tidak menyarankan untuk membayar untuk sebuah skrip dan menggunakannya kecuali anda 100% mempercayai pembuatnya dan memahami cara kerja skrip tersebut. Dalam banyak kasus, anda dapat menemukan alternatif skrip sumber terbuka yang bagus secara gratis di Skrip Komunitas kami.
Instruksi penulis
″Send me a direct message for free trial!
Inggin menggunakan skrip ini pada chart?
Peringatan: harap membaca sebelum meminta akses.
Pernyataan Penyangkalan
Informasi dan publikasi tidak dimaksudkan untuk menjadi, dan bukan merupakan saran keuangan, investasi, perdagangan, atau rekomendasi lainnya yang diberikan atau didukung oleh TradingView. Baca selengkapnya di Persyaratan Penggunaan.