INVITE-ONLY SCRIPT
SB Master Chart
Diupdate
A free 14 day trial is available upon request.
This is the SB Master Chart. I have combined my Swing Traders Serenity filter to this indicator as a filter for even better trade entries and exits.
SB Master Chart was designed with a minimalist appearance, but is able to provide a trader with all the information he needs at a glance to make informed trading decisions. This chart utilizes the alert() function so the trader can be alerted even while away from a computer to a potential trade opportunity.
The visual display of the chart utilizes the following indicators.
The alert condition utilizes a combination of the above to form its overbought/oversold conditions.
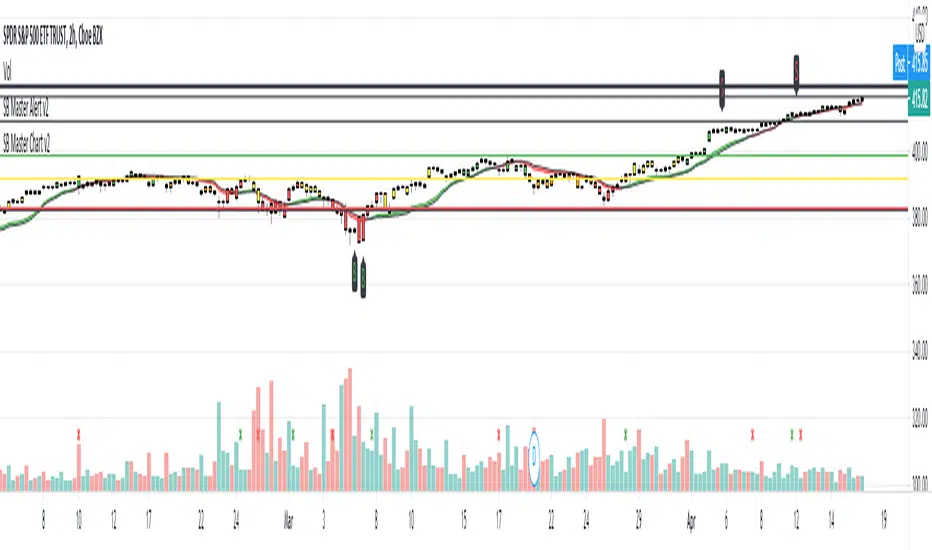
The bar colors are determined by the three moving averages the chart tracks, MA5 , MA20, and MA50.
If the bars are green, a clear uptrend is happening, red represents downtrend.
Yellow bars indicate MA5 is in an uptrend and Orange indicates that MA5 is in a downtrend.
The x's at the bottom of the chart represent macd crossovers and crossunders.
The following dynamic support and resistance lines are as follows.
The settings for the chart include the following.
This is the SB Master Chart. I have combined my Swing Traders Serenity filter to this indicator as a filter for even better trade entries and exits.
SB Master Chart was designed with a minimalist appearance, but is able to provide a trader with all the information he needs at a glance to make informed trading decisions. This chart utilizes the alert() function so the trader can be alerted even while away from a computer to a potential trade opportunity.
The visual display of the chart utilizes the following indicators.
- Bollinger
- MACD
- RSI
- Stochastic
- Session SMA5, SMA20, SMA50
- Daily VWAP20, VWAP50, VWAP100
The alert condition utilizes a combination of the above to form its overbought/oversold conditions.
The bar colors are determined by the three moving averages the chart tracks, MA5 , MA20, and MA50.
If the bars are green, a clear uptrend is happening, red represents downtrend.
Yellow bars indicate MA5 is in an uptrend and Orange indicates that MA5 is in a downtrend.
The x's at the bottom of the chart represent macd crossovers and crossunders.
The following dynamic support and resistance lines are as follows.
- The black horizontal lines are the current bars upper and lower Bollinger Band.
- The green horizonal line is the 20 day VWAP.
- The yellow horizonal line is the 50 day VWAP.
- The red horizonal line is the 100 day VWAP.
The settings for the chart include the following.
- Options for the chart include the ability to disable oversold or overbought alerts.
- The ability to turn off most of the visual settings.
- A multi time frame filter called "Swing Traders Serenity" to filter out trades that do not meet uptrend/downtrend criteria on higher time frames/periods.
- A sympathy play. Sometimes when a stock moves, other stocks move with it. Be alerted when a sympathy play is about to happen by tracking another ticker.
Catatan Rilis
Added additional alertcondition() to make the script compatible with webhook bots.Catatan Rilis
Updated a bug with the background color interfering with the new alertcondition() functions.Skrip hanya-undangan
Akses ke skrip ini dibatasi hanya bagi pengguna yang telah diberi otorisasi oleh penulisnya dan biasanya membutuhkan pembayaran untuk dapat menggunakannya. Anda dapat menambahkannya ke favorit anda, tetapi anda hanya akan dapat menggunakannya setelah meminta izin dan mendapatkan aksesnya dari pembuat skripnya. HubungiStuBuzzzini untuk informasi lebih lanjut, atau ikuti instruksi penulisnya dibawah ini.
TradingView tidak menyarankan untuk membayar untuk sebuah skrip dan menggunakannya kecuali anda 100% mempercayai pembuatnya dan memahami cara kerja skrip tersebut. Dalam banyak kasus, anda dapat menemukan alternatif skrip sumber terbuka yang bagus secara gratis di Skrip Komunitas kami.
Instruksi penulis
″You can find more information at https://www.sbmasterchart.com
14 day trials are available upon request.
Inggin menggunakan skrip ini pada chart?
Peringatan: harap membaca sebelum meminta akses.
Pernyataan Penyangkalan
Informasi dan publikasi tidak dimaksudkan untuk menjadi, dan bukan merupakan saran keuangan, investasi, perdagangan, atau rekomendasi lainnya yang diberikan atau didukung oleh TradingView. Baca selengkapnya di Persyaratan Penggunaan.