INVITE-ONLY SCRIPT
Prime Oscillators Pro + [ChartPrime]
Diupdate
Prime Oscillators Pro Plus
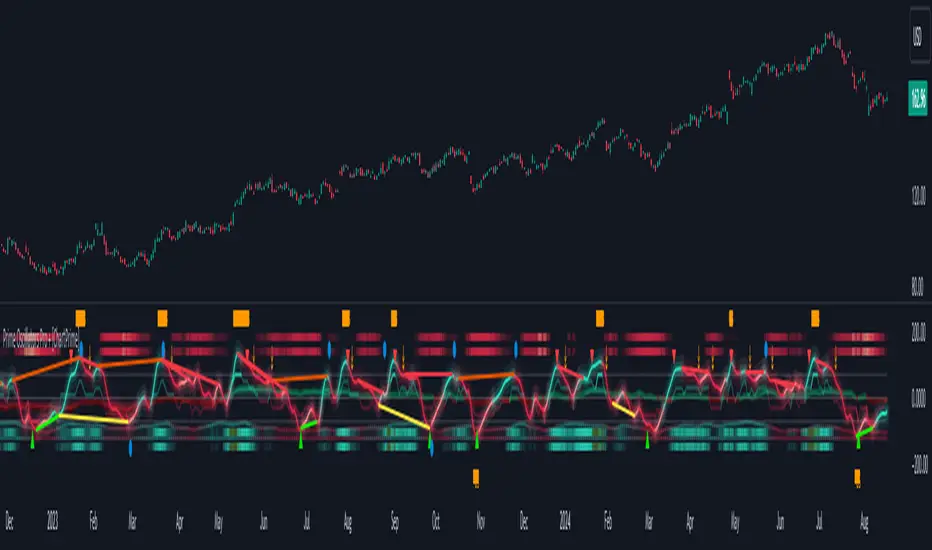
The Prime Oscillator is a powerful technical analysis tool designed to provide traders with a multi-faceted view of market trends and potential price movements. By integrating several key components, each with unique analytical capabilities, the Prime Oscillator offers a robust mechanism for evaluating market conditions, predicting trends, and identifying potential trading opportunities. Here's a detailed breakdown of why each component is unique and brings varying approaches into market analysis:

Money Flow Tracker
The Money Flow Tracker measures the flow of money into and out of a security over a specific period of time. It combines both price and volume data to provide insights into the buying and selling pressure of an asset. Employing low lag filtering methods; this confluence of readings allows for in theory; a more reliable oscillator.

This feature allows for:
Early Trend Detection: By highlighting periods of positive (green) and negative (red) volume, traders can anticipate shifts in market sentiment before they become apparent in price action.
Volume Matrix
The lower volume oscillator shows whether money is flowing into or out of the market. Green suggests uptrend and buyers are in control whereas red represents a majority of sellers. By incorporating smoothed volume analysis, it distinguishes between bullish and bearish volumes, providing an early indication of potential trend reversals.

Top and Bottom Power Bars
These lines represent confirmation of trends based on the convergence of seven different conditions, with brightness indicating the strength of the trend. Brighter lines suggest strong trends, while dimmer lines indicate weaker trends.
Trend Strength Identification; By visually representing the strength of a trend, traders can gauge the confidence of the market in a particular direction.
Overbought/Oversold Conditions: Bright lines in overbought or oversold zones signal potential reversal points, helping traders avoid entering positions at extreme highs or lows.

Volume-Inspired Signals
The volume inspired signals inspired signals are used to determine overbought and oversold conditions, adding another layer of analysis to the oscillator.

Price Fairness Assessment: The signals help traders assess whether the current price is above or below the average price, adjusted for volume, indicating potential reversal zones.
Improved Timing: By using these signals, traders can improve the timing of their entries and exits, ensuring they are aligned with the broader market consensus.
The True 7
The middle ranking system evaluates the strength of a move and the overall trend, offering a numeric or visual representation of trend strength. It can also indicate when a trend is starting to reverse, providing leading signals for potential market shifts. This allows for traders to understand how strong the trend is and their trade and also forecast potential reversals in market activity. For example if a trader were in a long position and the ranking system starts to show a weakening trend the trader may want to exit their position. This is a unique piece of confluence lacking in other tools where market performance is boiled down to a rank rather than value.

Reversal signals: These are in essence a contrarian signal predicting the reversal of the market and the oscillator.
The Peak Seekers are blue dots that analyze multiple indicators to deduce more accurately and confluence within divergences. Settings here are auto optimized depending on the user selected timeframe.
Main Oscillator
The main oscillator is designed to be a low lag identifier of market moves. Using low lag smoothing approaches, a green and red color further indicates a trend. This is fantastic when used in confluence with other features in this toolkit.
This system quantifies the strength of a trend, helping traders understand the market's momentum and the potential sustainability of a move.
MVP Oscillator
The second mode in this toolkit; the MVP Oscillator analyses volume at a deeper level.
The Main Ribbon
This oscillator analyses market trends and produces a blue and purple ribbon. A blue ribbon suggests the market is moving upwards and a purple ribbon suggests the market is moving downwards. This plot can be used classically and a user can easily use this for divergence identification. In this mode however divergences are not the main feature and would need to be manually identified.

Ranging between -100 and 100; this oscillator, when below 0, suggests the market is bearish and moving downwards. When above 0 the market is in a bullish state. Looking for confluence here is key. For example if the oscillator is below 0 and we see purple appearing on the ribbon; this could be a stronger sign the market will continue to move downwards. However; if it's below 0 and the oscillator turns blue; this could indicate indecision in the market.
The Green Bars
The main other component on the MVP oscillator are the overextended green bars that appear when a market reversal is due.

Green bars suggesting the market will soon reverse
When the green bars appear the user can infer that the market may bounce around this region making it once again excellent when used in confluence with other tools from ChartPrime. Looking for these bars can indicate when a trader might want to be looking for some dynamic positions. Consider these a warning sign.
Signals
The MVP oscillator also has signals. These appear when the oscillator becomes overextended and displays arrows. These can serve as classical buy or sell signals when used in confluence with other indicators.
Looking for confluence with these signals can be a powerful idea. For example; in the image above we see a buy signal with green bars. This suggests the market is due a reversal and that reversal will most likely be a bullish one.
Summary
The Prime Oscillator combines these components to create a powerful and comprehensive tool for technical analysis. Each element plays a crucial role in offering a nuanced view of the market, from early trend detection and volume confirmation to trend strength measurement and overbought/oversold signals. By using the Prime Oscillator, traders can gain a deeper understanding of market dynamics, make more informed trading decisions, and enhance their overall trading strategy.
The Prime Oscillator is a powerful technical analysis tool designed to provide traders with a multi-faceted view of market trends and potential price movements. By integrating several key components, each with unique analytical capabilities, the Prime Oscillator offers a robust mechanism for evaluating market conditions, predicting trends, and identifying potential trading opportunities. Here's a detailed breakdown of why each component is unique and brings varying approaches into market analysis:
Money Flow Tracker
The Money Flow Tracker measures the flow of money into and out of a security over a specific period of time. It combines both price and volume data to provide insights into the buying and selling pressure of an asset. Employing low lag filtering methods; this confluence of readings allows for in theory; a more reliable oscillator.
This feature allows for:
Early Trend Detection: By highlighting periods of positive (green) and negative (red) volume, traders can anticipate shifts in market sentiment before they become apparent in price action.
Volume Matrix
The lower volume oscillator shows whether money is flowing into or out of the market. Green suggests uptrend and buyers are in control whereas red represents a majority of sellers. By incorporating smoothed volume analysis, it distinguishes between bullish and bearish volumes, providing an early indication of potential trend reversals.
Top and Bottom Power Bars
These lines represent confirmation of trends based on the convergence of seven different conditions, with brightness indicating the strength of the trend. Brighter lines suggest strong trends, while dimmer lines indicate weaker trends.
Trend Strength Identification; By visually representing the strength of a trend, traders can gauge the confidence of the market in a particular direction.
Overbought/Oversold Conditions: Bright lines in overbought or oversold zones signal potential reversal points, helping traders avoid entering positions at extreme highs or lows.
Volume-Inspired Signals
The volume inspired signals inspired signals are used to determine overbought and oversold conditions, adding another layer of analysis to the oscillator.
Price Fairness Assessment: The signals help traders assess whether the current price is above or below the average price, adjusted for volume, indicating potential reversal zones.
Improved Timing: By using these signals, traders can improve the timing of their entries and exits, ensuring they are aligned with the broader market consensus.
The True 7
The middle ranking system evaluates the strength of a move and the overall trend, offering a numeric or visual representation of trend strength. It can also indicate when a trend is starting to reverse, providing leading signals for potential market shifts. This allows for traders to understand how strong the trend is and their trade and also forecast potential reversals in market activity. For example if a trader were in a long position and the ranking system starts to show a weakening trend the trader may want to exit their position. This is a unique piece of confluence lacking in other tools where market performance is boiled down to a rank rather than value.
Reversal signals: These are in essence a contrarian signal predicting the reversal of the market and the oscillator.
The Peak Seekers are blue dots that analyze multiple indicators to deduce more accurately and confluence within divergences. Settings here are auto optimized depending on the user selected timeframe.
Main Oscillator
The main oscillator is designed to be a low lag identifier of market moves. Using low lag smoothing approaches, a green and red color further indicates a trend. This is fantastic when used in confluence with other features in this toolkit.
This system quantifies the strength of a trend, helping traders understand the market's momentum and the potential sustainability of a move.
MVP Oscillator
The second mode in this toolkit; the MVP Oscillator analyses volume at a deeper level.
The Main Ribbon
This oscillator analyses market trends and produces a blue and purple ribbon. A blue ribbon suggests the market is moving upwards and a purple ribbon suggests the market is moving downwards. This plot can be used classically and a user can easily use this for divergence identification. In this mode however divergences are not the main feature and would need to be manually identified.
Ranging between -100 and 100; this oscillator, when below 0, suggests the market is bearish and moving downwards. When above 0 the market is in a bullish state. Looking for confluence here is key. For example if the oscillator is below 0 and we see purple appearing on the ribbon; this could be a stronger sign the market will continue to move downwards. However; if it's below 0 and the oscillator turns blue; this could indicate indecision in the market.
The Green Bars
The main other component on the MVP oscillator are the overextended green bars that appear when a market reversal is due.
Green bars suggesting the market will soon reverse
When the green bars appear the user can infer that the market may bounce around this region making it once again excellent when used in confluence with other tools from ChartPrime. Looking for these bars can indicate when a trader might want to be looking for some dynamic positions. Consider these a warning sign.
Signals
The MVP oscillator also has signals. These appear when the oscillator becomes overextended and displays arrows. These can serve as classical buy or sell signals when used in confluence with other indicators.
Looking for confluence with these signals can be a powerful idea. For example; in the image above we see a buy signal with green bars. This suggests the market is due a reversal and that reversal will most likely be a bullish one.
Summary
The Prime Oscillator combines these components to create a powerful and comprehensive tool for technical analysis. Each element plays a crucial role in offering a nuanced view of the market, from early trend detection and volume confirmation to trend strength measurement and overbought/oversold signals. By using the Prime Oscillator, traders can gain a deeper understanding of market dynamics, make more informed trading decisions, and enhance their overall trading strategy.
Catatan Rilis
Money Mode Feature added .Catatan Rilis
Multi time frame money flow tracker added.Skrip hanya-undangan
Akses ke skrip ini dibatasi hanya bagi pengguna yang telah diberi otorisasi oleh penulisnya dan biasanya membutuhkan pembayaran untuk dapat menggunakannya. Anda dapat menambahkannya ke favorit anda, tetapi anda hanya akan dapat menggunakannya setelah meminta izin dan mendapatkan aksesnya dari pembuat skripnya. HubungiChartPrime untuk informasi lebih lanjut, atau ikuti instruksi penulisnya dibawah ini.
TradingView tidak menyarankan untuk membayar untuk sebuah skrip dan menggunakannya kecuali anda 100% mempercayai pembuatnya dan memahami cara kerja skrip tersebut. Dalam banyak kasus, anda dapat menemukan alternatif skrip sumber terbuka yang bagus secara gratis di Skrip Komunitas kami.
Instruksi penulis
″Find ChartPrime indicators: https://chartprime.com/tv
Join our community: https://discord.gg/chartprime
All scripts & content provided by ChartPrime are for informational & educational purposes only. Past performance does not guarantee future results.
Inggin menggunakan skrip ini pada chart?
Peringatan: harap membaca sebelum meminta akses.
Pernyataan Penyangkalan
Informasi dan publikasi tidak dimaksudkan untuk menjadi, dan bukan merupakan saran keuangan, investasi, perdagangan, atau rekomendasi lainnya yang diberikan atau didukung oleh TradingView. Baca selengkapnya di Persyaratan Penggunaan.