INVITE-ONLY SCRIPT
tabbys star [Algo Seeker]
Tabbys Star Mission:
Identifying key supply and demand areas for entries, identifying trends for holding positions, and locating potential re-entry or exit points is incredibly useful for traders and investors. This algorithm is designed to simplify these critical processes by providing actionable and intuitive tools directly on the chart.
🟢Supply & Demand Zones (S&D)
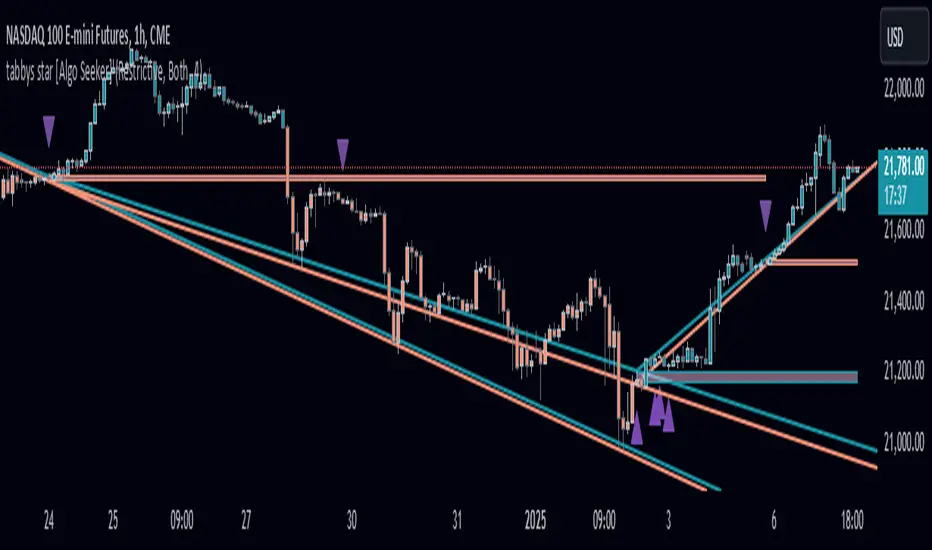
The algorithm identifies key entry points by creating supply and demand blocks that automatically expand across the chart. These blocks remain active until invalidated, helping traders maintain awareness of significant price levels. When a new pivot point is identified, the algorithm generates a new supply or demand block that starts expanding from that pivot. This functionality enables traders to monitor evolving zones while referencing older ones, which might still act as weaker pivot points. These areas are incredibly unique and useful for traders, as they dynamically adapt to price action and provide clear visual cues for decision-making.
🟢Continuation and Exit Signals
The algorithm also highlights areas for potential re-entries or exits. When the price moves beyond a supply or demand block, arrows are displayed to signal that this area may now be optimal for re-entering a trade or exiting a position.
Separating this logic from supply and demand zones offers significant flexibility for traders. For example, those who wish to hold positions initiated at an order block can confidently wait for these signals before taking profits. Similarly, traders who missed the initial opportunity at an order block can use these signals to evaluate new trade opportunities. This feature is incredibly useful for adapting to evolving market conditions.
🟩Important Note
Arrow/triangle signals are not definitive indicators of upward or downward movement; they serve as calls to attention. These signals should be analyzed in conjunction with supply and demand zones.
For example, if a signal suggests bullish movement but the price falls below the current supply or demand zone, the signal was merely a call to attention. In such cases, it may indicate the need to set a stop loss or even consider a bearish trade below the zone.
Signals should be viewed as one of several factors to consider and should never be traded on in isolation.
🟢Trendlines for Additional Confluence
In addition to supply and demand zones, the algorithm generates trendlines to help traders better visualize market trends. These trend lines are drawn from pivot points within the supply and demand blocks, providing an additional layer of confluence. For traders who rely on trendline breaks to make decisions, this feature enhances the overall analysis and adds value to the trading strategy.
🟢Candle Color Coding
To further enhance clarity, the algorithm color-codes candles based on their position relative to the most recent order block:
Bullish: When the price is above the most recent order block.
Neutral: When the price is within the order block.
Bearish: When the price is below the order block.
This color-coding offers a unique and useful visual representation of the current market sentiment, allowing traders to assess price action at a glance.

Settings Overview
🟢Calculation Strength
This setting allows the user to choose how strict the algorithm should be when calculating data. The Standard option generates more entry and exit signals because the calculations are more lenient.. The Restrictive option uses stricter calculations, resulting in fewer signals for entries and exits.
🟢Use Current Bar:
If checked, the conditions will act on the current bar (real-time updates). If unchecked, the conditions will act after the bar closes. For a non-repainting indicator, leave this unchecked.
🟢Session Type:
Both:
Includes market and after-market hours.
RTH:
Regular trading hours only.
🟢Max Trend Lines:
"1": No trend lines will be shown.
"2" or higher: Displays trend lines based on pivot points.
🟢Bar Color:
Allows selection of candle colors based on the parameters discussed above.
🟢Signal Colors:
As described earlier.
🟢Alerts
For when a signal is created.
Conclusion
This tool is designed to hopefully assist investors and traders by:
Identifying key supply and demand areas for entries.
Highlighting trends for holding positions.
Pinpointing potential re-entry or exit points.
Identifying key supply and demand areas for entries, identifying trends for holding positions, and locating potential re-entry or exit points is incredibly useful for traders and investors. This algorithm is designed to simplify these critical processes by providing actionable and intuitive tools directly on the chart.
🟢Supply & Demand Zones (S&D)
The algorithm identifies key entry points by creating supply and demand blocks that automatically expand across the chart. These blocks remain active until invalidated, helping traders maintain awareness of significant price levels. When a new pivot point is identified, the algorithm generates a new supply or demand block that starts expanding from that pivot. This functionality enables traders to monitor evolving zones while referencing older ones, which might still act as weaker pivot points. These areas are incredibly unique and useful for traders, as they dynamically adapt to price action and provide clear visual cues for decision-making.
🟢Continuation and Exit Signals
The algorithm also highlights areas for potential re-entries or exits. When the price moves beyond a supply or demand block, arrows are displayed to signal that this area may now be optimal for re-entering a trade or exiting a position.
Separating this logic from supply and demand zones offers significant flexibility for traders. For example, those who wish to hold positions initiated at an order block can confidently wait for these signals before taking profits. Similarly, traders who missed the initial opportunity at an order block can use these signals to evaluate new trade opportunities. This feature is incredibly useful for adapting to evolving market conditions.
🟩Important Note
Arrow/triangle signals are not definitive indicators of upward or downward movement; they serve as calls to attention. These signals should be analyzed in conjunction with supply and demand zones.
For example, if a signal suggests bullish movement but the price falls below the current supply or demand zone, the signal was merely a call to attention. In such cases, it may indicate the need to set a stop loss or even consider a bearish trade below the zone.
Signals should be viewed as one of several factors to consider and should never be traded on in isolation.
🟢Trendlines for Additional Confluence
In addition to supply and demand zones, the algorithm generates trendlines to help traders better visualize market trends. These trend lines are drawn from pivot points within the supply and demand blocks, providing an additional layer of confluence. For traders who rely on trendline breaks to make decisions, this feature enhances the overall analysis and adds value to the trading strategy.
🟢Candle Color Coding
To further enhance clarity, the algorithm color-codes candles based on their position relative to the most recent order block:
Bullish: When the price is above the most recent order block.
Neutral: When the price is within the order block.
Bearish: When the price is below the order block.
This color-coding offers a unique and useful visual representation of the current market sentiment, allowing traders to assess price action at a glance.
Settings Overview
🟢Calculation Strength
This setting allows the user to choose how strict the algorithm should be when calculating data. The Standard option generates more entry and exit signals because the calculations are more lenient.. The Restrictive option uses stricter calculations, resulting in fewer signals for entries and exits.
🟢Use Current Bar:
If checked, the conditions will act on the current bar (real-time updates). If unchecked, the conditions will act after the bar closes. For a non-repainting indicator, leave this unchecked.
🟢Session Type:
Both:
Includes market and after-market hours.
RTH:
Regular trading hours only.
🟢Max Trend Lines:
"1": No trend lines will be shown.
"2" or higher: Displays trend lines based on pivot points.
🟢Bar Color:
Allows selection of candle colors based on the parameters discussed above.
🟢Signal Colors:
As described earlier.
🟢Alerts
For when a signal is created.
Conclusion
This tool is designed to hopefully assist investors and traders by:
Identifying key supply and demand areas for entries.
Highlighting trends for holding positions.
Pinpointing potential re-entry or exit points.
Get Access to our other Algos: algoseeker.com
Join our community:
The content provided by Algo Seeker is for informational & educational purposes only. Past performance does not guarantee future results. Please be careful when you trade!
Join our community:
The content provided by Algo Seeker is for informational & educational purposes only. Past performance does not guarantee future results. Please be careful when you trade!
Skrip hanya-undangan
Akses ke skrip ini dibatasi hanya bagi pengguna yang telah diberi otorisasi oleh penulisnya dan biasanya membutuhkan pembayaran untuk dapat menggunakannya. Anda dapat menambahkannya ke favorit anda, tetapi anda hanya akan dapat menggunakannya setelah meminta izin dan mendapatkan aksesnya dari pembuat skripnya. HubungiAlgoSeeker untuk informasi lebih lanjut, atau ikuti instruksi penulisnya dibawah ini.
TradingView tidak menyarankan untuk membayar untuk sebuah skrip dan menggunakannya kecuali anda 100% mempercayai pembuatnya dan memahami cara kerja skrip tersebut. Dalam banyak kasus, anda dapat menemukan alternatif skrip sumber terbuka yang bagus secara gratis di Skrip Komunitas kami.
Instruksi penulis
″For access requests, please send a DM or visit: https://algoseeker.com/
Inggin menggunakan skrip ini pada chart?
Peringatan: harap membaca sebelum meminta akses.
Get Access to our other Algos: algoseeker.com
Join our community:
The content provided by Algo Seeker is for informational & educational purposes only. Past performance does not guarantee future results. Please be careful when you trade!
Join our community:
The content provided by Algo Seeker is for informational & educational purposes only. Past performance does not guarantee future results. Please be careful when you trade!
Pernyataan Penyangkalan
Informasi dan publikasi tidak dimaksudkan untuk menjadi, dan bukan merupakan saran keuangan, investasi, perdagangan, atau rekomendasi lainnya yang diberikan atau didukung oleh TradingView. Baca selengkapnya di Persyaratan Penggunaan.