INVITE-ONLY SCRIPT
Bollinger Bands
Diupdate
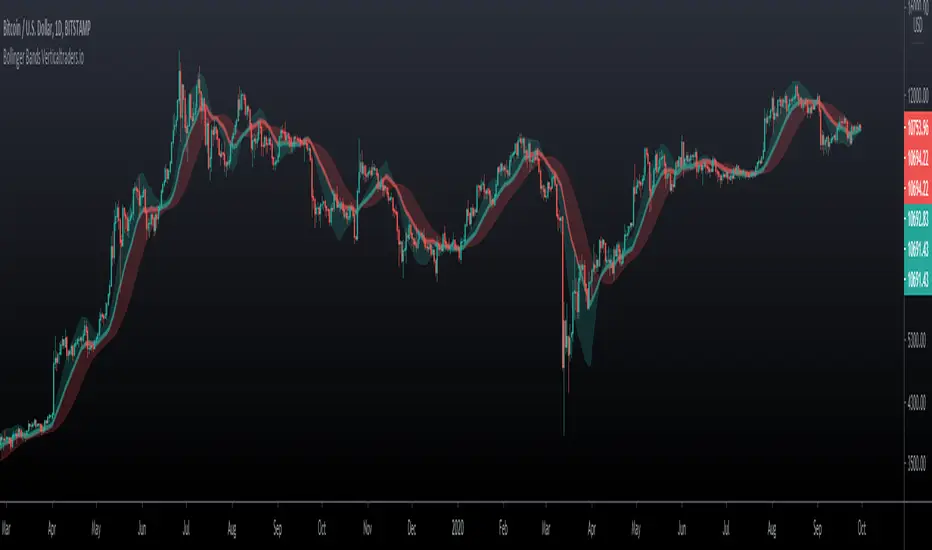
Bollinger bands are calculated from a moving average, creating two curves that involve the price chart, these bands are defined by a standard deviation generally of value 2 with respect to the moving average.
Applications:
- They show the volatility of the market, when the bands are compressed, the volatility decreases, when the bands extend, the volatility increases.
- Trend, with respect to the moving average according to the location of the price corresponding to the positive or negative standard deviation.
Extra functions in this indicator:
- You can use several types of moving averages for the calculation: SMA, EMA, DEMA, TEMA, WMA, VWMA, HullMA, TMA, SMMA, SSMA, etc.
- Background: Shows the zone equivalent to a standard deviation of 1 and 2 with different color.
- Log chart: It can be used on logarithmic price scales, to avoid distortions in those charts.
- Multimeframe: so you can visualize the behavior in different timeframes without changing timeframe.
- Interpolation: Round the curves when viewing larger timeframes.
Multitimeframe example: 1D, select timeframe to Bollinger bands 1W and log chart

Same chart with interpolation

Applications:
- They show the volatility of the market, when the bands are compressed, the volatility decreases, when the bands extend, the volatility increases.
- Trend, with respect to the moving average according to the location of the price corresponding to the positive or negative standard deviation.
Extra functions in this indicator:
- You can use several types of moving averages for the calculation: SMA, EMA, DEMA, TEMA, WMA, VWMA, HullMA, TMA, SMMA, SSMA, etc.
- Background: Shows the zone equivalent to a standard deviation of 1 and 2 with different color.
- Log chart: It can be used on logarithmic price scales, to avoid distortions in those charts.
- Multimeframe: so you can visualize the behavior in different timeframes without changing timeframe.
- Interpolation: Round the curves when viewing larger timeframes.
Multitimeframe example: 1D, select timeframe to Bollinger bands 1W and log chart
Same chart with interpolation
Catatan Rilis
V 2.0Skrip hanya-undangan
Akses ke skrip ini dibatasi hanya bagi pengguna yang telah diberi otorisasi oleh penulisnya dan biasanya membutuhkan pembayaran untuk dapat menggunakannya. Anda dapat menambahkannya ke favorit anda, tetapi anda hanya akan dapat menggunakannya setelah meminta izin dan mendapatkan aksesnya dari pembuat skripnya. HubungiVertical-X untuk informasi lebih lanjut, atau ikuti instruksi penulisnya dibawah ini.
TradingView tidak menyarankan untuk membayar untuk sebuah skrip dan menggunakannya kecuali anda 100% mempercayai pembuatnya dan memahami cara kerja skrip tersebut. Dalam banyak kasus, anda dapat menemukan alternatif skrip sumber terbuka yang bagus secara gratis di Skrip Komunitas kami.
Instruksi penulis
″
Inggin menggunakan skrip ini pada chart?
Peringatan: harap membaca sebelum meminta akses.
🔰 The Best Trading Indicators: links.verticaltraders.io
Pernyataan Penyangkalan
Informasi dan publikasi tidak dimaksudkan untuk menjadi, dan bukan merupakan saran keuangan, investasi, perdagangan, atau rekomendasi lainnya yang diberikan atau didukung oleh TradingView. Baca selengkapnya di Persyaratan Penggunaan.