INVITE-ONLY SCRIPT
Seasonal Statistics Dashboard
Diupdate
For a given month, this indicator will display historical, seasonal statistics for each individual day of that month.
The indicator release comes with 5 columns and more planned:
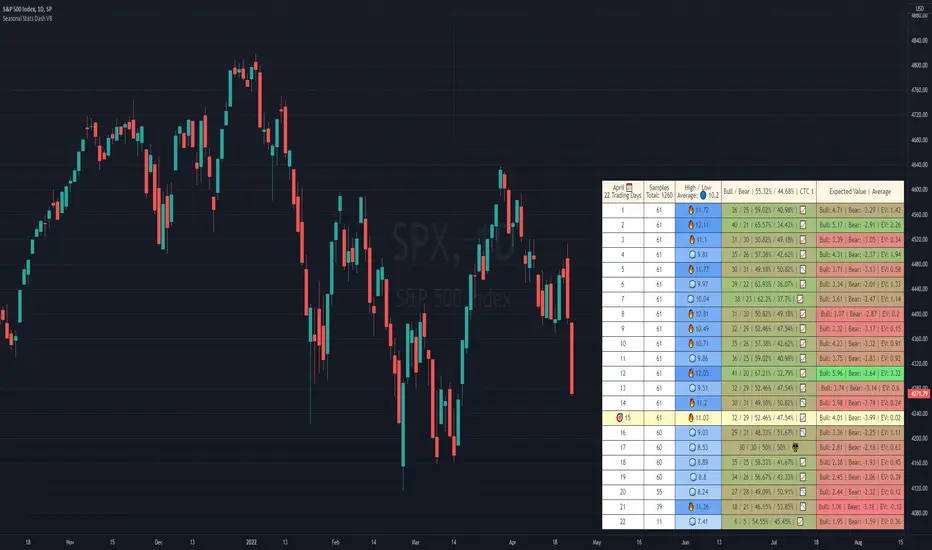
1 — Trading Day
2 — Samples
3 — Daily Average Absolute OC Range
4 — Daily Average Absoulte HL Range
5 — Bull / Bear
The Trading Day column will display a 🎯 emoji and highlight the background for the current trading day. This will only display if you're viewing the current month's stats.
Samples is the simplest column of data: it tells you how many times that trading day has been sampled. Some days are sampled rarely, or infrequently. Days in the future will always be 1 sample short of days that have passed.
Both 3 and 4 fall into the same category: Daily Average Absolute Range calculates the difference between the open and the close, or high and low, of a specified trading day through history; each difference is then made absolute (non-negative), and then the average is taken of all those differences together. This gives the average historical range a particular trading day has.
Using an example: A larger average with open to close data can be interpreted as that day having stronger directional characteristics. In contrast, a larger historical average using high to low for a given day can be interpreted as that day experiencing more volatility than other days historically on a seasonal basis.
Bull / Bear counts the number of times a day closed green (bullish) or red (bearish). Then that's used to display some simple odds in 2 ways: as a fraction, or as odds out of 100%. You can hide either of them and only display one too if you have a preference to only see odds as a fraction or out of 100%.
I plan to add more features for increasing legibility on the table and additional columns with new information as time goes on.
The indicator release comes with 5 columns and more planned:
1 — Trading Day
2 — Samples
3 — Daily Average Absolute OC Range
4 — Daily Average Absoulte HL Range
5 — Bull / Bear
The Trading Day column will display a 🎯 emoji and highlight the background for the current trading day. This will only display if you're viewing the current month's stats.
Samples is the simplest column of data: it tells you how many times that trading day has been sampled. Some days are sampled rarely, or infrequently. Days in the future will always be 1 sample short of days that have passed.
Both 3 and 4 fall into the same category: Daily Average Absolute Range calculates the difference between the open and the close, or high and low, of a specified trading day through history; each difference is then made absolute (non-negative), and then the average is taken of all those differences together. This gives the average historical range a particular trading day has.
Using an example: A larger average with open to close data can be interpreted as that day having stronger directional characteristics. In contrast, a larger historical average using high to low for a given day can be interpreted as that day experiencing more volatility than other days historically on a seasonal basis.
Bull / Bear counts the number of times a day closed green (bullish) or red (bearish). Then that's used to display some simple odds in 2 ways: as a fraction, or as odds out of 100%. You can hide either of them and only display one too if you have a preference to only see odds as a fraction or out of 100%.
I plan to add more features for increasing legibility on the table and additional columns with new information as time goes on.
Catatan Rilis
- Rotate the Dashboard's axis. List data by column vertically, or by row horizontally.
- Select an upper and lower limit of rows to display. Limiting viewable rows on the table by this range. E.g. list entries for Trading Days 5 to 10.
- Daily Absolute Average Range columns merged into one new column called Daily Seasonal Mean Range. (DSMR)
- Select between displaying the Average or Median calculation for the daily seasonal ranges.
- Togglable and customizable emojis for when a daily range is above, below, or at the mean range for the month.
- Current Day's Row Highlight Color now effects all columns and uses a new color.
- New Custom Data Source Column, where you can input another series and obtain seasonal data for it.
- New Min / Max Column, which displays the historical minimum and maximum values for a given day; alongside a display of the year or particular sample index of the value.
- New Sample Slice Column, which will display the slice of data points of a month for a selected sample index.
- New Dashboard Header color input.
Catatan Rilis
- 🆕 Year Filter Type input where you can exclusively take samples only from a list of specified years, sample only the years inclusive in that list, or have no filter on. The default is no filter.
- 🆕 Year Filter List input will take all the specified years (E.g. 1999, 2000, 2001, etc), separated by commas and apply the Year Filter Type setting to it.
- 🐜 Resolve bug: NaN values from the custom source input no longer break the indicator. Add Custom Source NaN Fill Value input to allow customization of a new value to replace NaNs with. Set to zero by default.
- The default value for the Select Daily Range input is now "High - Low" from "Open - Close".
Catatan Rilis
- 🆕 More descript header layouts for all columns.
- 🆕 Add custom error message when the chart is anything but the 1D timeframe. This indicator requires daily data to work.
- 🆕 The Bull / Bear column has additional options to customize the cell and header layout's separator value. Optional tick box to use line breaks as well.
- Show Min & Max tick box is now off by default.
Catatan Rilis
- 🆕 Add Before / After Year input and two new filter types: Before Year and After Year. Now in addition to filtering years through a list, you can filter out a chart's data starting from before or after a specific year.
- 🆕 You can now use either Open to Close or Close to Close calculations for the Bull / Bear column. The calculation used is indicated in the column's header.
- 🆕 Add Holding Days setting for the Bull / Bear column. The number of holding days used is indicated in the columns header. Use: Starting from the 10th trading day of the month, using a setting of 6 would find how often the close from the 10th trading day is above the close from 6 days prior. So, 10 - 6 gives 4. This means the odds in the 10th row of the Bull / Bear column is based on an trade entry from the 4th trading day; six days before.
- Update Month input tooltip.
Catatan Rilis
Update to indicator's preview chart!Catatan Rilis
- 🆕 Add Expected Value column. Get the historical expected value of a given trading day. Including the mean bullish and bearish move for a given day. Cells are highlighted from highest EV day to lowest.
*🔧 Update tooltips, input titles, and emoji controls for the Sample Slice column.
Catatan Rilis
- 🆕 Min & Max column supports input from the Custom Data Source column.
- 🔧 Technical improvements to a couple of Bull & Bear and Expected Value column calculations.
Catatan Rilis
- 🔧 Rename two inputs for clarity: Min & Max Data Source and Sample Slice Data Source
Skrip hanya-undangan
Akses ke skrip ini dibatasi hanya bagi pengguna yang telah diberi otorisasi oleh penulisnya dan biasanya membutuhkan pembayaran untuk dapat menggunakannya. Anda dapat menambahkannya ke favorit anda, tetapi anda hanya akan dapat menggunakannya setelah meminta izin dan mendapatkan aksesnya dari pembuat skripnya. Hubungijoebaus untuk informasi lebih lanjut, atau ikuti instruksi penulisnya dibawah ini.
TradingView tidak menyarankan untuk membayar untuk sebuah skrip dan menggunakannya kecuali anda 100% mempercayai pembuatnya dan memahami cara kerja skrip tersebut. Dalam banyak kasus, anda dapat menemukan alternatif skrip sumber terbuka yang bagus secara gratis di Skrip Komunitas kami.
Instruksi penulis
″Get a 2 week trial by asking for access in #seasonal-statistics in this Discord: https://discord.gg/BzKQfaYfBq Indicator access is on a monthly subscription basis after that. https://www.bausbenchmarks.com/ Notify me after your purchase!
Inggin menggunakan skrip ini pada chart?
Peringatan: harap membaca sebelum meminta akses.
Joe Baus, bausbenchmarks.com
Pernyataan Penyangkalan
Informasi dan publikasi tidak dimaksudkan untuk menjadi, dan bukan merupakan saran keuangan, investasi, perdagangan, atau rekomendasi lainnya yang diberikan atau didukung oleh TradingView. Baca selengkapnya di Persyaratan Penggunaan.