Wheat is one of the world’s most widely traded agricultural commodities, essential for food and animal feed. Prices are heavily influenced by global supply and demand, with major producers including the U.S., Russia, the EU, Canada, Australia, and Ukraine. Weather conditions, geopolitical events, and large importer activity can all create significant volatility in the market. Let’s break it down.
1. What Drives Wheat Prices
Supply Factors
Wheat supply is heavily shaped by the major exporting regions—Russia, the EU, Australia, the U.S., Canada, and Ukraine. Weather is the biggest swing factor: drought, heat stress, floods, or winterkill can quickly tighten global supply and spark rallies. Crop progress reports and yield updates show how each production cycle is developing, while geopolitics—especially in the Black Sea—can disrupt export flows overnight. Input costs like fertilizer and fuel influence how much farmers plant, and currency moves affect which exporters are most competitive. Together, these factors determine how much wheat the world can actually deliver to the market. To summarize:
Demand Factors
Demand for wheat is driven by global food consumption, animal feed needs, and the buying behavior of major importers such as China, Egypt, and Indonesia. Economic conditions matter because stronger economies consume more food and feed. Price relationships with other grains like corn and rice can shift demand toward or away from wheat. Changes in trade flows—such as China sourcing more from the U.S. instead of the Black Sea—can quickly redirect global shipments. These factors help traders understand whether demand is strengthening or weakening relative to available supply. To summarize:
2. Key Reports Traders Actually Need to Track
Instead of monitoring everything, wheat traders focus on the handful of reports that truly move price:
WASDE (Monthly) – The most important report in wheat trading. This is where global production, consumption, exports, and ending stocks get revised.
Wheat can rip or dump instantly on WASDE changes. If you track only one thing, track WASDE.
Weekly USDA Export Sales – This shows an immediate view of demand. Watch for:
It’s one of the fastest ways to spot demand changes ahead of price.
Crop Progress (Weekly, in season) – Important only during planting, growing and harvesting periods. The report tracks:
% planted
% harvested
Crop condition (% good/excellent)
Poor Conditions generally = bullish. Strong Conditions generally = bearish
Geopolitical headlines – In our opinion wheat is the most geopolitically sensitive commodity. Anything related to the following can cause immediate moves.:
This is the intraday volatility driver that news traders capitalize on.
Weather in key regions (Daily / weekly) – Focus on the key regions of the U.S. Plains, Black Sea, Australia.
Drought in these regions generally = bullish. Good moisture generally = bearish.
Use simple sources like NOAA maps or short ag weather summaries (weather reports that impact agriculture).
CFTC COT (Weekly) – This is for context and is not used for trading signals. It shows whether funds are heavily long or short. Only the extremes matter:
This report is more relevant for swing and position traders.
3. Recent Market Drivers
Peace-proposal speculation:
Reports of a U.S. proposal involving Ukraine ceding Donbas triggered a fast selloff as markets priced in the possibility of Ukrainian exports normalizing.
Zelenskiy has stated he won’t accept territorial concessions, so a confirmed ceasefire remains unlikely unless U.S./EU pressure increases.
Market reaction:
Wheat dumped immediately on the headline, but the move didn’t sustain — traders want confirmation, not speculation.
China buying U.S. wheat:
Ongoing chatter that China is shifting some purchases to the U.S. (no official tonnage yet). This is a supportive demand story worth monitoring.
4. Chart Analysis: Recent Price Action and What to expect
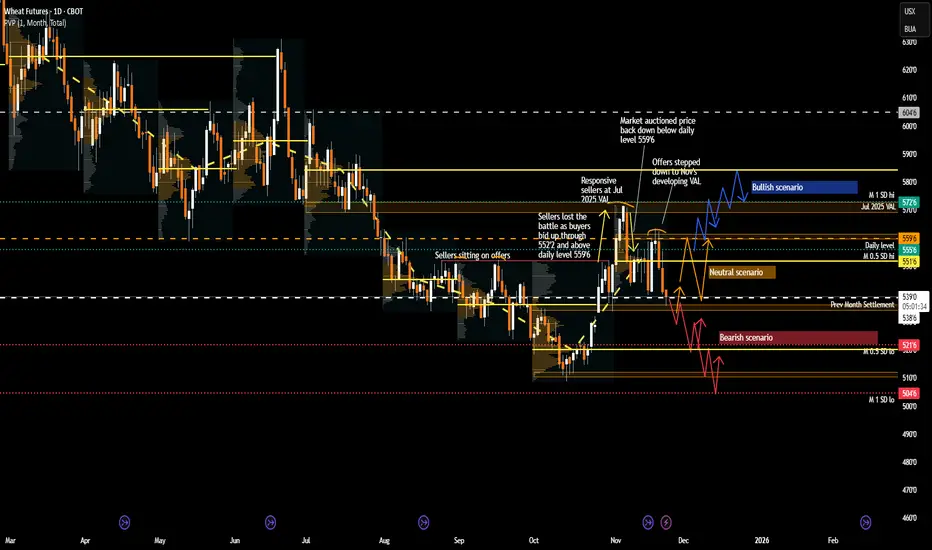
The developing monthly VPOC for November 2025 has shifted higher, marking a potential change in market sentiment after three consecutive months of declining VPOCs. In addition, the developing VA for November appears unlikely to overlap with the previous month’s VA. This suggests that market conditions are changing and that the recent downward trend may be ending.
Market based out around 520 and rallied from mid-October to early November, breaking 552’4 (previous seller defense) and reclaiming back above 559’6 daily level.
This rally was likely supported by the potential U.S.–China trade deal and initial Chinese wheat purchases in early November.
However, sellers stepped in at 570 (July’s VAL + monthly 1SD high), offering price back below 559’6. Market is now rotating inside a developing range between 559’6 and the 540–535’6 zone (October settlement/LVN) to establish value.
Bearish Scenario
A break and acceptance below 540 opens the door toward:
Catalyst: Any news of confirmed progress toward a Russia–Ukraine ceasefire → removal of war-premium → likely downside.
Bullish Scenario
If market accepts back above 559’6, sets up a move toward:
Catalyst: Headline reversal or escalation in the conflict between Russia and Ukraine.
Neutral Scenario
Without fresh catalysts, expect continued range rotation between 559’6 and 540, with the market establishing value in this zone.
5. Conclusion
Wheat remains a headline-driven and weather-sensitive market, where geopolitical developments, major buyer activity, and crop conditions can quickly shift sentiment. Traders should monitor key reports and technical levels while staying aware of global supply and demand dynamics. With multiple factors in play, range rotations and sudden spikes or drops are likely until a clear catalyst drives the market decisively.
What are your thoughts? Are you watching the headlines, weather, or technical levels for clues? Please share your insights below and give this post a boost so the rest of the community can join the conversation.
Glossary Index for technical terms used:
VAH (Value Area High)
VAL (Value Area Low)
VPOC (Volume Point of Control)
SD (Standard Deviation)
LVN (Low Value Node)
VA (Value Area)
1. What Drives Wheat Prices
Supply Factors
Wheat supply is heavily shaped by the major exporting regions—Russia, the EU, Australia, the U.S., Canada, and Ukraine. Weather is the biggest swing factor: drought, heat stress, floods, or winterkill can quickly tighten global supply and spark rallies. Crop progress reports and yield updates show how each production cycle is developing, while geopolitics—especially in the Black Sea—can disrupt export flows overnight. Input costs like fertilizer and fuel influence how much farmers plant, and currency moves affect which exporters are most competitive. Together, these factors determine how much wheat the world can actually deliver to the market. To summarize:
- Major producers: Russia, EU, Australia, U.S., Canada, Ukraine
- Weather: drought, heat stress, winterkill, floods
- Crop progress: planting pace, crop conditions, yield expectations
- Geopolitics: Black Sea tensions, export bans, sanctions, port disruptions
- Input costs: fertilizer, fuel, logistics
- Currency impact: strong USD usually weighs on wheat prices
Demand Factors
Demand for wheat is driven by global food consumption, animal feed needs, and the buying behavior of major importers such as China, Egypt, and Indonesia. Economic conditions matter because stronger economies consume more food and feed. Price relationships with other grains like corn and rice can shift demand toward or away from wheat. Changes in trade flows—such as China sourcing more from the U.S. instead of the Black Sea—can quickly redirect global shipments. These factors help traders understand whether demand is strengthening or weakening relative to available supply. To summarize:
- Global consumption (food + feed use)
- Large importer buying: China, Egypt, Indonesia, Turkey
- Economic conditions in EM (Emerging Markets)
- Substitution vs. corn/rice
- Global trade flow shifts
2. Key Reports Traders Actually Need to Track
Instead of monitoring everything, wheat traders focus on the handful of reports that truly move price:
WASDE (Monthly) – The most important report in wheat trading. This is where global production, consumption, exports, and ending stocks get revised.
Wheat can rip or dump instantly on WASDE changes. If you track only one thing, track WASDE.
Weekly USDA Export Sales – This shows an immediate view of demand. Watch for:
- Big purchases from China, Egypt, Indonesia
- Surprising cancellations
- Shifts from Black Sea to U.S. buying
It’s one of the fastest ways to spot demand changes ahead of price.
Crop Progress (Weekly, in season) – Important only during planting, growing and harvesting periods. The report tracks:
% planted
% harvested
Crop condition (% good/excellent)
Poor Conditions generally = bullish. Strong Conditions generally = bearish
Geopolitical headlines – In our opinion wheat is the most geopolitically sensitive commodity. Anything related to the following can cause immediate moves.:
- Corridor shutdowns
- Port attacks
- Export bans
- Ceasefire rumors
This is the intraday volatility driver that news traders capitalize on.
Weather in key regions (Daily / weekly) – Focus on the key regions of the U.S. Plains, Black Sea, Australia.
Drought in these regions generally = bullish. Good moisture generally = bearish.
Use simple sources like NOAA maps or short ag weather summaries (weather reports that impact agriculture).
CFTC COT (Weekly) – This is for context and is not used for trading signals. It shows whether funds are heavily long or short. Only the extremes matter:
- Funds very short → short-covering rallies possible
- Funds very long → risk of liquidation selloffs
This report is more relevant for swing and position traders.
3. Recent Market Drivers
Peace-proposal speculation:
Reports of a U.S. proposal involving Ukraine ceding Donbas triggered a fast selloff as markets priced in the possibility of Ukrainian exports normalizing.
Zelenskiy has stated he won’t accept territorial concessions, so a confirmed ceasefire remains unlikely unless U.S./EU pressure increases.
Market reaction:
Wheat dumped immediately on the headline, but the move didn’t sustain — traders want confirmation, not speculation.
China buying U.S. wheat:
Ongoing chatter that China is shifting some purchases to the U.S. (no official tonnage yet). This is a supportive demand story worth monitoring.
4. Chart Analysis: Recent Price Action and What to expect
The developing monthly VPOC for November 2025 has shifted higher, marking a potential change in market sentiment after three consecutive months of declining VPOCs. In addition, the developing VA for November appears unlikely to overlap with the previous month’s VA. This suggests that market conditions are changing and that the recent downward trend may be ending.
Market based out around 520 and rallied from mid-October to early November, breaking 552’4 (previous seller defense) and reclaiming back above 559’6 daily level.
This rally was likely supported by the potential U.S.–China trade deal and initial Chinese wheat purchases in early November.
However, sellers stepped in at 570 (July’s VAL + monthly 1SD high), offering price back below 559’6. Market is now rotating inside a developing range between 559’6 and the 540–535’6 zone (October settlement/LVN) to establish value.
Bearish Scenario
A break and acceptance below 540 opens the door toward:
- 520 (October’s VPOC + monthly 0.5SD low)
- 510 (October low)
- 504’6 (monthly 1SD low)
Catalyst: Any news of confirmed progress toward a Russia–Ukraine ceasefire → removal of war-premium → likely downside.
Bullish Scenario
If market accepts back above 559’6, sets up a move toward:
- 570 (July VAL / M 1SD high) — expect sellers here.
- 585’6 (July VPOC) if 570 is cleared
Catalyst: Headline reversal or escalation in the conflict between Russia and Ukraine.
Neutral Scenario
Without fresh catalysts, expect continued range rotation between 559’6 and 540, with the market establishing value in this zone.
5. Conclusion
Wheat remains a headline-driven and weather-sensitive market, where geopolitical developments, major buyer activity, and crop conditions can quickly shift sentiment. Traders should monitor key reports and technical levels while staying aware of global supply and demand dynamics. With multiple factors in play, range rotations and sudden spikes or drops are likely until a clear catalyst drives the market decisively.
What are your thoughts? Are you watching the headlines, weather, or technical levels for clues? Please share your insights below and give this post a boost so the rest of the community can join the conversation.
Glossary Index for technical terms used:
VAH (Value Area High)
VAL (Value Area Low)
VPOC (Volume Point of Control)
SD (Standard Deviation)
LVN (Low Value Node)
VA (Value Area)
EdgeClear
P: 773.832.8320
Derivatives trading involves a substantial risk of loss. Past performance is not indicative of future results. Any example trades are not inclusive of fees and commissions.
P: 773.832.8320
Derivatives trading involves a substantial risk of loss. Past performance is not indicative of future results. Any example trades are not inclusive of fees and commissions.
Pernyataan Penyangkalan
The information and publications are not meant to be, and do not constitute, financial, investment, trading, or other types of advice or recommendations supplied or endorsed by TradingView. Read more in the Terms of Use.
Pernyataan Penyangkalan
The information and publications are not meant to be, and do not constitute, financial, investment, trading, or other types of advice or recommendations supplied or endorsed by TradingView. Read more in the Terms of Use.