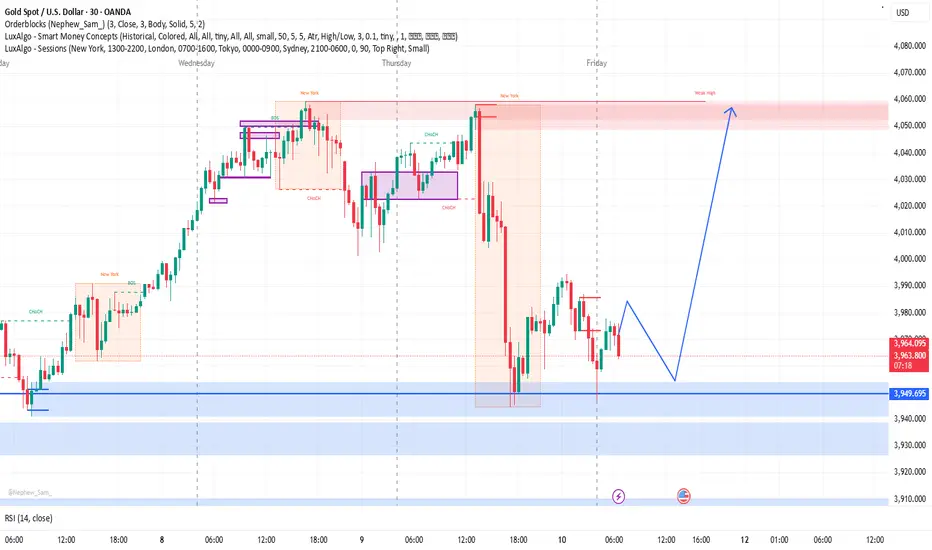
The chart shows the 30-minute timeframe of XAU/USD (Gold Spot vs. U.S. Dollar) with a clear Smart Money Concepts (SMC) analysis using LuxAlgo indicators. The market recently experienced a sharp drop after hitting a resistance zone marked by an order block and a weak high near the 3,976 level. Currently, the price is retracing after tapping into a strong demand zone around 3,947–3,950, suggesting potential bullish interest. The projected blue line indicates a possible bullish move after a short-term retracement, aiming for a return to the previous high. The RSI at around 43 signals neutral momentum, supporting the possibility of either consolidation or a reversal from this key support area.
Pernyataan Penyangkalan
Informasi dan publikasi tidak dimaksudkan untuk menjadi, dan bukan merupakan saran keuangan, investasi, perdagangan, atau rekomendasi lainnya yang diberikan atau didukung oleh TradingView. Baca selengkapnya di Persyaratan Penggunaan.
Pernyataan Penyangkalan
Informasi dan publikasi tidak dimaksudkan untuk menjadi, dan bukan merupakan saran keuangan, investasi, perdagangan, atau rekomendasi lainnya yang diberikan atau didukung oleh TradingView. Baca selengkapnya di Persyaratan Penggunaan.