Gold: Wave 5 isn't over yet, awaiting ABC correction
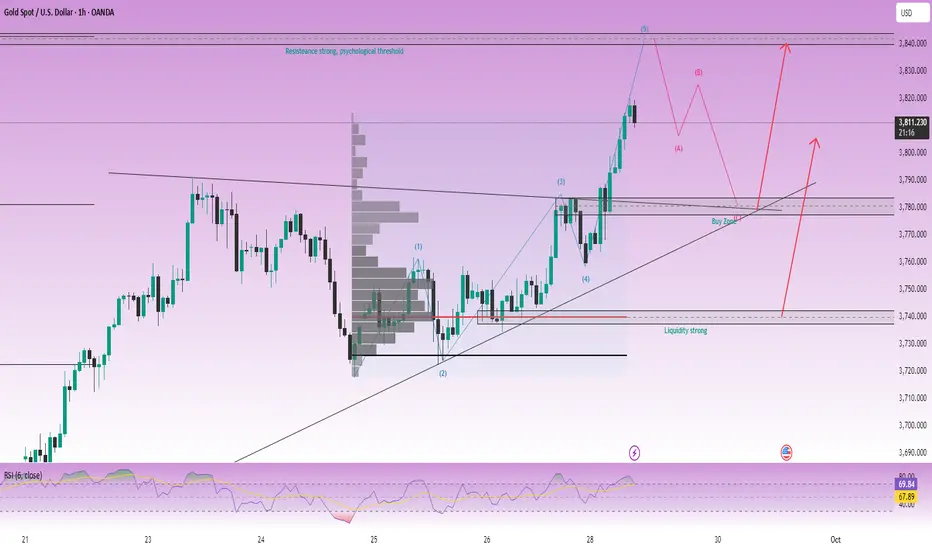
According to the Elliott Wave perspective, gold is currently in wave 5 and has not shown any clear reversal signals. Once wave 5 completes, a reasonable scenario would be entering the ABC correction phase.
Technical Analysis
The current price range remains in an uptrend, supported by the medium-term trendline.
Key resistance – support levels are identified based on Fibonacci, Volume Profile, and strong psychological thresholds.
RSI indicates that gold is approaching the overbought zone, thus short-term Sell orders (scalping) around the peak area could be advantageous.
Trading Plan Reference
Sell: 3840 – 3842, SL 3846. This is a strong resistance area, prioritize scalping if the downward reaction lacks momentum.
Buy: 3783 – 3785, SL 3779, TP 3800 – 3818 – 3838.
Large liquidity Buy: 3740, SL 3733, expecting a strong reaction from this area due to previous accumulation volume.
Important Notes
Early in the week, there are often numerous political – economic news causing noise, which could unexpectedly push gold higher.
Resistance areas 3840–3850 are strong psychological levels, observe the reaction before making decisions.
For short-term trades, stick closely to the plan, while flexibly adjusting when price paths change to maintain an advantage.
In summary, wave 5 is still developing, and trading opportunities mainly focus on key resistance – support areas. Traders need to manage risk well, patiently wait for confirmation, and remain flexible to adapt to fluctuations.
The DXY index fell to around 97.95 on Monday, extending its decline into the second session as the risk of a U.S. government shutdown weakens market sentiment and investors await a series of important economic data releases this week.
Wishing you successful trading, follow me and the trading community!
🔥10–15 daily XAUUSD & Forex signals
📈86% win rate per session
⏱️Real-time alerts with solid technical analysis
💡Consistency comes from the right trading plan
👉 Join my group for full signals & insights in real time t.me/+tU_Yj46vy9QwYzU1
📈86% win rate per session
⏱️Real-time alerts with solid technical analysis
💡Consistency comes from the right trading plan
👉 Join my group for full signals & insights in real time t.me/+tU_Yj46vy9QwYzU1
Publikasi terkait
Pernyataan Penyangkalan
Informasi dan publikasi tidak dimaksudkan untuk menjadi, dan bukan merupakan saran keuangan, investasi, perdagangan, atau rekomendasi lainnya yang diberikan atau didukung oleh TradingView. Baca selengkapnya di Persyaratan Penggunaan.