📊 Current Price Context (as of mid‑January 2026)
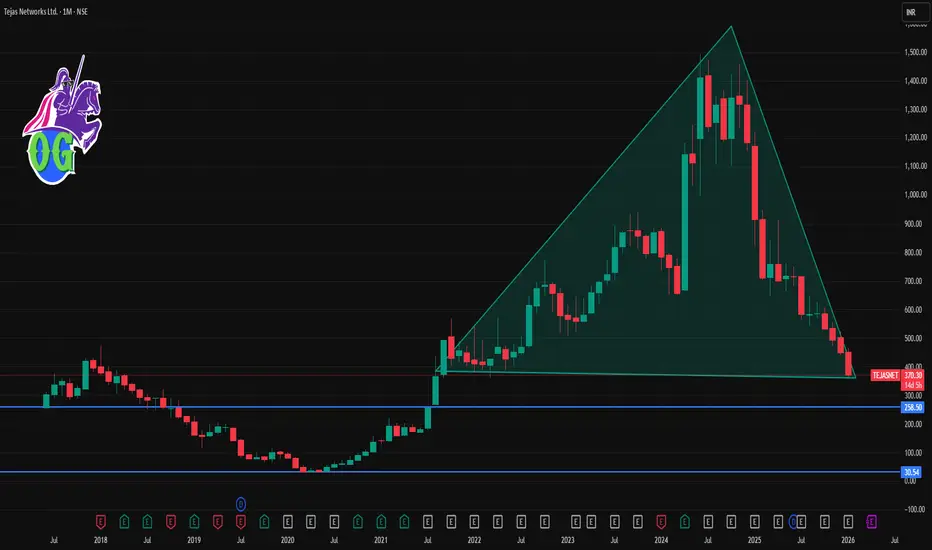
Tejas Networks is trading around ₹370‑₹375 on NSE/BSE.
The stock recently hit a 52‑week low near ₹364 after weak quarterly earnings and sales decline.
📉 Short‑Term Technical Levels (1‑Month View)
🔻 Immediate Support Zones
These are levels where the stock could find buyers or stall further declines:
₹366‑₹370 — current short‑term support (intraday pivot & recent low).
₹362‑₹366 — lower pivot/secondary intraday support.
~₹356‑₹362 — deeper support if momentum remains weak.
📈 Resistance Levels (Upside Hurdles)
For any bounce or recovery attempt:
₹377‑₹380 — near current pivot/resistance range.
~₹390‑₹395 — next resistance zone (prior price congestion).
₹405‑₹410+ — stronger resistance (short‑term target for recovery).
🧠 Trading/Price Action Tips (1‑month)
Bullish Scenario (countertrend bounce):
A break above ₹380‑₹390 with good volume could shift short‑term sentiment and target ₹405‑₹410+.
Bearish/Continued downtrend:
If support at ₹366‑₹370 breaks convincingly, the next zone near ₹362 then ₹356–₹360 becomes focus.
Publikasi terkait
Pernyataan Penyangkalan
Informasi dan publikasi ini tidak dimaksudkan, dan bukan merupakan, saran atau rekomendasi keuangan, investasi, trading, atau jenis lainnya yang diberikan atau didukung oleh TradingView. Baca selengkapnya di Ketentuan Penggunaan.
Publikasi terkait
Pernyataan Penyangkalan
Informasi dan publikasi ini tidak dimaksudkan, dan bukan merupakan, saran atau rekomendasi keuangan, investasi, trading, atau jenis lainnya yang diberikan atau didukung oleh TradingView. Baca selengkapnya di Ketentuan Penggunaan.