🎯 Key Levels
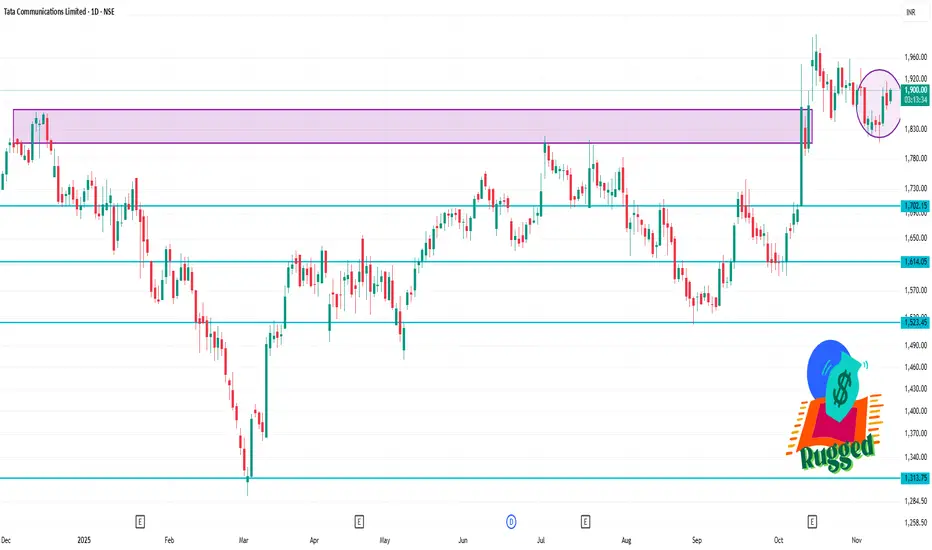
Current price (recent quote): ~ ₹1,876.
Pivot levels (daily classic):
Pivot ≈ ₹1,895.73
Support 1 (S1) ≈ ₹1,890.36
Resistance 1 (R1) ≈ ₹1,900.86
Additional support/resistance: S2 ≈ ₹1,885.23, R2 ≈ ₹1,906.23
Moving Average supports:
50-day SMA ≈ ₹1,858.81
100-day SMA ≈ ₹1,882.54
200-day SMA ≈ ₹1,846.83
✅ Trading Implications
If the stock manages to break and hold above the pivot (~₹1,895.7), then the next target is near ₹1,900–₹1,906 (R1/R2 area).
If it fails and drops below support levels (~₹1,890 and ~₹1,885), then watch for deeper support around the 50-day SMA (~₹1,858) or even ~₹1,846 (200-day SMA) in a more significant correction.
Given the bullish indicators, the preferred scenario is a break to the upside, but one must be aware of risk of reversal/weakness if momentum fades.
Publikasi terkait
Pernyataan Penyangkalan
Informasi dan publikasi ini tidak dimaksudkan, dan bukan merupakan, saran atau rekomendasi keuangan, investasi, trading, atau jenis lainnya yang diberikan atau didukung oleh TradingView. Baca selengkapnya di Ketentuan Penggunaan.
Publikasi terkait
Pernyataan Penyangkalan
Informasi dan publikasi ini tidak dimaksudkan, dan bukan merupakan, saran atau rekomendasi keuangan, investasi, trading, atau jenis lainnya yang diberikan atau didukung oleh TradingView. Baca selengkapnya di Ketentuan Penggunaan.