Here is a detailed **technical analysis** of the **Motilal Oswal Financial Services Ltd (MOFSL)** daily chart
---
## 🔍 **Motilal Oswal – Daily Chart Technical Analysis**
### 🧩 **Chart Patterns Observed**
#### 1. **Falling Wedge Pattern (Bullish Reversal)**
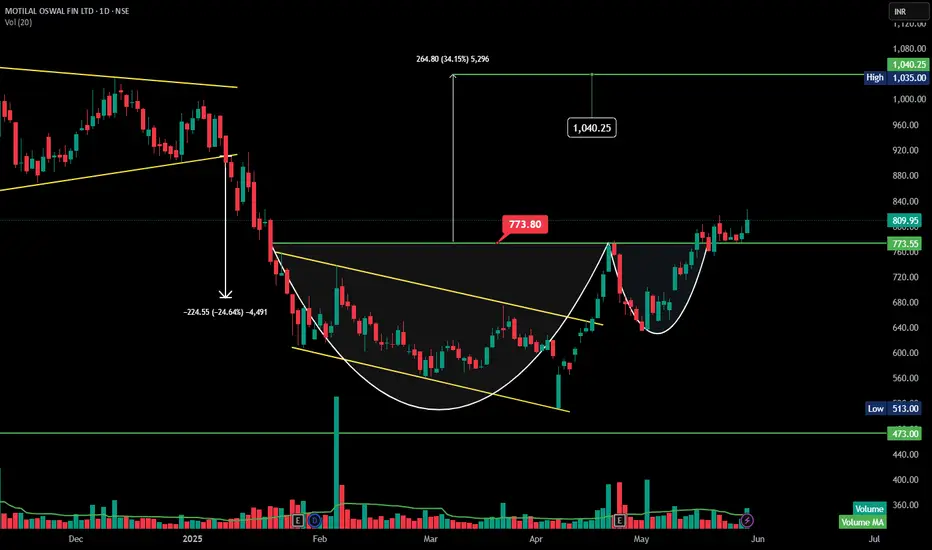
* After a significant downtrend of \~25% (from ₹909 to ₹685), the stock formed a **falling wedge**, a classic bullish reversal pattern.
* The breakout from this wedge marked the end of the downtrend and the start of base-building.
#### 2. **Cup and Handle Breakout**
* The stock formed a **smooth, rounded bottom** (the cup) between February and April.
* A shallow **handle formation** followed, confirming healthy consolidation before the breakout.
* **Breakout above ₹773.80**, which was the neckline of the cup pattern, has triggered bullish momentum.
---
### 📏 **Price Action & Measured Move**
| Component | Value |
| -------------------- | ------------------------------------------ |
| Cup Low | ₹513 |
| Neckline (Breakout) | ₹773.80 |
| Depth of Cup | ₹773.80 - ₹513 = ₹260 |
| Measured Move Target | ₹773.80 + ₹260 = **₹1040** *(minimum)* |
But the chart suggests a **larger swing target**:
* **Upside projection:** ₹773.80 + ₹264.80 = **₹1,040.25**
* This is based on broader trendline breakout from wedge to neckline move.
---
### 📊 **Volume Analysis**
Volume is missing during breakout
---
### 🔑 **Key Technical Levels**
| Level Type | Price (₹) |
| --------------------------- | --------- |
| Breakout Zone | 773.80 |
| Immediate Support | 773.55 |
| Strong Support (Trend Base) | 640 |
---
### 📌 **Technical Conclusion**
✅ **Bias:** Strongly **Bullish**
* The breakout above ₹773.80 confirms bullish momentum.
* With current price at ₹809.95, it has already moved \~36 points from the breakout — early entry window may be closing.
⚠️ **Next Steps:**
* Traders may **trail SL** to breakout zone (₹773–774).
* Watch for follow-through above ₹820 for confirmation toward **₹1,040 target**.
* Any retest of ₹780–790 zone may offer a **high-probability entry**.
---
### 🎯 **Trade Strategy**
| Strategy Type | Action |
| ------------- | ------------------------------------------ |
| Swing Trade | Buy on dips near ₹790–₹800; Target: ₹1,040 |
| Stop-loss | ₹772 (below breakout + handle support) |
| Risk-Reward | \~1:3 if targeting ₹1,040 |
---
---
## 🔍 **Motilal Oswal – Daily Chart Technical Analysis**
### 🧩 **Chart Patterns Observed**
#### 1. **Falling Wedge Pattern (Bullish Reversal)**
* After a significant downtrend of \~25% (from ₹909 to ₹685), the stock formed a **falling wedge**, a classic bullish reversal pattern.
* The breakout from this wedge marked the end of the downtrend and the start of base-building.
#### 2. **Cup and Handle Breakout**
* The stock formed a **smooth, rounded bottom** (the cup) between February and April.
* A shallow **handle formation** followed, confirming healthy consolidation before the breakout.
* **Breakout above ₹773.80**, which was the neckline of the cup pattern, has triggered bullish momentum.
---
### 📏 **Price Action & Measured Move**
| Component | Value |
| -------------------- | ------------------------------------------ |
| Cup Low | ₹513 |
| Neckline (Breakout) | ₹773.80 |
| Depth of Cup | ₹773.80 - ₹513 = ₹260 |
| Measured Move Target | ₹773.80 + ₹260 = **₹1040** *(minimum)* |
But the chart suggests a **larger swing target**:
* **Upside projection:** ₹773.80 + ₹264.80 = **₹1,040.25**
* This is based on broader trendline breakout from wedge to neckline move.
---
### 📊 **Volume Analysis**
Volume is missing during breakout
---
### 🔑 **Key Technical Levels**
| Level Type | Price (₹) |
| --------------------------- | --------- |
| Breakout Zone | 773.80 |
| Immediate Support | 773.55 |
| Strong Support (Trend Base) | 640 |
---
### 📌 **Technical Conclusion**
✅ **Bias:** Strongly **Bullish**
* The breakout above ₹773.80 confirms bullish momentum.
* With current price at ₹809.95, it has already moved \~36 points from the breakout — early entry window may be closing.
⚠️ **Next Steps:**
* Traders may **trail SL** to breakout zone (₹773–774).
* Watch for follow-through above ₹820 for confirmation toward **₹1,040 target**.
* Any retest of ₹780–790 zone may offer a **high-probability entry**.
---
### 🎯 **Trade Strategy**
| Strategy Type | Action |
| ------------- | ------------------------------------------ |
| Swing Trade | Buy on dips near ₹790–₹800; Target: ₹1,040 |
| Stop-loss | ₹772 (below breakout + handle support) |
| Risk-Reward | \~1:3 if targeting ₹1,040 |
---
Pernyataan Penyangkalan
Informasi dan publikasi ini tidak dimaksudkan, dan bukan merupakan, saran atau rekomendasi keuangan, investasi, trading, atau jenis lainnya yang diberikan atau didukung oleh TradingView. Baca selengkapnya di Ketentuan Penggunaan.
Pernyataan Penyangkalan
Informasi dan publikasi ini tidak dimaksudkan, dan bukan merupakan, saran atau rekomendasi keuangan, investasi, trading, atau jenis lainnya yang diberikan atau didukung oleh TradingView. Baca selengkapnya di Ketentuan Penggunaan.