The Market Week in Review is my weekend homework where I look over what happened in the previous week and what might come in the next week. It helps me evaluate my observations, recognize new data points, and create a plan for possible scenarios in the future.
I do occasionally have some errors or typos and will correct them in my blog or in the comments on TradingView. I do not have an editor and do this in my free time.
If you find this helpful, please let me know in the comments. I am also more than happy to add new perspectives and data points if you have ideas.
The structure is the following:
If you have been following my daily updates, you can skip down to the “The Meaning of Life”. If not, then this first part is a great play-by-play recap for the week. Click the daily charts for more detail on sectors, indexes and market leaders each day.
-=x=-=x=-=x=-=x=-=x=-=x=-=x=-
Monday, March 29, 2021

Facts: -0.6%, Volume lower, Closing range: 52%, Body: -25%
Good: Inside day on lower volume with a slightly longer lower wick
Bad: Lower high with two intraday dips
Highs/Lows: Lower high, higher low
Candle: Red body in the middle of candle with a longer lower wick
Advance/Decline: 5 declining stocks for every advancing stock
Indexes: SPX (-0.09%), DJI (+0.30%), RUT (-2.83%), VIX (+9.97%)
Sectors: Utilities (XLU +1.07%) and Communications (XLC +1.02%) were top. Financials (XLF -0.32%) and Energy (XLE -1.19%) were bottom.
Expectation: Sideways or Higher
It was a choppy day to start the week. The intraday movement has the look of a spiral that indicates indecision in the market. That's not unexpected considering that investors had a few things to be nervous about including the re-opening of the Suez Canal and the large forced fire-sale from Archegos continuing into this week. It's also no surprise seeing the impact to the Energy and Financials sectors.
The Nasdaq closed with a -0.6% loss on lower volume for the day. The inside day has a lower high and higher low. The closing range is 0.52% which is above the 0.40% that we want to see, and the longer lower wick indicates an upward trend intraday. So despite the red body and decline for the day, there are some positives to the candle. On the other hand, there were five declining stocks for every advancing stock on the Nasdaq.
-=x=-=x=-=x=-=x=-=x=-=x=-=x=-
Tuesday, March 30, 2021
Facts: -0.11%, Volume lower, Closing range: 80%, Body: +24%
Good: Closing range of 80%, recovered from morning dip below 13,000
Bad: Lower high, lower low, trending down
Highs/Lows: Lower high, lower low
Candle: Thin green body in the upper half of the candle, longer lower wick
Advance/Decline: A bit more than one advancing stock for every declining stock
Indexes: SPX (-0.32%), DJI (-0.31%), RUT (+1.72%), VIX (-5.45%)
Sectors: Consumer Discretionary (XLY +0.98%) and Financials (XLF +0.70%) were top. Technology (XLK -0.95%) and Consumer Staples (XLP -1.07%).
Expectation: Sideways or Higher
The bond market continued to show its influence on equities today, seemingly in a battle with strong consumer confidence numbers. A pre-market spike in long-term bond yields drove the Financials sector to a gap up at open. However, the yields began to taper off even before stronger than expected consumer confidence numbers were released after market open. The strong numbers sent the Consumer Discretionary sector to the top to finish the day.
The Nasdaq never quite recovered from the morning yield scare, but did end the day in the upper range of the candle. The index closed with a -0.11% loss for the day on lower volume. The closing range of 80% is good indicator for intraday bullishness, but the 24% body and lower high means the index still has much to prove. There were 1.2 advancing stocks for every declining stock.
-=x=-=x=-=x=-=x=-=x=-=x=-=x=-
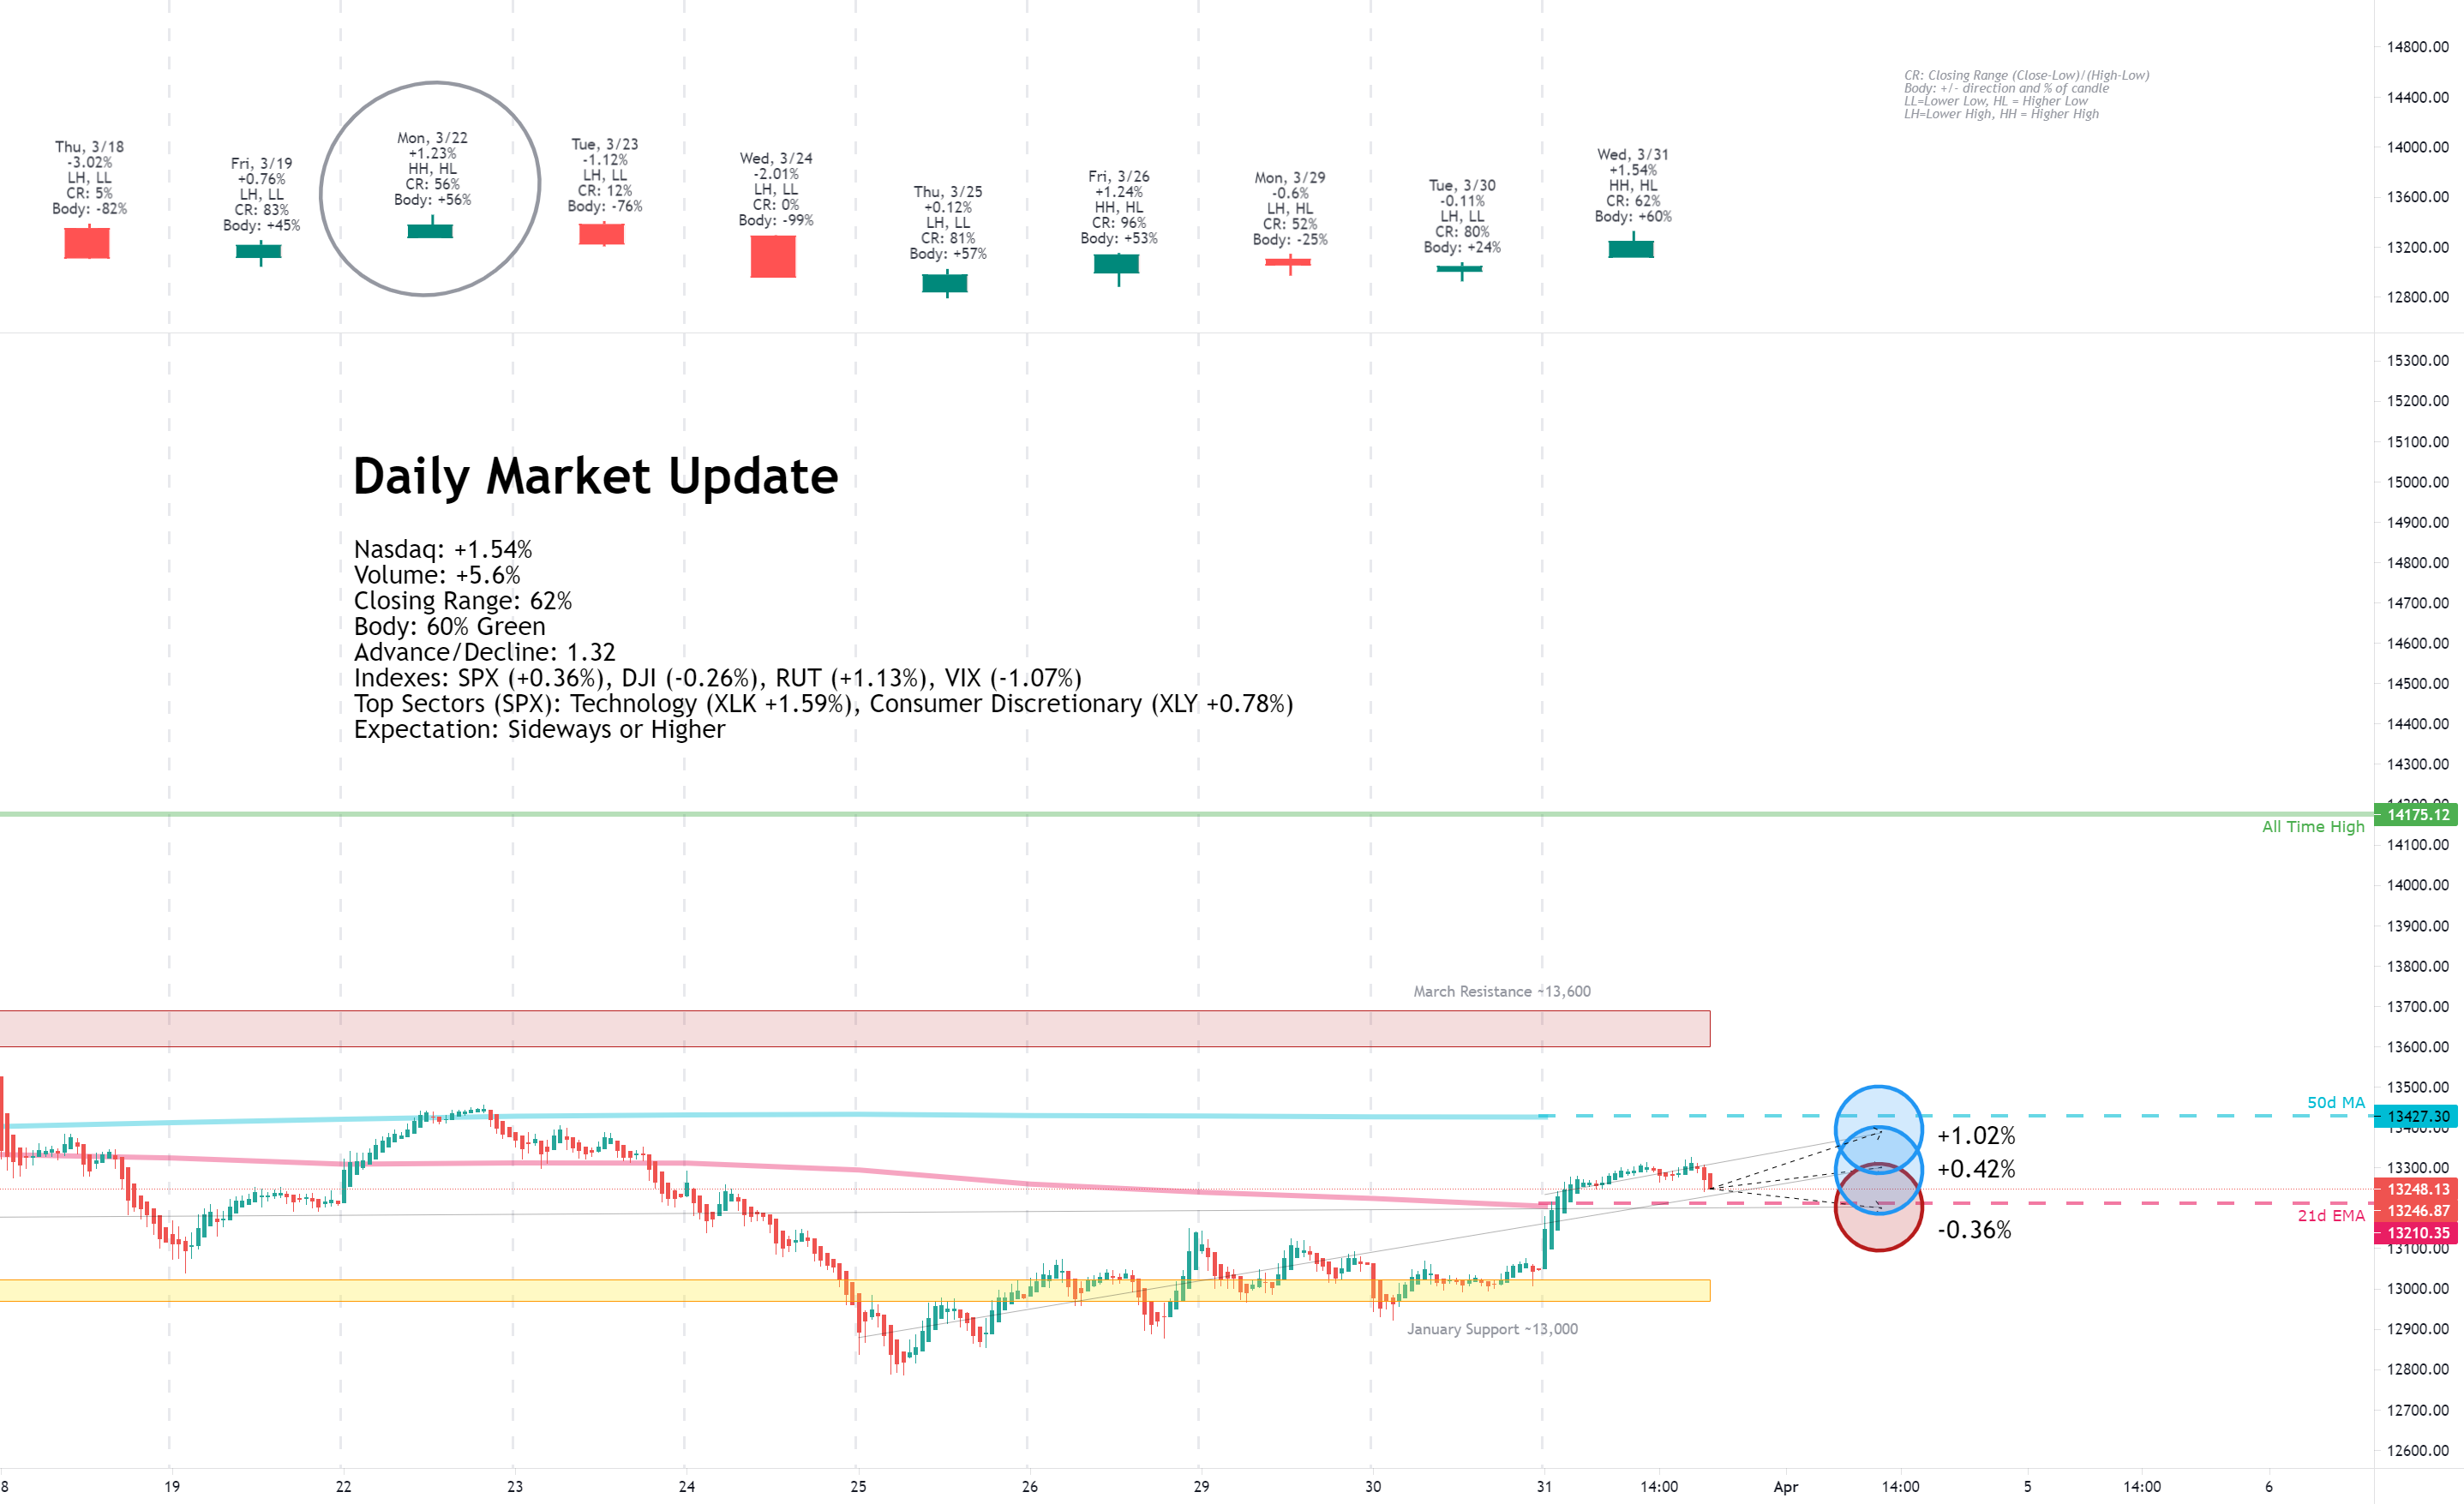
Wednesday, March 31, 2021
Facts: +1.54%, Volume higher, Closing range: 62%, Body: +60%
Good: Higher high, lower low, back above the 21d EMA
Bad: Fade at the end of the day created long upper wick
Highs/Lows: Higher high, higher low
Candle: Thick green body with n lower wick, long upper wick
Advance/Decline: More advancing stocks than declining stocks
Indexes: SPX (+0.36%), DJI (-0.26%), RUT (+1.13%), VIX (-1.07%)
Sectors: Technology (XLK +1.59%) and Consumer Discretionary (XLY +0.78%) were top. Energy (XLE -0.69%) and Financials (XLF -0.76%) were bottom.
Expectation: Sideways or Higher
The breakout that wasn't. News from Microsoft drove a mid-afternoon buying frenzy that was visible in the Microsoft intraday chart and big enough to show up in both the Nasdaq and S&P 500 charts. However, the breakout quickly faded and took the indexes with it to close away from intraday highs. Still there were good gains in the market thanks to a bullish morning on positive economic outlook with Biden's announced infrastructure plans.
The Nasdaq closed with a +1.54% gain on higher volume, and gave us the gain with higher confidence we were waiting for. The closing range of 62% is above a 60% body with no lower wick. There is a long upper wick from the dip at the end of the day. There were 1.32 advancing stocks for every declining stock.
-=x=-=x=-=x=-=x=-=x=-=x=-=x=-
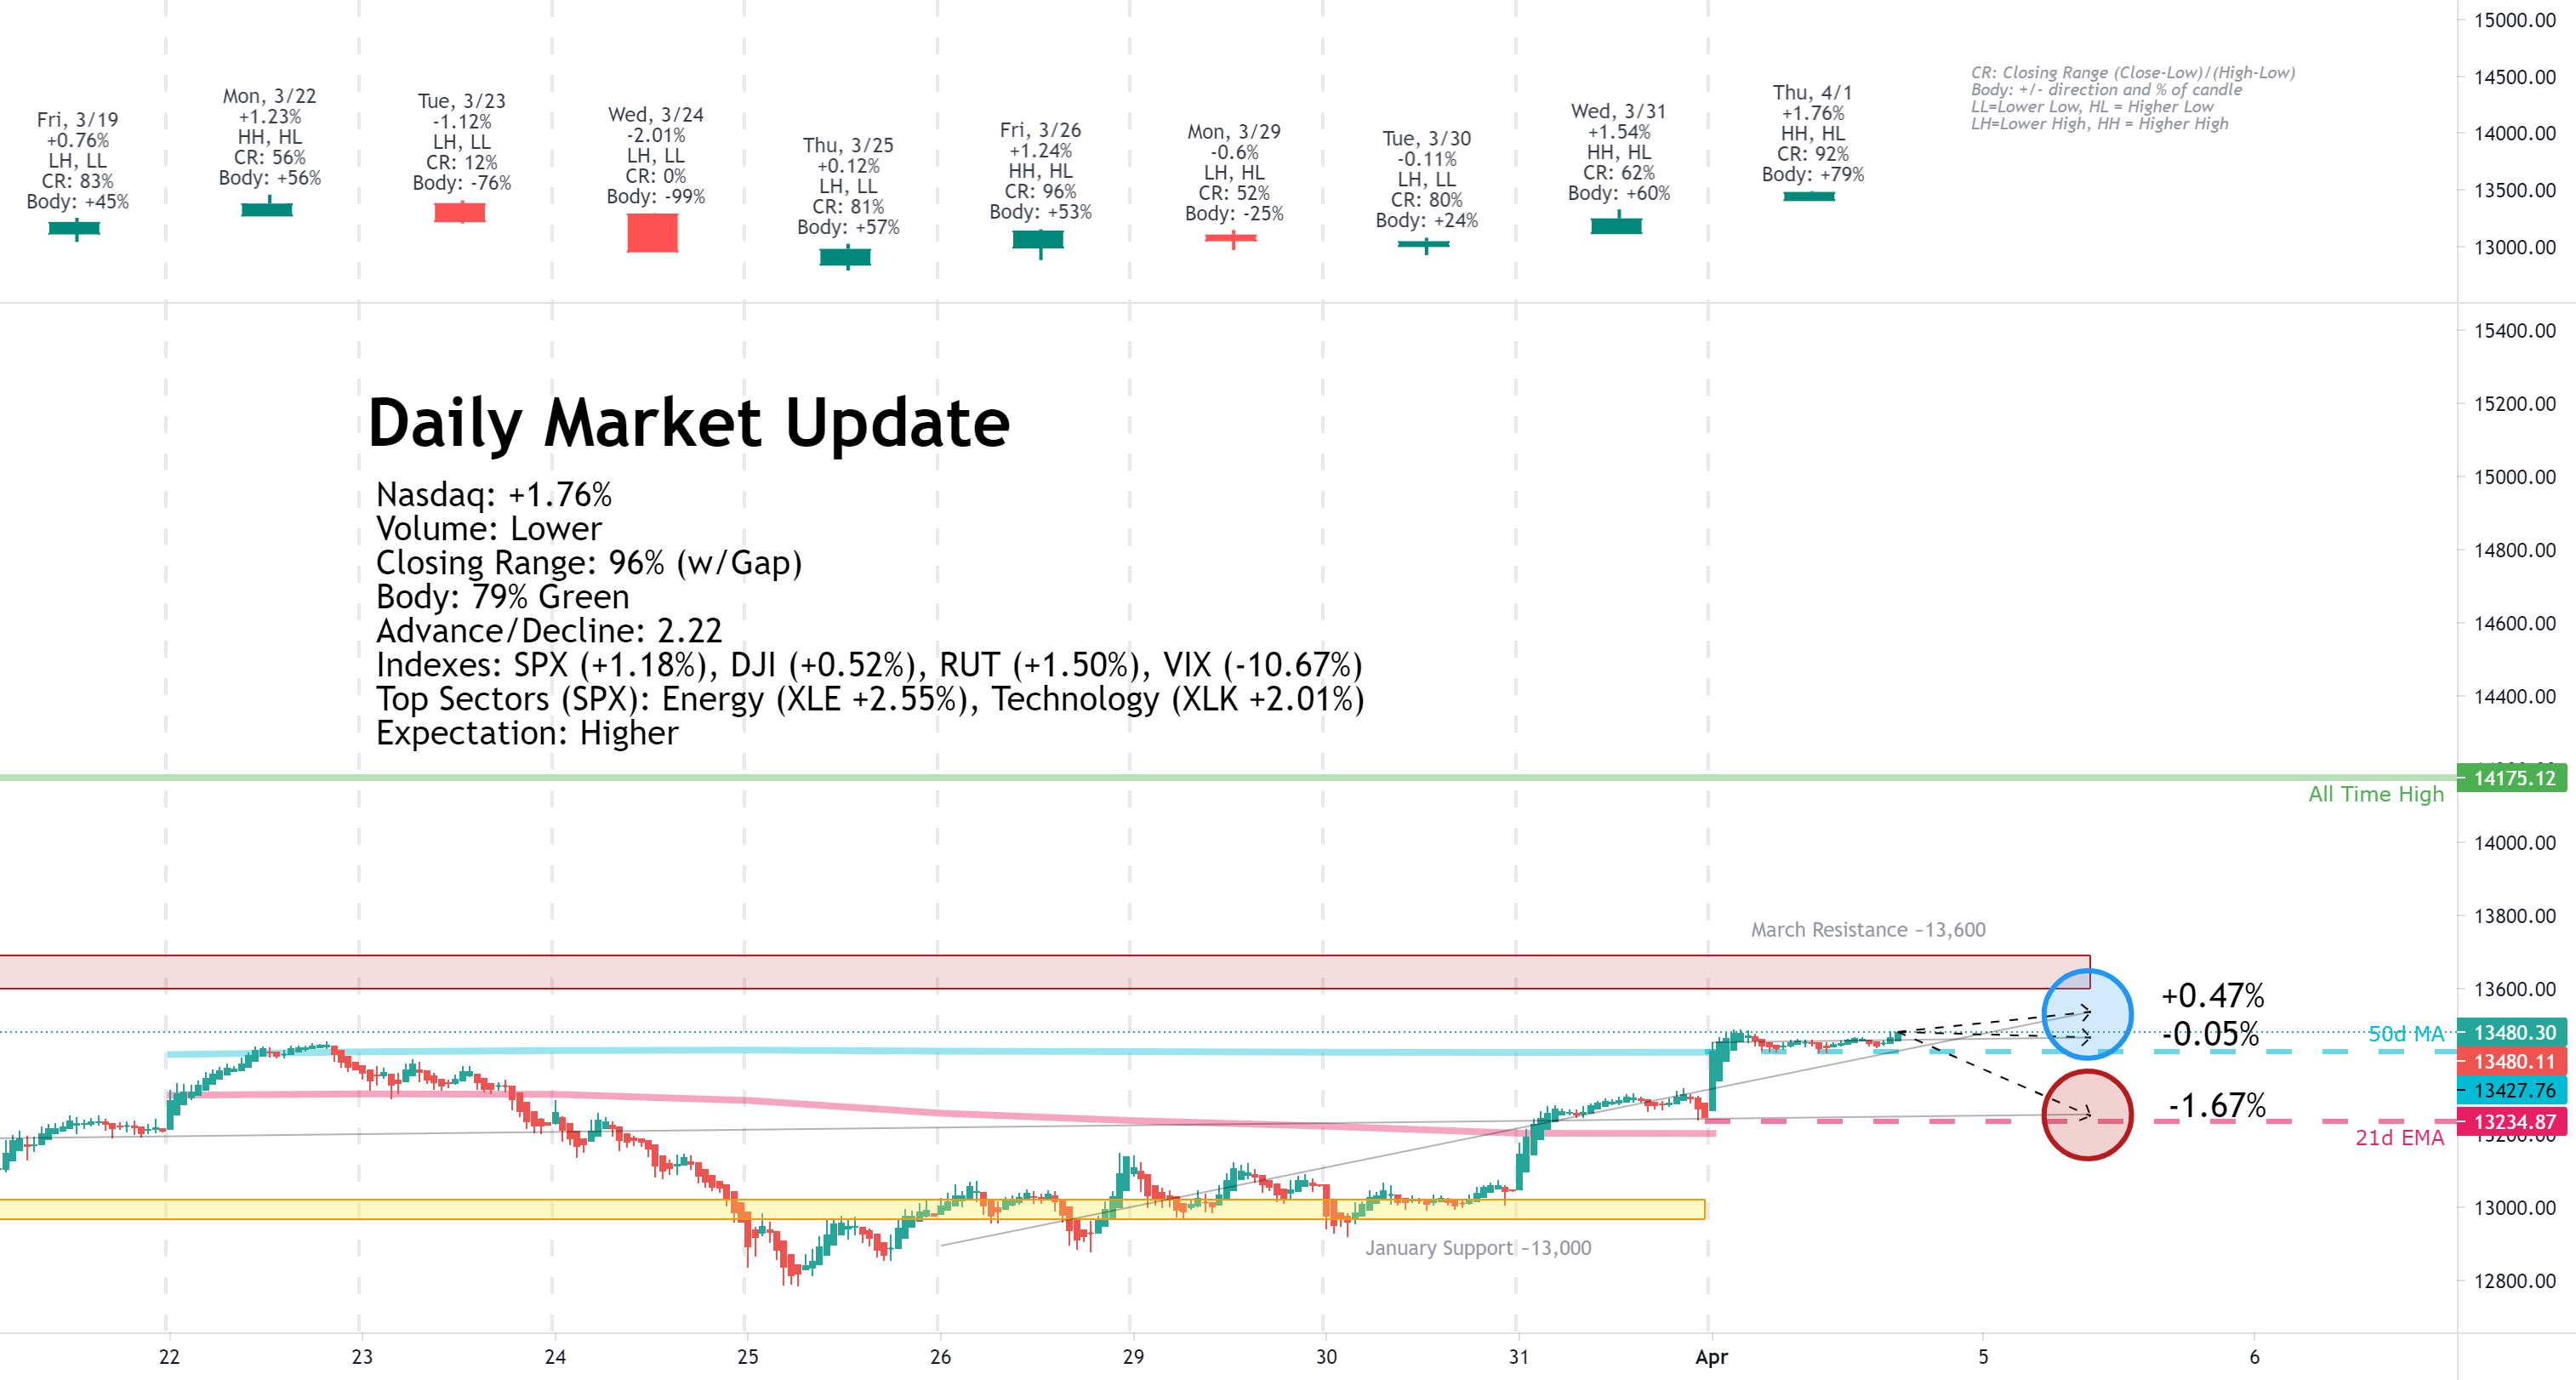
Thursday, April 1, 2021
Facts: +1.76%, Volume lower, Closing range: 96% (w/ Gap), Body: +79%
Good: Rally above and stayed above 50d MA
Bad: Flat after initial rally
Highs/Lows: Higher high, higher low
Candle: Gap up, Mostly green body with barely visible upper and lower wicks.
Advance/Decline: Two advancing stocks for every declining stock
Indexes: SPX (+1.18%), DJI (+0.52%), RUT (+1.50%), VIX (-10.67%)
Sectors: Energy (XLE +2.55%) and Technology (XLK +2.01%) were top. Health (XLV -0.30%) and Consumer Staples (XLP -0.48%) were bottom.
Expectation: Sideways or Higher
Hello April and Q2! The Nasdaq leapt into the new month and quarter with a gap up and rise above the 50d moving average while the S&P 5000 closed over 4000 for the first time in history. Solid breakouts from big tech and a breadth of gains across indexes and sectors helped put strength behind the moves.
The Nasdaq closed with a +1.76% gain on lower volume. The 96% closing range includes the gap and represents a quick rise in the morning that leveled off but never gave back the gains. The 79% body includes a few tests of the 50d MA in intraday trading, but support held. There were two advancing stocks for every declining stock.
-=x=-=x=-=x=-=x=-=x=-=x=-=x=-
The Meaning of Life (View on the Week)
This week marked the end of the first quarter of 2021, a quarter of volatility driven by the retail frenzy around meme stocks, a steepening yield curve caused by inflation fears and the landing of over a trillion dollars of support to the economy.
The last few days of the quarter also had its dramas. All eyes were on the ship stuck in the Suez Canal to open the week. Investors were also shocked by a $20b fire sale of positions from Archegos family fund at the end of the previous week and beginning of this week. That nervousness brought the index down on Monday and Tuesday to test the lower line of the channel from the March 2020 bottom.
On Wednesday, Biden released his plan to boost the economic recovery through a massive multi-trillion dollar infrastructure investment. That gave the whole market a kick start for the day. Buyers came in and got the index back above the kay moving average lines with a rally on Wednesday to pass the 21d EMA and gap-up on Thursday to pass the 50d MA. The gains Thursday were shared broadly across the market with the S&P 500 (SPX) hitting the milestone of closing above 4000 for the first time.
Microsoft made its market influence known this week. On Wednesday, it released news around 3pm that the US Army had agreed to a large purchase of a customized Hololens, an augmented reality device. The news not only sent the Microsoft price soaring, but because of its oversized market cap, the move was visible in both the Nasdaq and S&P 500. The huge move, that happened within 5 minutes, sold-off for the remaining hour and brought the indexes back down.
Even with the sell-off before close on Wednesday, the message was received that big tech was back and ready to continue growth even as investors were looking to value stocks. Thursday all of the tech mega-caps had gains. Both Microsoft and Alphabet had breakouts from bases. The Nasdaq appeared to be back in the game.
The Nasdaq advanced +2.60% for the week. The closing range is 99% as the index closed near its high on Friday.
Volume was lower, but it's important to note that Nasdaq and US market volume is on a decline from higher-than-average volume in 2020 and early 2021. Comparing volume to the broader US stock market volume, Nasdaq comparatively was higher than the previous week.
We've got a higher high and a higher low, after the index tested the lower line of the channel from the March 2020 bottom. The index has resistance around 13,600 and we'll watch that closely as the higher lows squeeze into an ascending triangle.
The S&P 500 has the focus this week since it closed above 4000 after advancing +1.15%. The Russell 2000 (RUT) is attempting to regain its advance with a +1.46% gain this week. The Dow Jones Industrial average (DJI) advanced +0.52%
The VIX volatility index closed at its lowest point since before the pandemic with a -8.11% decline.
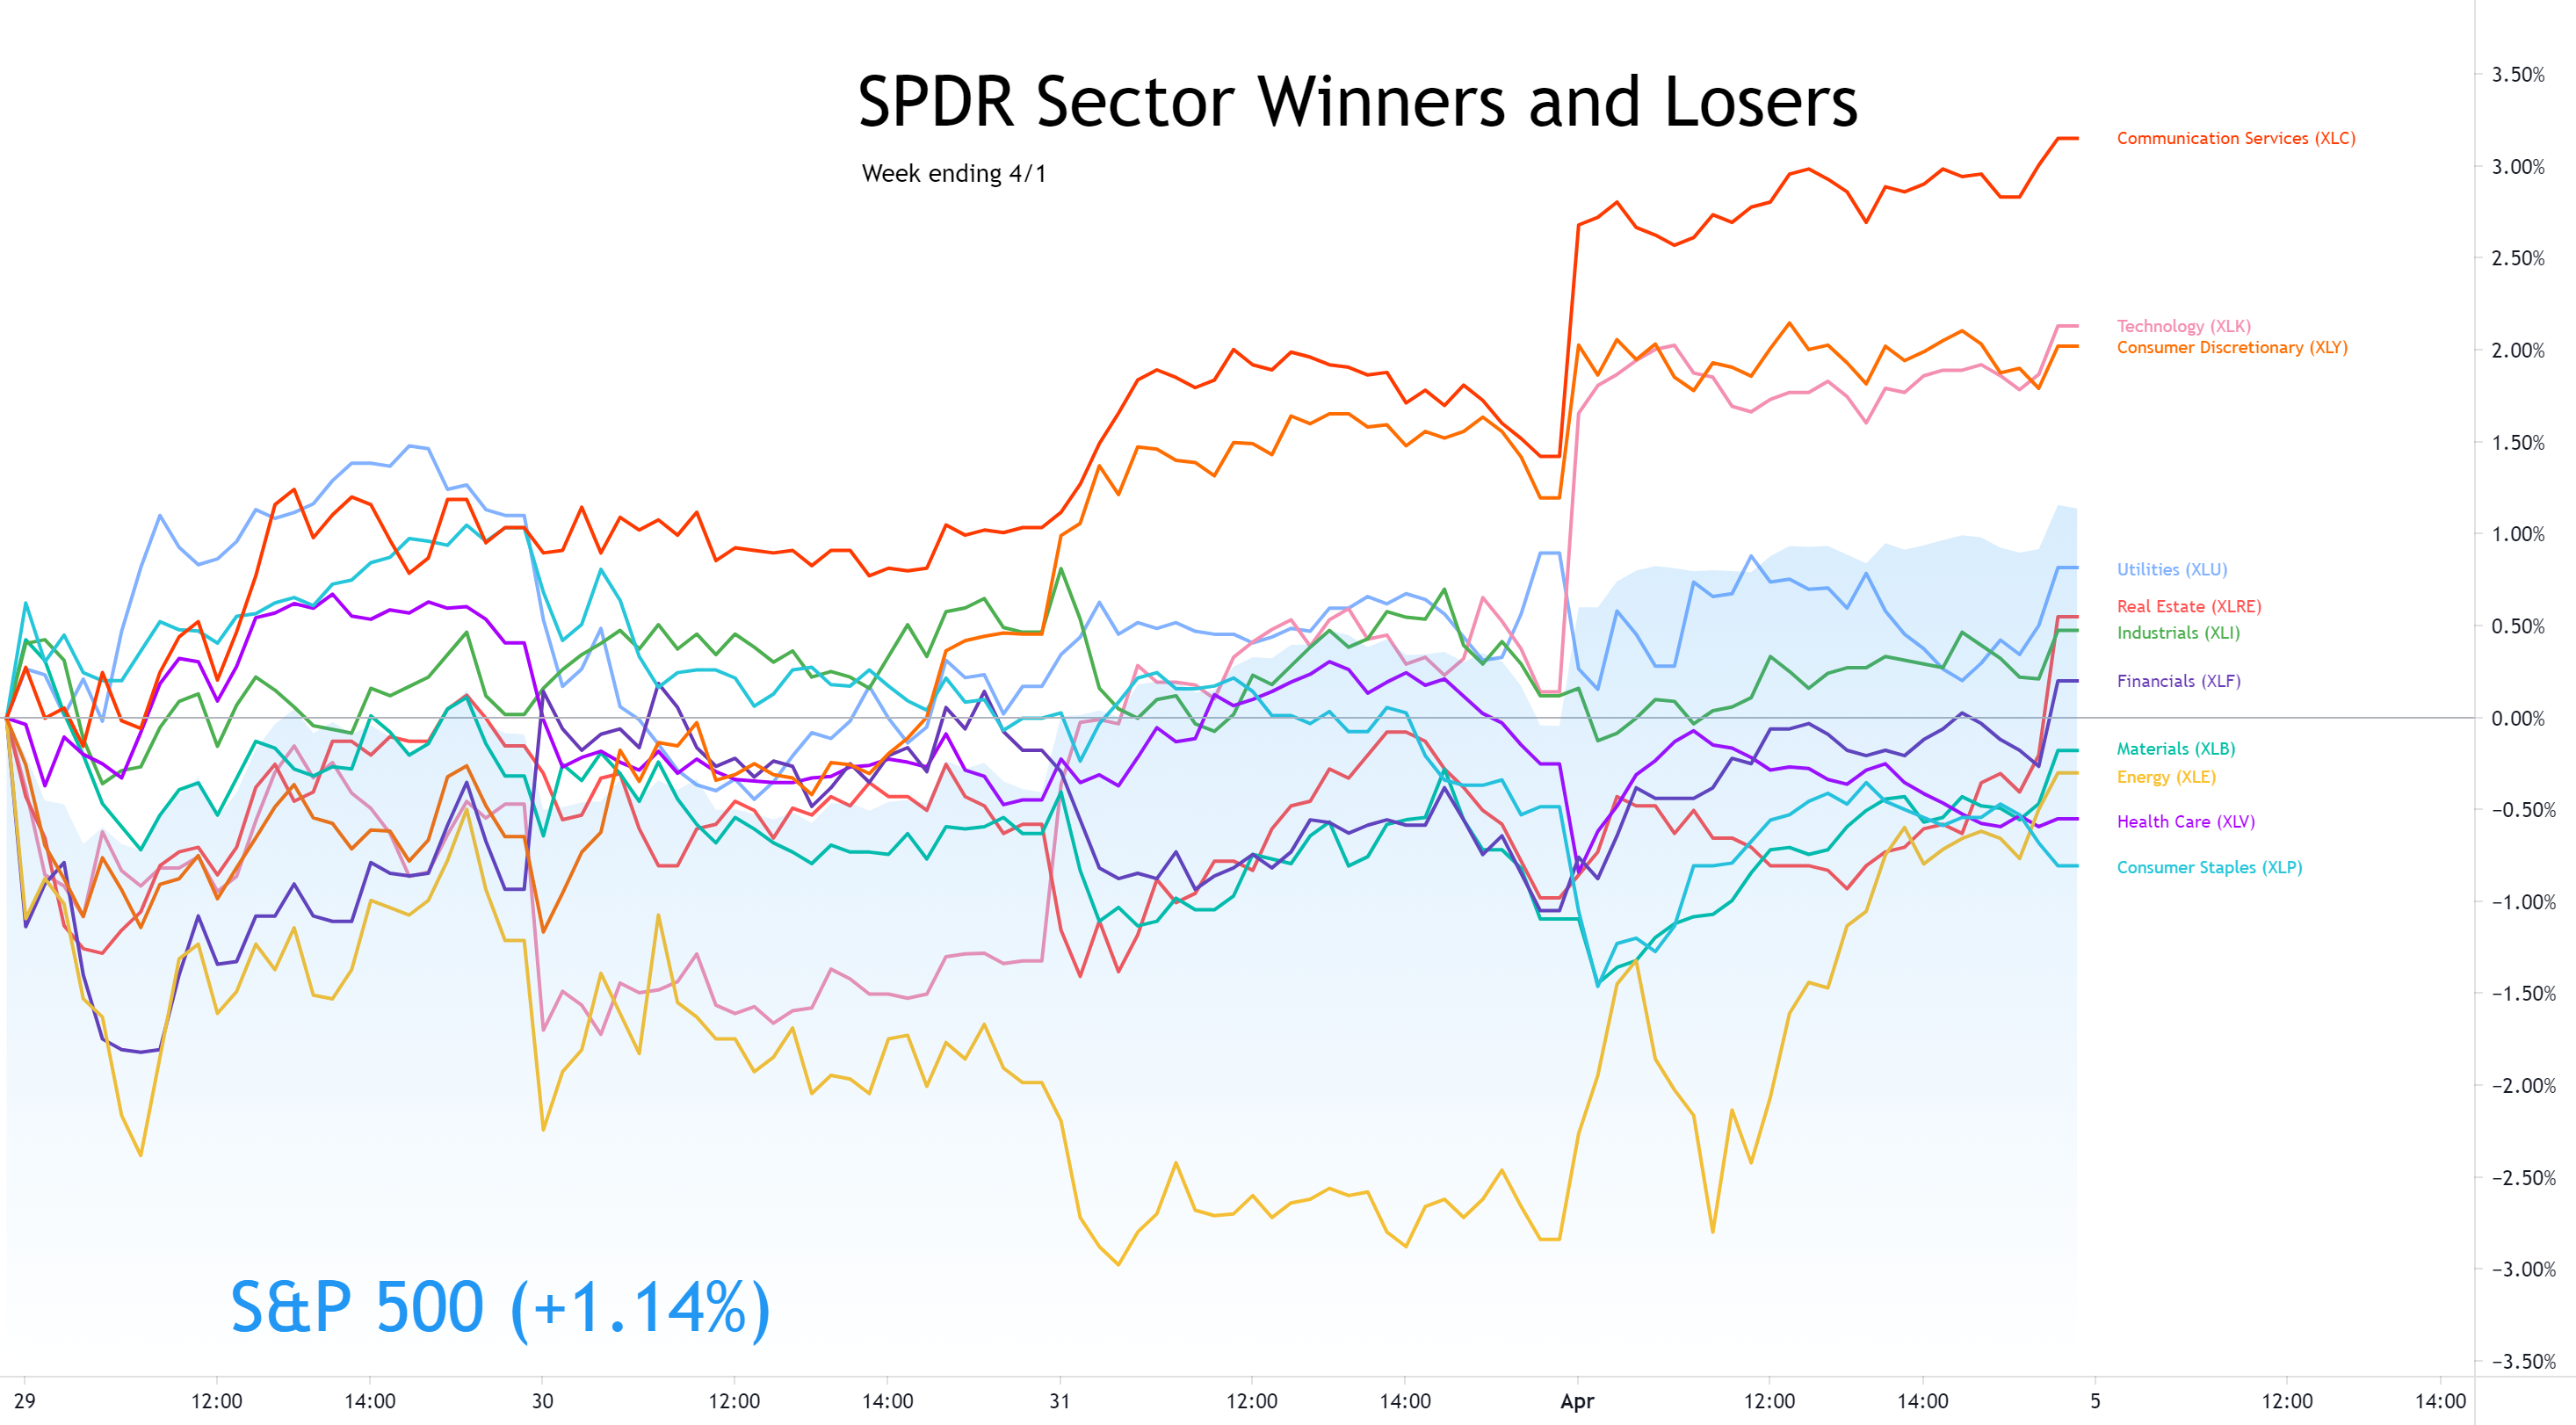
Communications ( XLC ) did not top the sector list for a single day, but it's steady gains throughout the week put it at the top of the weekly chart.
Utilities ( XLU ) started the week on top. Investors were nervous on Monday about the lasting impact of the Suez Canal blockage and whether a $20b fire sale of Archegos investments would grow or even expand to other firms. Utilities popped back into the story late on Wednesday when a sudden pop and sell-off in big tech occurred in the final hour.
Financials ( XLF ) was also impacted by the Archegos drama on Monday. By Tuesday, the damage was contained and higher treasury bond yields provided a life to the sector, making it a top performer for the day.
Technology ( XLK ) got a boost on Wednesday when Microsoft announced news of an augmented reality deal with the US Army. That spike sold off quickly, but the buyers came back in on Thursday, bringing the Technology sector up to second place for the week.
Energy ( XLE ) spent most of the week at the bottom of the list. Higher-then-expected demand for oil and gas and a generally positive outlook for economic growth brought the sector gains on Thursday that lifted it from the bottom.
Consumer Staples ( XLP ) ended the week as the worst performing sector. The rotation out of staples could continue as investors see consumers return to normal spending habits in a strengthening economic cycle .
The 30y treasury bond yield dropped for a second week while the 10y note yield remained about the same. The US 2y note yield advanced, helping the yield curve flatten a bit for the week.
High Yield Corporate Bond (HYG) prices declined for the week while Investment Grade Bond (LQD) advanced. The Investment Grade bond prices have been increased for three weeks. The spread between high yield bonds and short term treasury bonds is continuing to tighten.
The US Dollar (DXY) remained about flat at a -0.02% decline. The pause in climbing certainly helps with big multinationals, especially big tech, which are impacted by currency fluctuations.
Silver (SILVER) declined and Gold (GOLD) advanced for the week.
Crude Oil Futures (CRUDEOIL1!) advanced despite fluctuating the past few weeks over the Suez Canal drama.
Timber (WOOD) advanced.
Copper (COPPER1!) and Aluminum (ALI1!) both declined for the week.
All the commodities showed bullish moves on Friday while the entire market rallied.
-=x=-=x=-=x=-=x=-=x=-=x=-=x=-
The Big Four Mega-caps
Alphabet (GOOGL) led the Communications sector with a +5.18% gain for the week, breaking out of a base forming since mid-February. Microsoft (MSFT) also made a breakout move with a +2.48% gain for the week. Watch these two closely next week even if they are not in your portfolio. Having these breakouts stick is an important indicator for the market.
Apple (APPL) and Amazon (AMZN) both had gains of +1.48% and +3.57% respectively. They still have some work to do. Apple needs to rise above the 10w moving average line. Amazon needs to stay above both lines to keep the 10w above the 40w and show an upward trend.
-=x=-=x=-=x=-=x=-=x=-=x=-=x=-
The Four Recovery Stocks
I picked four recovery stocks to track against the indexes and other indicators in this weekly report. All of them except Exxon Mobil (XOM) had gains for the week. That's positive that investors are no longer taking from either growth or value to invest in the other. Carnival Cruise Lines (CCL) had the biggest gain with a +3.07% advance. Delta Airlines (DAL) gained +2.45% and Marriott (MAR) gained +0.99%.
-=x=-=x=-=x=-=x=-=x=-=x=-=x=-
Investor Sentiment
The put/call ratio (PCCE) spent most of the past two weeks above 0.600 but ended this week at 0.538 as investors became more bullish. A contrarian indicator, when the put/call ratio is below 0.7, it signals overly bullish sentiment and could mean an overbought market.
The CNN Fear & Greed index has also been hovering around neutral but moved back toward greed at the end of the week.
The NAAIM exposure index moved down to 52.02. Money managers were reducing positions in the market as of Wednesday when the survey is taken.
-=x=-=x=-=x=-=x=-=x=-=x=-=x=-
The Week Ahead
Monday will kick-off the week with Purchasing Managers data for March that is a leading indicator for economic activity. That data will be complemented by Factor Orders data just after market open.
The EIA Short-Term Energy Outlook will be released Tuesday morning. After the market opens, the JOLT Job Openings report for February will be released. Crude Oil Stock data will be released after market close.
Wednesday kicks- off with Export, Imports and Trade Balance data. Crude Oil Inventories will be released after market open. In the afternoon, the FOMC meeting minutes from the meeting a few weeks ago will be released.
Thursday brings the weekly Job Claims in the morning. At noon, Fed Chair Jerome Powell is scheduled to speak.
On Friday, the producer price index data will be released that gives a view into inflation. Expect the US dollar and Treasury Yields to be impacted.
There are no relevant earnings reports for the daily update next week.
-=x=-=x=-=x=-=x=-=x=-=x=-=x=-
The Bullish Side
A lot of things look great about the market at the end of this week. Thursday ended the week with gains across all major indexes. Those gains held right into the closing bell despite the three day weekend which typically moves investors into a cautious mode.
The VIX volatility index dropped to its lowest level in over a year. It closed back within the range of 2019 and early 2020 before the pandemic.
Both the Energy and Technology sectors led on Friday. Growth stocks and value stocks ended the week with gains instead of rotating between the two. Yields moving up or down seemed to have less impact on tech mega-caps and growth stocks.
The mega-caps also ended the week with solid moves upward. Alphabet and Microsoft broke out of bases which will help carry the Nasdaq to further gains. Tesla reported strong quarterly production and delivery numbers over the weekend which should help it break out on Monday.
Volume was lower for the week, but weekly volume has been elevated from the beginning of the year. As rotations subside and volatility gets under control, we should expect trading volume to get lower as investors stop chasing from one sector to the next.
The US Dollar and Treasury Yields appear to be leveling off from recent increases. That should help bring back in cautious investors who feared the dollar would rise sharply and eat into valuations of large multinationals. With the yield curve starting to flatten, there will be less worries about soaring interest rates impacting growth stocks.
-=x=-=x=-=x=-=x=-=x=-=x=-=x=-
The Bearish Side
President Biden's infrastructure package was a bit surprising for some. The package did include traditional infrastructure spend on roads, airports and the power grid. But it also included a large portion focused on new energy, broadband internet and payments to unions that will be disrupted by some of the changes.
The result is that some of the expected investment for the Industrial and Materials sectors is not there. Those sectors barely budged after the infrastructure plans were released.
The proposal also comes with a looming tax raise for corporations that is expected to cut into profits as much as 7%. If those tax proposals pass through congress, you can certainly expect the market to reprice the impacted stocks.
Although recent economic data has shown inflation under control, there is more and more buzz on the street that prices are going up at the supermarket and at the pump. Some of the traditional leading indicators of inflation may be a little slow to show the sudden surge that's expected in consumer spending. Higher numbers for the producer price indexes could bring back those fears of inflation that were impacting the markets in March.
-=x=-=x=-=x=-=x=-=x=-=x=-=x=-
Key Nasdaq Levels to Watch
The Nasdaq stayed in a channel drawn from the March 2020 bottom and broke out of the symmetrical triangle we had drawn on the chart last week. Now as resistance is met at the 13,600 level, the higher lows should squeeze the index and eventually cause a breakout above that level. That's what we will watch for this week.
On the positive side, the level we still want to reach is still 13,620.71:
I do occasionally have some errors or typos and will correct them in my blog or in the comments on TradingView. I do not have an editor and do this in my free time.
If you find this helpful, please let me know in the comments. I am also more than happy to add new perspectives and data points if you have ideas.
The structure is the following:
- A recap of the daily updates that I do here on TradingView.
- The Meaning of Life, a view on the past week
- What's coming in the next week
- The Bullish View, The Bearish View
- Key index levels to watch out for
- Wrap-up
If you have been following my daily updates, you can skip down to the “The Meaning of Life”. If not, then this first part is a great play-by-play recap for the week. Click the daily charts for more detail on sectors, indexes and market leaders each day.
-=x=-=x=-=x=-=x=-=x=-=x=-=x=-
Monday, March 29, 2021

Facts: -0.6%, Volume lower, Closing range: 52%, Body: -25%
Good: Inside day on lower volume with a slightly longer lower wick
Bad: Lower high with two intraday dips
Highs/Lows: Lower high, higher low
Candle: Red body in the middle of candle with a longer lower wick
Advance/Decline: 5 declining stocks for every advancing stock
Indexes: SPX (-0.09%), DJI (+0.30%), RUT (-2.83%), VIX (+9.97%)
Sectors: Utilities (XLU +1.07%) and Communications (XLC +1.02%) were top. Financials (XLF -0.32%) and Energy (XLE -1.19%) were bottom.
Expectation: Sideways or Higher
It was a choppy day to start the week. The intraday movement has the look of a spiral that indicates indecision in the market. That's not unexpected considering that investors had a few things to be nervous about including the re-opening of the Suez Canal and the large forced fire-sale from Archegos continuing into this week. It's also no surprise seeing the impact to the Energy and Financials sectors.
The Nasdaq closed with a -0.6% loss on lower volume for the day. The inside day has a lower high and higher low. The closing range is 0.52% which is above the 0.40% that we want to see, and the longer lower wick indicates an upward trend intraday. So despite the red body and decline for the day, there are some positives to the candle. On the other hand, there were five declining stocks for every advancing stock on the Nasdaq.
-=x=-=x=-=x=-=x=-=x=-=x=-=x=-
Tuesday, March 30, 2021

Facts: -0.11%, Volume lower, Closing range: 80%, Body: +24%
Good: Closing range of 80%, recovered from morning dip below 13,000
Bad: Lower high, lower low, trending down
Highs/Lows: Lower high, lower low
Candle: Thin green body in the upper half of the candle, longer lower wick
Advance/Decline: A bit more than one advancing stock for every declining stock
Indexes: SPX (-0.32%), DJI (-0.31%), RUT (+1.72%), VIX (-5.45%)
Sectors: Consumer Discretionary (XLY +0.98%) and Financials (XLF +0.70%) were top. Technology (XLK -0.95%) and Consumer Staples (XLP -1.07%).
Expectation: Sideways or Higher
The bond market continued to show its influence on equities today, seemingly in a battle with strong consumer confidence numbers. A pre-market spike in long-term bond yields drove the Financials sector to a gap up at open. However, the yields began to taper off even before stronger than expected consumer confidence numbers were released after market open. The strong numbers sent the Consumer Discretionary sector to the top to finish the day.
The Nasdaq never quite recovered from the morning yield scare, but did end the day in the upper range of the candle. The index closed with a -0.11% loss for the day on lower volume. The closing range of 80% is good indicator for intraday bullishness, but the 24% body and lower high means the index still has much to prove. There were 1.2 advancing stocks for every declining stock.
-=x=-=x=-=x=-=x=-=x=-=x=-=x=-
Wednesday, March 31, 2021
Facts: +1.54%, Volume higher, Closing range: 62%, Body: +60%
Good: Higher high, lower low, back above the 21d EMA
Bad: Fade at the end of the day created long upper wick
Highs/Lows: Higher high, higher low
Candle: Thick green body with n lower wick, long upper wick
Advance/Decline: More advancing stocks than declining stocks
Indexes: SPX (+0.36%), DJI (-0.26%), RUT (+1.13%), VIX (-1.07%)
Sectors: Technology (XLK +1.59%) and Consumer Discretionary (XLY +0.78%) were top. Energy (XLE -0.69%) and Financials (XLF -0.76%) were bottom.
Expectation: Sideways or Higher
The breakout that wasn't. News from Microsoft drove a mid-afternoon buying frenzy that was visible in the Microsoft intraday chart and big enough to show up in both the Nasdaq and S&P 500 charts. However, the breakout quickly faded and took the indexes with it to close away from intraday highs. Still there were good gains in the market thanks to a bullish morning on positive economic outlook with Biden's announced infrastructure plans.
The Nasdaq closed with a +1.54% gain on higher volume, and gave us the gain with higher confidence we were waiting for. The closing range of 62% is above a 60% body with no lower wick. There is a long upper wick from the dip at the end of the day. There were 1.32 advancing stocks for every declining stock.
-=x=-=x=-=x=-=x=-=x=-=x=-=x=-
Thursday, April 1, 2021
Facts: +1.76%, Volume lower, Closing range: 96% (w/ Gap), Body: +79%
Good: Rally above and stayed above 50d MA
Bad: Flat after initial rally
Highs/Lows: Higher high, higher low
Candle: Gap up, Mostly green body with barely visible upper and lower wicks.
Advance/Decline: Two advancing stocks for every declining stock
Indexes: SPX (+1.18%), DJI (+0.52%), RUT (+1.50%), VIX (-10.67%)
Sectors: Energy (XLE +2.55%) and Technology (XLK +2.01%) were top. Health (XLV -0.30%) and Consumer Staples (XLP -0.48%) were bottom.
Expectation: Sideways or Higher
Hello April and Q2! The Nasdaq leapt into the new month and quarter with a gap up and rise above the 50d moving average while the S&P 5000 closed over 4000 for the first time in history. Solid breakouts from big tech and a breadth of gains across indexes and sectors helped put strength behind the moves.
The Nasdaq closed with a +1.76% gain on lower volume. The 96% closing range includes the gap and represents a quick rise in the morning that leveled off but never gave back the gains. The 79% body includes a few tests of the 50d MA in intraday trading, but support held. There were two advancing stocks for every declining stock.
-=x=-=x=-=x=-=x=-=x=-=x=-=x=-
The Meaning of Life (View on the Week)
This week marked the end of the first quarter of 2021, a quarter of volatility driven by the retail frenzy around meme stocks, a steepening yield curve caused by inflation fears and the landing of over a trillion dollars of support to the economy.
The last few days of the quarter also had its dramas. All eyes were on the ship stuck in the Suez Canal to open the week. Investors were also shocked by a $20b fire sale of positions from Archegos family fund at the end of the previous week and beginning of this week. That nervousness brought the index down on Monday and Tuesday to test the lower line of the channel from the March 2020 bottom.
On Wednesday, Biden released his plan to boost the economic recovery through a massive multi-trillion dollar infrastructure investment. That gave the whole market a kick start for the day. Buyers came in and got the index back above the kay moving average lines with a rally on Wednesday to pass the 21d EMA and gap-up on Thursday to pass the 50d MA. The gains Thursday were shared broadly across the market with the S&P 500 (SPX) hitting the milestone of closing above 4000 for the first time.
Microsoft made its market influence known this week. On Wednesday, it released news around 3pm that the US Army had agreed to a large purchase of a customized Hololens, an augmented reality device. The news not only sent the Microsoft price soaring, but because of its oversized market cap, the move was visible in both the Nasdaq and S&P 500. The huge move, that happened within 5 minutes, sold-off for the remaining hour and brought the indexes back down.
Even with the sell-off before close on Wednesday, the message was received that big tech was back and ready to continue growth even as investors were looking to value stocks. Thursday all of the tech mega-caps had gains. Both Microsoft and Alphabet had breakouts from bases. The Nasdaq appeared to be back in the game.
The Nasdaq advanced +2.60% for the week. The closing range is 99% as the index closed near its high on Friday.
Volume was lower, but it's important to note that Nasdaq and US market volume is on a decline from higher-than-average volume in 2020 and early 2021. Comparing volume to the broader US stock market volume, Nasdaq comparatively was higher than the previous week.
We've got a higher high and a higher low, after the index tested the lower line of the channel from the March 2020 bottom. The index has resistance around 13,600 and we'll watch that closely as the higher lows squeeze into an ascending triangle.
The S&P 500 has the focus this week since it closed above 4000 after advancing +1.15%. The Russell 2000 (RUT) is attempting to regain its advance with a +1.46% gain this week. The Dow Jones Industrial average (DJI) advanced +0.52%
The VIX volatility index closed at its lowest point since before the pandemic with a -8.11% decline.
Communications ( XLC ) did not top the sector list for a single day, but it's steady gains throughout the week put it at the top of the weekly chart.
Utilities ( XLU ) started the week on top. Investors were nervous on Monday about the lasting impact of the Suez Canal blockage and whether a $20b fire sale of Archegos investments would grow or even expand to other firms. Utilities popped back into the story late on Wednesday when a sudden pop and sell-off in big tech occurred in the final hour.
Financials ( XLF ) was also impacted by the Archegos drama on Monday. By Tuesday, the damage was contained and higher treasury bond yields provided a life to the sector, making it a top performer for the day.
Technology ( XLK ) got a boost on Wednesday when Microsoft announced news of an augmented reality deal with the US Army. That spike sold off quickly, but the buyers came back in on Thursday, bringing the Technology sector up to second place for the week.
Energy ( XLE ) spent most of the week at the bottom of the list. Higher-then-expected demand for oil and gas and a generally positive outlook for economic growth brought the sector gains on Thursday that lifted it from the bottom.
Consumer Staples ( XLP ) ended the week as the worst performing sector. The rotation out of staples could continue as investors see consumers return to normal spending habits in a strengthening economic cycle .
The 30y treasury bond yield dropped for a second week while the 10y note yield remained about the same. The US 2y note yield advanced, helping the yield curve flatten a bit for the week.
High Yield Corporate Bond (HYG) prices declined for the week while Investment Grade Bond (LQD) advanced. The Investment Grade bond prices have been increased for three weeks. The spread between high yield bonds and short term treasury bonds is continuing to tighten.
The US Dollar (DXY) remained about flat at a -0.02% decline. The pause in climbing certainly helps with big multinationals, especially big tech, which are impacted by currency fluctuations.
Silver (SILVER) declined and Gold (GOLD) advanced for the week.
Crude Oil Futures (CRUDEOIL1!) advanced despite fluctuating the past few weeks over the Suez Canal drama.
Timber (WOOD) advanced.
Copper (COPPER1!) and Aluminum (ALI1!) both declined for the week.
All the commodities showed bullish moves on Friday while the entire market rallied.
-=x=-=x=-=x=-=x=-=x=-=x=-=x=-
The Big Four Mega-caps
Alphabet (GOOGL) led the Communications sector with a +5.18% gain for the week, breaking out of a base forming since mid-February. Microsoft (MSFT) also made a breakout move with a +2.48% gain for the week. Watch these two closely next week even if they are not in your portfolio. Having these breakouts stick is an important indicator for the market.
Apple (APPL) and Amazon (AMZN) both had gains of +1.48% and +3.57% respectively. They still have some work to do. Apple needs to rise above the 10w moving average line. Amazon needs to stay above both lines to keep the 10w above the 40w and show an upward trend.
-=x=-=x=-=x=-=x=-=x=-=x=-=x=-
The Four Recovery Stocks
I picked four recovery stocks to track against the indexes and other indicators in this weekly report. All of them except Exxon Mobil (XOM) had gains for the week. That's positive that investors are no longer taking from either growth or value to invest in the other. Carnival Cruise Lines (CCL) had the biggest gain with a +3.07% advance. Delta Airlines (DAL) gained +2.45% and Marriott (MAR) gained +0.99%.
-=x=-=x=-=x=-=x=-=x=-=x=-=x=-
Investor Sentiment
The put/call ratio (PCCE) spent most of the past two weeks above 0.600 but ended this week at 0.538 as investors became more bullish. A contrarian indicator, when the put/call ratio is below 0.7, it signals overly bullish sentiment and could mean an overbought market.
The CNN Fear & Greed index has also been hovering around neutral but moved back toward greed at the end of the week.
The NAAIM exposure index moved down to 52.02. Money managers were reducing positions in the market as of Wednesday when the survey is taken.
-=x=-=x=-=x=-=x=-=x=-=x=-=x=-
The Week Ahead
Monday will kick-off the week with Purchasing Managers data for March that is a leading indicator for economic activity. That data will be complemented by Factor Orders data just after market open.
The EIA Short-Term Energy Outlook will be released Tuesday morning. After the market opens, the JOLT Job Openings report for February will be released. Crude Oil Stock data will be released after market close.
Wednesday kicks- off with Export, Imports and Trade Balance data. Crude Oil Inventories will be released after market open. In the afternoon, the FOMC meeting minutes from the meeting a few weeks ago will be released.
Thursday brings the weekly Job Claims in the morning. At noon, Fed Chair Jerome Powell is scheduled to speak.
On Friday, the producer price index data will be released that gives a view into inflation. Expect the US dollar and Treasury Yields to be impacted.
There are no relevant earnings reports for the daily update next week.
-=x=-=x=-=x=-=x=-=x=-=x=-=x=-
The Bullish Side
A lot of things look great about the market at the end of this week. Thursday ended the week with gains across all major indexes. Those gains held right into the closing bell despite the three day weekend which typically moves investors into a cautious mode.
The VIX volatility index dropped to its lowest level in over a year. It closed back within the range of 2019 and early 2020 before the pandemic.
Both the Energy and Technology sectors led on Friday. Growth stocks and value stocks ended the week with gains instead of rotating between the two. Yields moving up or down seemed to have less impact on tech mega-caps and growth stocks.
The mega-caps also ended the week with solid moves upward. Alphabet and Microsoft broke out of bases which will help carry the Nasdaq to further gains. Tesla reported strong quarterly production and delivery numbers over the weekend which should help it break out on Monday.
Volume was lower for the week, but weekly volume has been elevated from the beginning of the year. As rotations subside and volatility gets under control, we should expect trading volume to get lower as investors stop chasing from one sector to the next.
The US Dollar and Treasury Yields appear to be leveling off from recent increases. That should help bring back in cautious investors who feared the dollar would rise sharply and eat into valuations of large multinationals. With the yield curve starting to flatten, there will be less worries about soaring interest rates impacting growth stocks.
-=x=-=x=-=x=-=x=-=x=-=x=-=x=-
The Bearish Side
President Biden's infrastructure package was a bit surprising for some. The package did include traditional infrastructure spend on roads, airports and the power grid. But it also included a large portion focused on new energy, broadband internet and payments to unions that will be disrupted by some of the changes.
The result is that some of the expected investment for the Industrial and Materials sectors is not there. Those sectors barely budged after the infrastructure plans were released.
The proposal also comes with a looming tax raise for corporations that is expected to cut into profits as much as 7%. If those tax proposals pass through congress, you can certainly expect the market to reprice the impacted stocks.
Although recent economic data has shown inflation under control, there is more and more buzz on the street that prices are going up at the supermarket and at the pump. Some of the traditional leading indicators of inflation may be a little slow to show the sudden surge that's expected in consumer spending. Higher numbers for the producer price indexes could bring back those fears of inflation that were impacting the markets in March.
-=x=-=x=-=x=-=x=-=x=-=x=-=x=-
Key Nasdaq Levels to Watch
The Nasdaq stayed in a channel drawn from the March 2020 bottom and broke out of the symmetrical triangle we had drawn on the chart last week. Now as resistance is met at the 13,600 level, the higher lows should squeeze the index and eventually cause a breakout above that level. That's what we will watch for this week.
On the positive side, the level we still want to reach is still 13,620.71:
- The index closed the week very close to its high of 13,487.08. Set a new high for next week to keep the uptrend going.
- The next line is 13,620.71 which is the high from three weeks ago. But it is also past the area of resistance that the index was rejected on 1/26, 3/2, and 3/16.
- 14,000 will be the next area of resistance.
- The all-time high is at 14,175.12. That might be a stretch to get there this week, but keep it in our sites.
On the downside, there are several levels to watch:
- The 50d moving average is at 13,427.76.
- The 21d exponential moving average is at 13,234.87. Both moving average lanes are key support lines.
- The lower line of the channel from the March 2020 bottom is around 13,005 for next week.
- 13,000 has been an area of support on 1/29, 2/23, 3/3. The index moved below that support area again this week, but was able to rise back above it and rally.
- The low of this past week is 12,922.57. Stay above that price to give us a higher low for this week.
-=x=-=x=-=x=-=x=-=x=-=x=-=x=-
Wrap-up
There were a lot of positive signs by the time this short week of trading closed. But the indexes and indicators here are only one input to the investors outlook.
Look at your portfolio or watch lists and see how stocks are acting. Are they breaking out of bases and are the break outs sticking? Or are breakouts failing with prices falling back into the base?
How your focus stocks perform will be the final indicator of whether to increase exposure.
Good luck, stay healthy and trade safe!