"Gold Analysis: Consolidation Breakout Signals Strong Uptrend"
Technical Analysis - Gold (XAU/USD) - 1H Timeframe
🔹 Market Structure Overview
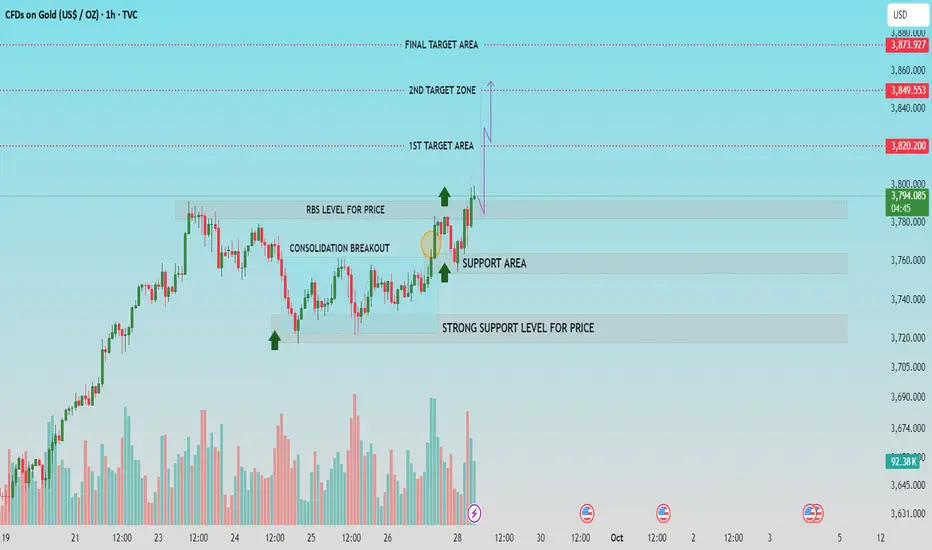
Gold has resumed its upward trend after a consolidation breakout, as shown in the middle of the chart. The breakout is supported by increased bullish volume, indicating strong buying interest.
Price is currently trading at $3,796, moving towards the defined target zones, with a clean bullish structure of higher highs and higher lows.
🔍 Key Technical Levels
🔼 Resistance & Target Zones:
▪1st Target Area: $3,820
▫Closely aligned with previous short-term resistance. A minor consolidation may occur here before continuation.
▪2nd Target Zone: $3,850
▫A more significant resistance level, where sellers may re-enter. Monitor for reversal patterns or a breakout confirmation.
▪Final Target Area: $3,873 - $3,880
* Represents a potential exhaustion point for the current bullish leg. Price action here will determine if a larger breakout or retracement follows.
🟩 Support Levels:
▪RBS Level (Resistance Becomes Support): Around $3,780
▫Price has flipped this level into support after breaking above - a classic retest confirming strength.
▪Support Area: $3,760 - $3,780
▫Recent bullish reactions from this area make it a short-term demand zone.
▪Strong Support Level: $3,720
▫ Historically significant level with multiple bounce points. A break below this would invalidate the current bullish setup.
📊 Volume Analysis
▫ Notable volume spike occurred at the breakout point of the consolidation range (highlighted circle), validating bullish momentum.
▫Sustained volume during the upward move suggests strong institutional interest.
📈 Price Action Insights
▪ Consolidation Breakout: After a period of sideways movement, price broke above the consolidation range, suggesting accumulation and a bullish continuation.
▪Bullish Retest: The market performed a clean retest of the breakout zone, confirming buyer control.
▪Steady Climb: No major rejection wicks or bearish engulfing candles observed - market sentiment remains positive.
🔄 Projected Price Movement
The purple projection arrow shows an expected bullish continuation toward:
1. $3,820 (1st Target)
2. $3,850 (2nd Target)
3. $3,873–$3,880 (Final Target Area)
If price pulls back, watch for support at $3,780 and $3,760 to hold. A breakdown below $3,720 would indicate a shift in momentum.
✅ Conclusion
Gold is showing a technically strong bullish continuation pattern after breaking a key consolidation zone. As long as price remains above the $3,780-$3,760 support zone, the trend favors buyers targeting $3,820, $3,850, and potentially $3,873+.
Traders may consider entering on retracements with stop-losses below the $3,760 zone, targeting the upper resistance levels.
Support Me For More Insightful Analysis.
🔹 Market Structure Overview
Gold has resumed its upward trend after a consolidation breakout, as shown in the middle of the chart. The breakout is supported by increased bullish volume, indicating strong buying interest.
Price is currently trading at $3,796, moving towards the defined target zones, with a clean bullish structure of higher highs and higher lows.
🔍 Key Technical Levels
🔼 Resistance & Target Zones:
▪1st Target Area: $3,820
▫Closely aligned with previous short-term resistance. A minor consolidation may occur here before continuation.
▪2nd Target Zone: $3,850
▫A more significant resistance level, where sellers may re-enter. Monitor for reversal patterns or a breakout confirmation.
▪Final Target Area: $3,873 - $3,880
* Represents a potential exhaustion point for the current bullish leg. Price action here will determine if a larger breakout or retracement follows.
🟩 Support Levels:
▪RBS Level (Resistance Becomes Support): Around $3,780
▫Price has flipped this level into support after breaking above - a classic retest confirming strength.
▪Support Area: $3,760 - $3,780
▫Recent bullish reactions from this area make it a short-term demand zone.
▪Strong Support Level: $3,720
▫ Historically significant level with multiple bounce points. A break below this would invalidate the current bullish setup.
📊 Volume Analysis
▫ Notable volume spike occurred at the breakout point of the consolidation range (highlighted circle), validating bullish momentum.
▫Sustained volume during the upward move suggests strong institutional interest.
📈 Price Action Insights
▪ Consolidation Breakout: After a period of sideways movement, price broke above the consolidation range, suggesting accumulation and a bullish continuation.
▪Bullish Retest: The market performed a clean retest of the breakout zone, confirming buyer control.
▪Steady Climb: No major rejection wicks or bearish engulfing candles observed - market sentiment remains positive.
🔄 Projected Price Movement
The purple projection arrow shows an expected bullish continuation toward:
1. $3,820 (1st Target)
2. $3,850 (2nd Target)
3. $3,873–$3,880 (Final Target Area)
If price pulls back, watch for support at $3,780 and $3,760 to hold. A breakdown below $3,720 would indicate a shift in momentum.
✅ Conclusion
Gold is showing a technically strong bullish continuation pattern after breaking a key consolidation zone. As long as price remains above the $3,780-$3,760 support zone, the trend favors buyers targeting $3,820, $3,850, and potentially $3,873+.
Traders may consider entering on retracements with stop-losses below the $3,760 zone, targeting the upper resistance levels.
Support Me For More Insightful Analysis.
Catatan
1st layer activated from 3791, Trade aktif
Catatan
1st target achieved, 300 pips+Catatan
2nd target reached, 590 pips+Trading ditutup: target tercapai
800 pips+ achieved, 💸FREE FOREX Signals in Telegram : t.me/FxInsightsHub0
🔹Join Our Telegram Channel, Pure Price Action Based Signals With Chart Analysis.
t.me/FxInsightsHub0
🚀FREE CRYPTO Signals In Telegram: t.me/FxInsightsHub0
🔹Join Our Telegram Channel, Pure Price Action Based Signals With Chart Analysis.
t.me/FxInsightsHub0
🚀FREE CRYPTO Signals In Telegram: t.me/FxInsightsHub0
Publikasi terkait
Pernyataan Penyangkalan
Informasi dan publikasi tidak dimaksudkan untuk menjadi, dan bukan merupakan saran keuangan, investasi, perdagangan, atau rekomendasi lainnya yang diberikan atau didukung oleh TradingView. Baca selengkapnya di Persyaratan Penggunaan.
💸FREE FOREX Signals in Telegram : t.me/FxInsightsHub0
🔹Join Our Telegram Channel, Pure Price Action Based Signals With Chart Analysis.
t.me/FxInsightsHub0
🚀FREE CRYPTO Signals In Telegram: t.me/FxInsightsHub0
🔹Join Our Telegram Channel, Pure Price Action Based Signals With Chart Analysis.
t.me/FxInsightsHub0
🚀FREE CRYPTO Signals In Telegram: t.me/FxInsightsHub0
Publikasi terkait
Pernyataan Penyangkalan
Informasi dan publikasi tidak dimaksudkan untuk menjadi, dan bukan merupakan saran keuangan, investasi, perdagangan, atau rekomendasi lainnya yang diberikan atau didukung oleh TradingView. Baca selengkapnya di Persyaratan Penggunaan.