"High-Probability Gold Setups: Levels, Volume & Entry Ideas"
🔹 Technical Analysis Of XAUUSD
▪Current Market Overview
* Current Price: $3,743.84
* Trend Bias: Bullish
* Volume: Increasing during bullish breaks, confirming buying strength.
* Gold has recently broken out of a consolidation range and is forming higher highs and higher lows, indicating strong bullish momentum.
🔍 Key Technical Levels
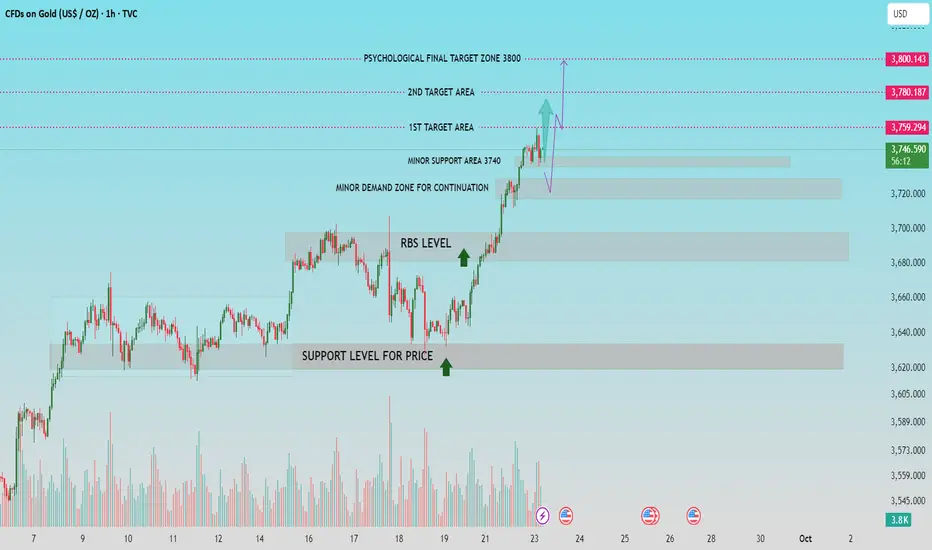
✅ Support Zones (Buyers' Areas)
1. Minor Support Area – $3,740
* Recently formed after the breakout.
* Acts as immediate support and potential entry zone for buyers on retracement.
2. Minor Demand Zone – $3,720 to $3,700
* This area is crucial for continuation.
* If the price dips, a bounce from here confirms strong buyer interest.
3. RBS Level (Resistance Became Support) – $3,700
* A textbook RBS flip — resistance now turned support.
* Historically a zone where sellers lost control and buyers took over.
4. Major Support Zone – Around $3,640
* Strong base area, previous accumulation zone.
* If price drops here, it would be a deeper retracement but still within an uptrend context.
🎯 Target Zones (Resistance/Profit Areas)
1. 1st Target Area – $3,759
* Very close to the current price.
* Could act as a short-term barrier; minor rejection is possible.
2. 2nd Target Area – $3,780
* Key resistance zone, price could consolidate or react here.
* Consider partial profit booking if already in a long position.
3. Psychological Final Target – $3,800
* A strong psychological barrier.
* Often used by institutional traders for final targets.
* Break above this level may trigger a larger rally.
🧭 Trading Outlook & Scenarios
🟢 Bullish Scenario:
* If price holds above $3,740 and maintains structure:
* Expect continuation towards $3,759 → $3,780 → $3,800.
* Ideal entry on pullback to $3,740 or deeper into $3,720 zone, with tight stop below $3,700.
🔴 Bearish/Correction Scenario:
* If price fails to hold $3,740 and breaks below $3,700:
* Could initiate deeper correction toward $3,640.
* Would signal a short-term trend shift or consolidation phase.
📌 Volume Analysis
* Rising volume supports the breakout above resistance levels.
* Watch for volume drop near resistance — it could signal exhaustion.
⚠ Risk Management Note
* Avoid chasing price near resistance zones.
* Look for price confirmation at support zones for entry.
* Always use stop-loss below recent structure lows (e.g., below $3,700 or $3,640 depending on entry zone).
If this helpful for you, press the like button.
▪Current Market Overview
* Current Price: $3,743.84
* Trend Bias: Bullish
* Volume: Increasing during bullish breaks, confirming buying strength.
* Gold has recently broken out of a consolidation range and is forming higher highs and higher lows, indicating strong bullish momentum.
🔍 Key Technical Levels
✅ Support Zones (Buyers' Areas)
1. Minor Support Area – $3,740
* Recently formed after the breakout.
* Acts as immediate support and potential entry zone for buyers on retracement.
2. Minor Demand Zone – $3,720 to $3,700
* This area is crucial for continuation.
* If the price dips, a bounce from here confirms strong buyer interest.
3. RBS Level (Resistance Became Support) – $3,700
* A textbook RBS flip — resistance now turned support.
* Historically a zone where sellers lost control and buyers took over.
4. Major Support Zone – Around $3,640
* Strong base area, previous accumulation zone.
* If price drops here, it would be a deeper retracement but still within an uptrend context.
🎯 Target Zones (Resistance/Profit Areas)
1. 1st Target Area – $3,759
* Very close to the current price.
* Could act as a short-term barrier; minor rejection is possible.
2. 2nd Target Area – $3,780
* Key resistance zone, price could consolidate or react here.
* Consider partial profit booking if already in a long position.
3. Psychological Final Target – $3,800
* A strong psychological barrier.
* Often used by institutional traders for final targets.
* Break above this level may trigger a larger rally.
🧭 Trading Outlook & Scenarios
🟢 Bullish Scenario:
* If price holds above $3,740 and maintains structure:
* Expect continuation towards $3,759 → $3,780 → $3,800.
* Ideal entry on pullback to $3,740 or deeper into $3,720 zone, with tight stop below $3,700.
🔴 Bearish/Correction Scenario:
* If price fails to hold $3,740 and breaks below $3,700:
* Could initiate deeper correction toward $3,640.
* Would signal a short-term trend shift or consolidation phase.
📌 Volume Analysis
* Rising volume supports the breakout above resistance levels.
* Watch for volume drop near resistance — it could signal exhaustion.
⚠ Risk Management Note
* Avoid chasing price near resistance zones.
* Look for price confirmation at support zones for entry.
* Always use stop-loss below recent structure lows (e.g., below $3,700 or $3,640 depending on entry zone).
If this helpful for you, press the like button.
Trade aktif
Catatan
from minor support level 3740,Catatan
1st target achieved, 200 pips+ Catatan
2nd target achieved, 3780, 400 pips+Catatan
Catatan
price gave respect to minor demand zone, 400 pips+ secured.Trading ditutup: target tercapai
800 pips+ achieved from minor demand zone 💸FREE FOREX Signals in Telegram : t.me/FxInsightsHub0
🔹Join Our Telegram Channel, Pure Price Action Based Signals With Chart Analysis.
t.me/FxInsightsHub0
🚀FREE CRYPTO Signals In Telegram: t.me/FxInsightsHub0
🔹Join Our Telegram Channel, Pure Price Action Based Signals With Chart Analysis.
t.me/FxInsightsHub0
🚀FREE CRYPTO Signals In Telegram: t.me/FxInsightsHub0
Publikasi terkait
Pernyataan Penyangkalan
Informasi dan publikasi tidak dimaksudkan untuk menjadi, dan bukan merupakan saran keuangan, investasi, perdagangan, atau rekomendasi lainnya yang diberikan atau didukung oleh TradingView. Baca selengkapnya di Persyaratan Penggunaan.
💸FREE FOREX Signals in Telegram : t.me/FxInsightsHub0
🔹Join Our Telegram Channel, Pure Price Action Based Signals With Chart Analysis.
t.me/FxInsightsHub0
🚀FREE CRYPTO Signals In Telegram: t.me/FxInsightsHub0
🔹Join Our Telegram Channel, Pure Price Action Based Signals With Chart Analysis.
t.me/FxInsightsHub0
🚀FREE CRYPTO Signals In Telegram: t.me/FxInsightsHub0
Publikasi terkait
Pernyataan Penyangkalan
Informasi dan publikasi tidak dimaksudkan untuk menjadi, dan bukan merupakan saran keuangan, investasi, perdagangan, atau rekomendasi lainnya yang diberikan atau didukung oleh TradingView. Baca selengkapnya di Persyaratan Penggunaan.