🔹 EUR/CHF Technical Analysis (1H Chart)
1. Current Market Structure
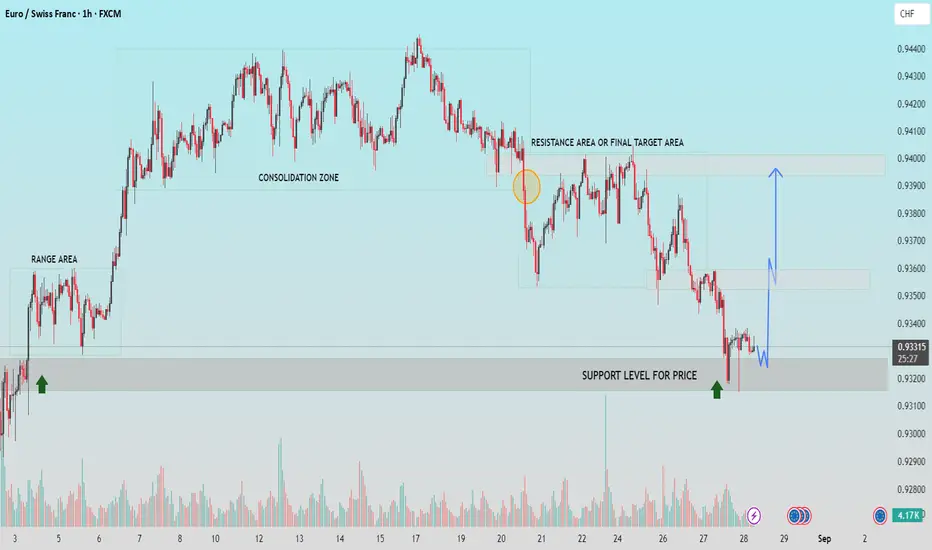
Price is consolidating near 0.9330 after a recent bearish move. The pair has tested the support level at 0.9320 – 0.9330, which has acted as a strong demand zone in previous sessions. Buyers have stepped in here multiple times, suggesting potential bullish interest.
2. Key Support Zone
Level: 0.9320 – 0.9330
This zone is critical for bulls to maintain control. If the price holds above this level, we could expect a bullish reversal. A breakdown below it, however, would indicate weakness and open the door for further downside.
3. Immediate Resistance Levels
* First Resistance: 0.9360
This is the initial barrier that price must break to confirm bullish momentum.
* Major Resistance (Final Target Area): 0.9390 – 0.9400
This is the top of the previous consolidation range and a strong supply zone where sellers are likely to re-enter the market.
4. Potential Scenarios
* Bullish Scenario: If price holds above 0.9330 and breaks 0.9360, expect a move toward 0.9390 – 0.9400.
* Bearish Scenario: A clear break below 0.9320 could push the pair lower toward the next demand zone.
5. Market Outlook & Bias
* Bias: Short-term bullish above 0.9330, targeting 0.9360 and then 0.9400.
* Invalidation: Break below 0.9320.
If this helpful for you, press the like button.
1. Current Market Structure
Price is consolidating near 0.9330 after a recent bearish move. The pair has tested the support level at 0.9320 – 0.9330, which has acted as a strong demand zone in previous sessions. Buyers have stepped in here multiple times, suggesting potential bullish interest.
2. Key Support Zone
Level: 0.9320 – 0.9330
This zone is critical for bulls to maintain control. If the price holds above this level, we could expect a bullish reversal. A breakdown below it, however, would indicate weakness and open the door for further downside.
3. Immediate Resistance Levels
* First Resistance: 0.9360
This is the initial barrier that price must break to confirm bullish momentum.
* Major Resistance (Final Target Area): 0.9390 – 0.9400
This is the top of the previous consolidation range and a strong supply zone where sellers are likely to re-enter the market.
4. Potential Scenarios
* Bullish Scenario: If price holds above 0.9330 and breaks 0.9360, expect a move toward 0.9390 – 0.9400.
* Bearish Scenario: A clear break below 0.9320 could push the pair lower toward the next demand zone.
5. Market Outlook & Bias
* Bias: Short-term bullish above 0.9330, targeting 0.9360 and then 0.9400.
* Invalidation: Break below 0.9320.
If this helpful for you, press the like button.
Trade aktif
Catatan
1st target hit, set BE Trading ditutup: target tercapai
💸FREE FOREX Signals in Telegram : t.me/FxInsightsHub0
🔹Join Our Telegram Channel, Pure Price Action Based Signals With Chart Analysis.
t.me/FxInsightsHub0
🚀FREE CRYPTO Signals In Telegram: t.me/FxInsightsHub0
🔹Join Our Telegram Channel, Pure Price Action Based Signals With Chart Analysis.
t.me/FxInsightsHub0
🚀FREE CRYPTO Signals In Telegram: t.me/FxInsightsHub0
Publikasi terkait
Pernyataan Penyangkalan
Informasi dan publikasi tidak dimaksudkan untuk menjadi, dan bukan merupakan saran keuangan, investasi, perdagangan, atau rekomendasi lainnya yang diberikan atau didukung oleh TradingView. Baca selengkapnya di Persyaratan Penggunaan.