A “long-legged” doji is a far more dramatic candle. It says that prices moved far higher on the day, but then profit taking kicked in.
Typically, a very large upper shadow is left. A close below the midpoint of the candle shows a lot of weakness.
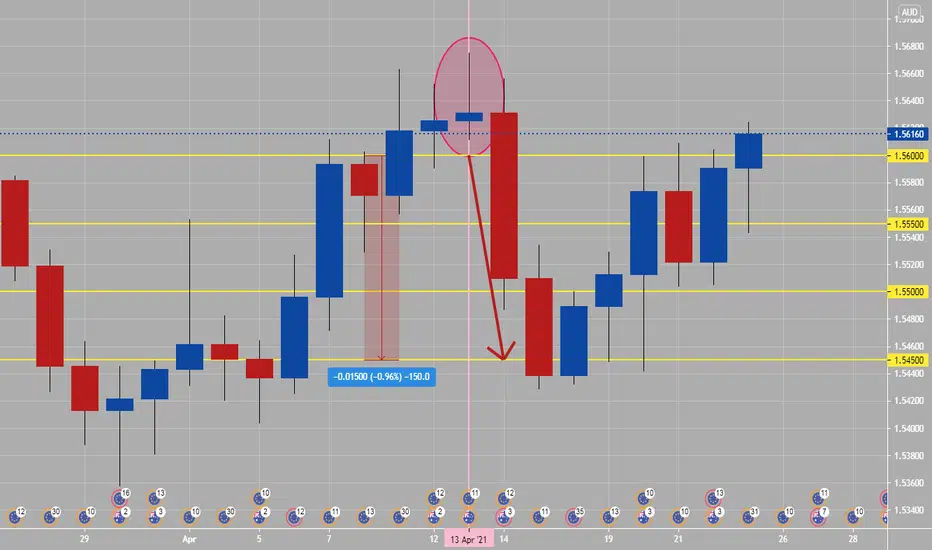
Here’s an example of a long-legged doji on attached chart (inside of oval circle). Daily candlesticks and patterns are more important then lower time frame ones, related to having one whole days of price action inside of them.
Monday and Tuesday daily candlesticks mostly will set high or low of the week, which rest of week trend will break out or come out of. The noted long legged doji occurred on a Tuesday, then rest of week was sell or bearish.
Typically, a very large upper shadow is left. A close below the midpoint of the candle shows a lot of weakness.
Here’s an example of a long-legged doji on attached chart (inside of oval circle). Daily candlesticks and patterns are more important then lower time frame ones, related to having one whole days of price action inside of them.
Monday and Tuesday daily candlesticks mostly will set high or low of the week, which rest of week trend will break out or come out of. The noted long legged doji occurred on a Tuesday, then rest of week was sell or bearish.
Pernyataan Penyangkalan
Informasi dan publikasi ini tidak dimaksudkan, dan bukan merupakan, saran atau rekomendasi keuangan, investasi, trading, atau jenis lainnya yang diberikan atau didukung oleh TradingView. Baca selengkapnya di Ketentuan Penggunaan.
Pernyataan Penyangkalan
Informasi dan publikasi ini tidak dimaksudkan, dan bukan merupakan, saran atau rekomendasi keuangan, investasi, trading, atau jenis lainnya yang diberikan atau didukung oleh TradingView. Baca selengkapnya di Ketentuan Penggunaan.