BPCL | FVG + Fibonacci COnfluence | Long Setup toward 378
💬 Description:
Chart Type: 1D (Daily)
Stock: BPCL – Bharat Petroleum Corporation Ltd.
🧩 Setup Overview
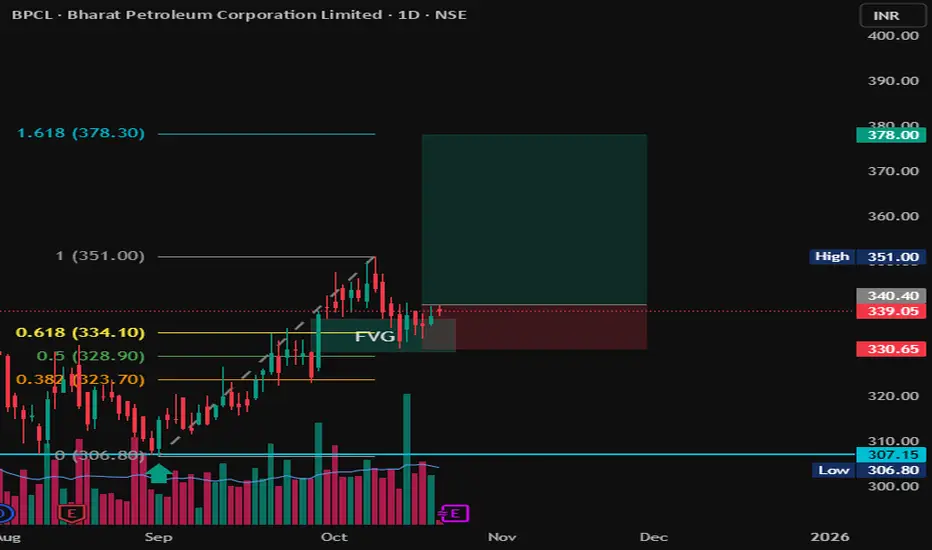
BPCL has completed a clean retracement into a Fair Value Gap (FVG) aligning with the 0.5–0.618 Fibonacci retracement zone from the previous upswing (306 → 351).
The zone around ₹334–₹340 acted as strong demand support, hinting at a possible continuation leg to the upside.
📊 Trade Plan
Entry Zone: ₹338–₹340
Stop Loss: ₹330
Target 1: ₹351
Target 2: ₹378 (1.618 Fib Extension)
Risk–Reward Ratio: ~1:3
📈 Technical Confluence
✅ FVG + 0.618 Fib alignment
✅ Retest & bounce confirmation
✅ Volume showing accumulation
✅ Clear higher-low structure maintained
🚨 Invalidation
Setup invalid if price closes below ₹330, which would break FVG and shift structure to bearish.
🧠 Bias: Bullish continuation
Time Horizon: Swing (2–4 weeks)
Chart Type: 1D (Daily)
Stock: BPCL – Bharat Petroleum Corporation Ltd.
🧩 Setup Overview
BPCL has completed a clean retracement into a Fair Value Gap (FVG) aligning with the 0.5–0.618 Fibonacci retracement zone from the previous upswing (306 → 351).
The zone around ₹334–₹340 acted as strong demand support, hinting at a possible continuation leg to the upside.
📊 Trade Plan
Entry Zone: ₹338–₹340
Stop Loss: ₹330
Target 1: ₹351
Target 2: ₹378 (1.618 Fib Extension)
Risk–Reward Ratio: ~1:3
📈 Technical Confluence
✅ FVG + 0.618 Fib alignment
✅ Retest & bounce confirmation
✅ Volume showing accumulation
✅ Clear higher-low structure maintained
🚨 Invalidation
Setup invalid if price closes below ₹330, which would break FVG and shift structure to bearish.
🧠 Bias: Bullish continuation
Time Horizon: Swing (2–4 weeks)
Trade aktif
Trade activePernyataan Penyangkalan
Informasi dan publikasi ini tidak dimaksudkan, dan bukan merupakan, saran atau rekomendasi keuangan, investasi, trading, atau jenis lainnya yang diberikan atau didukung oleh TradingView. Baca selengkapnya di Ketentuan Penggunaan.
Pernyataan Penyangkalan
Informasi dan publikasi ini tidak dimaksudkan, dan bukan merupakan, saran atau rekomendasi keuangan, investasi, trading, atau jenis lainnya yang diberikan atau didukung oleh TradingView. Baca selengkapnya di Ketentuan Penggunaan.