[RS]RSI Divergence V5 Thank You Richard Santos!!!
This is a great indicator guys.Its good for measuring divergence in an objective way.
The idea is to measure the high to high and the low to low (stock vs. indicator) with the low to high and high to low (stock vs. indicator). This is the basis of divergence.
I love this one.
I would also add you can draw angles on the indicator and the stocks. All in all a great indicator.
Richard Santos was nice enough to modify one of his scripts for this one. Credit goes to him.
You can also use this for measuring volatility when the lines narrow or widen.
X-indicator

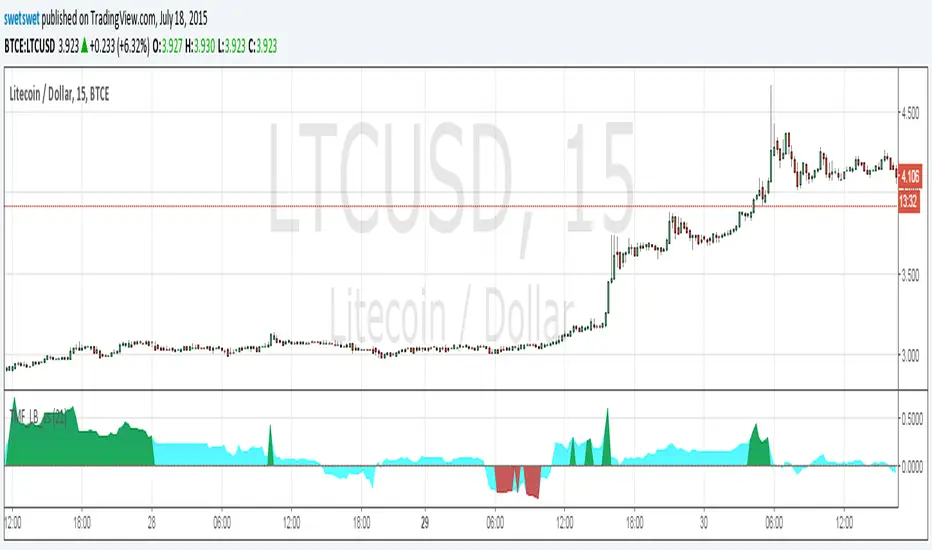
Twiggs Money Flow_LB [SwetSwet]The modified indicator Twiggs Money Flow more convenient. The critical value is colored in green or red.
Pip Foundry - BitMEX BVOL7D IndexMy premium indicators are available for monthly lease at www.tradingview.com
A quick indicator in response to the product released this month from BitMEX - a Weekly settled volatility index for bitcoin!
www.bitmex.com
uses BVOL calculation from www.bitmex.com

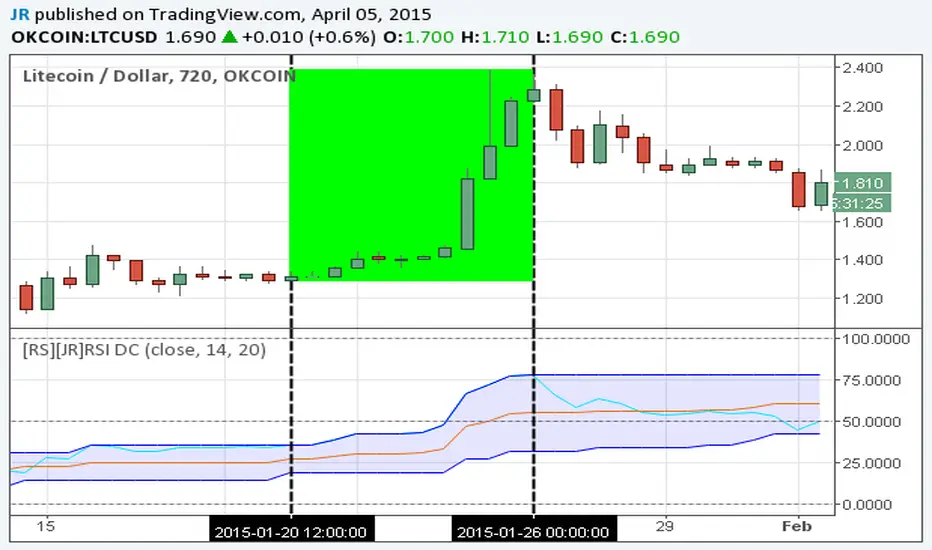
[RS][JR]RSI Donchian ChannelsRSI Donchian Channels
Built by Ricardo and JR
Here is a great indicator to use for strong trends. Donchian Channels react immediately to changes in the highest high and lowest low. For strong trends you want to trade when RSI is set along the upper or lower DC-RSI envelope. When the RSI releases from the DC-RSI envelope, you can take the trade off.
Rob Hoffman - Overlay SetHere is all the Rob Hoffman (Overlay) Indicator. Will release the rest as a different indicator.
Planned,
1. Stochastic
2. MACD
Alternatively,
Videos
www.youtube.com

Patrick's Buy HistogramSet up a trailing stop at about 0. Look for the red dots.and that's a good point to enter a long trade.

Patrick's Buy/Sell HistogramSimply look for a 12 point long bar and that's a perfect time to buy the security

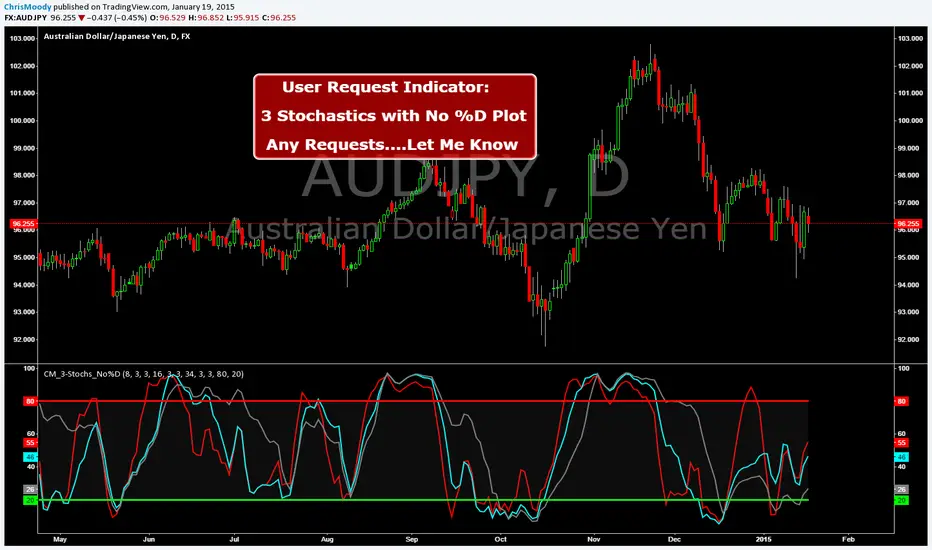
CM_3-Stochastics_No%D_UserRequestCreated By ChrisMoody on 1-19-2014 by User Request
Plots 3 Stochastic Lines.....No %D Lines...by User Request.
Relative Strength Index x2Two RSI better then one. Also histogram shows difference of fast and slow RSI.

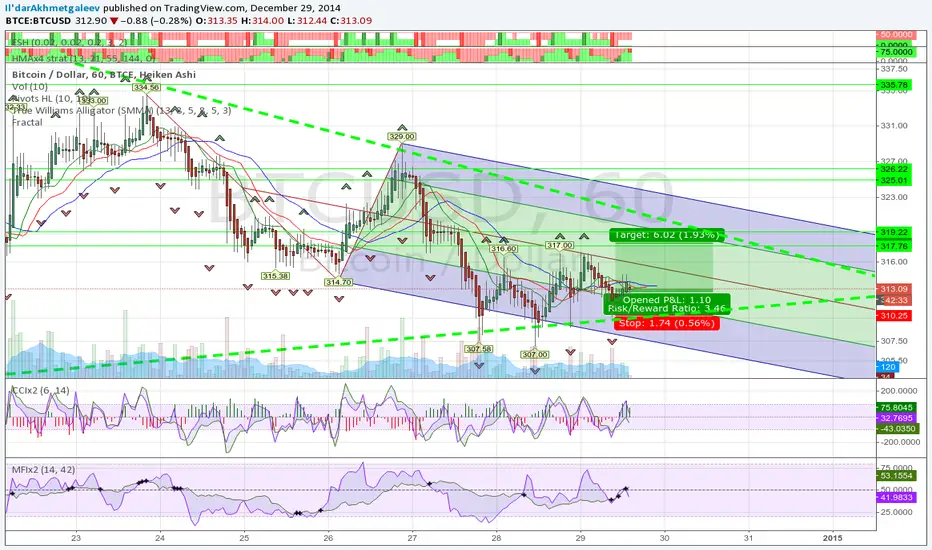
[Bitcoin] Spot price vs Futures indicatorA handy script to detect opportunities in the futures market during extreme movement.
During rallies, futures usually tend to be US$10 above spot price, on the other hand it can be $1 below spot price when the price starts to decline.
You could also draw a trendline to it :) measuring the amount of risk people are willing to take just to predict future prices in the rally/decline.
Credits to lowstrife for the idea, I'm just implementing it :)

Commodity channel index x2 v1Slightly enhenced CCI. Take a look how difference between slow and fast CCI displayed as histogram can predict possible reverse.
EDIT: fast = 14, slow = 28 works better.
MAGNUS® CyclesThis indicator will help you if you struggle making any profit in bitcoin.
It generates very few signals with very nice profit potential ( around 100% this year ! ).
Perfect tool for longterm swing traders and new traders that need help figuring out the midterm trend.
Use it with these parameters only:
weekly: 13, 5, 12
daily: 92, 21, 96

MAGNUS™A CHANGE of background color indicates a trade opportunity :
Cyan background = BUY
Purple background = SELL
The bullish signals seem to be better than the bearish ones.
Based on the "Willy" indicator.
Don't change the parameters unless you fully understand the consequences.
Use with brains and caution :)

KDJ Indicator - @iamaltcoinThis indicator is a mimic of the same used by bitcoinwisdom.
There seems to be several different formulas to calculate KDJ, however, i have yet to find this one on tradingview.
The background color is green when J>D and red when J

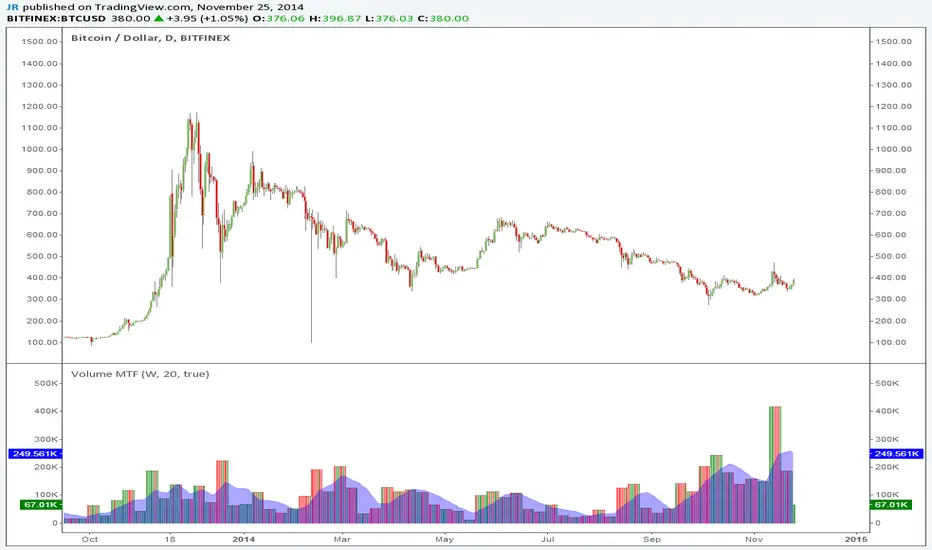
Volume MTFThis is a simple indicator you can use to separate volume from price on your chart. You can also select different time frames (MTF).
Thanks to LazyBear for cleaning up my previous messy code.
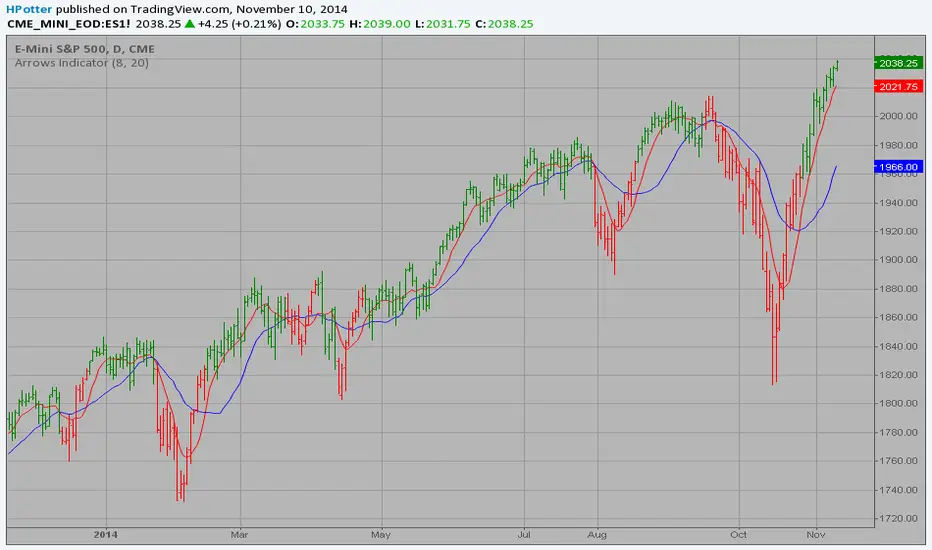
Arrows Indicator Green bars when 8 ema crosses above the 20 ema.
Red bars when 8 ema crosses below the 20 ema.
These studies are based on the March 2009 article, Second Chance
Options , by Barbara Star PhD.
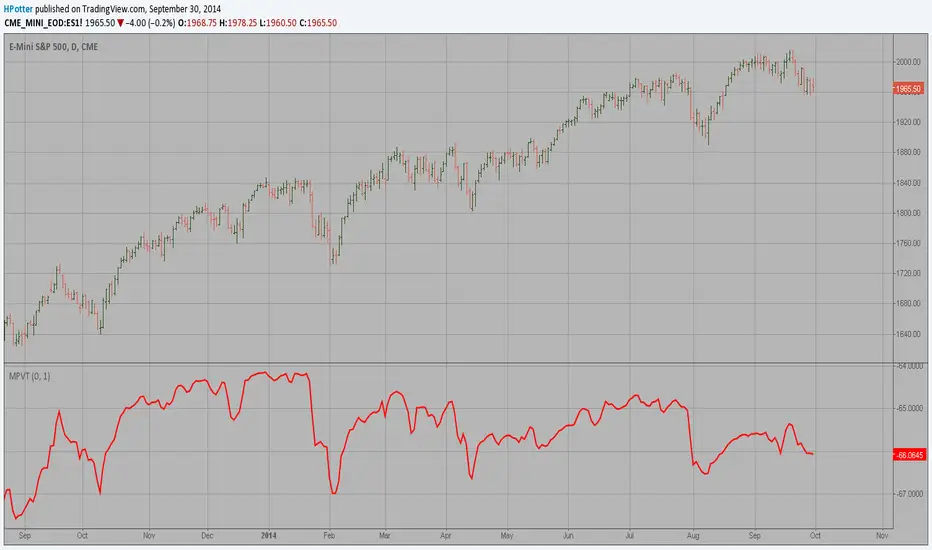
Modified Price-Volume Trend Indicator The related article is copyrighted material from Stocks & Commodities Apr 2010.
TTM Scalper Indicator v2.0 TTM scalper indicator of John Carter’s Scalper Buys and Sells. The methodology
is a close approximation of the one described in his book Mastering the Trade.
The book is highly recommended. Note the squares are not real-time but will
show up once the third bar has confirmed a reversal.

TTM Scalper Indicator TTM scalper indicator of John Carter’s Scalper Buys and Sells. The methodology
is a close approximation of the one described in his book Mastering the Trade.
The book is highly recommended. Note the squares are not real-time but will
show up once the third bar has confirmed a reversal.

CM Time Based Vertical LinesCM Time Based Lines
Requested by codetrader to Visually Show Day Change on Intra-Day Charts.
Custom Indicator: Ability To Plot Recurring Time Lines On Chart!
Example of Uses:
Plot Lines at Midnight to Show Daily Change.
Plot Lines at Opening of Different Sessions.
Plot Lines at Opening and Closing of Sessions.
Plot Lines Every 4 Hours (Forex) To See 4-Hour Price Action!
Ability to Change Times!
Ability to Plot Up To 6 Recurring Time Based Lines!
Plus Many Other Uses!
Ability To Turn On/Off Any of the 6 Customizable Lines in Inputs Tab!
Ability To Change Thickness of Lines to Cover Multiple Bars!

Advance-Decline Indicator The Advance-Decline Indicator is a market breadth indicator
based on the smoothed difference between advancing and declining issues.
The indicator shows when the stock market is overbought (and a correction
is due) and when it is oversold (and a rally is due).
The Advance-Decline Indicator is a 10-period exponential moving average of
the difference between the number of advancing and declining issues.

UCS_RSI BreakoutRSI Breakout indicator, typically used on longer time frame (under Mid CAP) to find the next explosive stock. Can be used on monthly chart with 36 Months breakout period. Weekly with 52 Weeks Breakout period, 100 Days on daily, for Swing trading.
List of All my Indicators - www.tradingview.com
GL.
