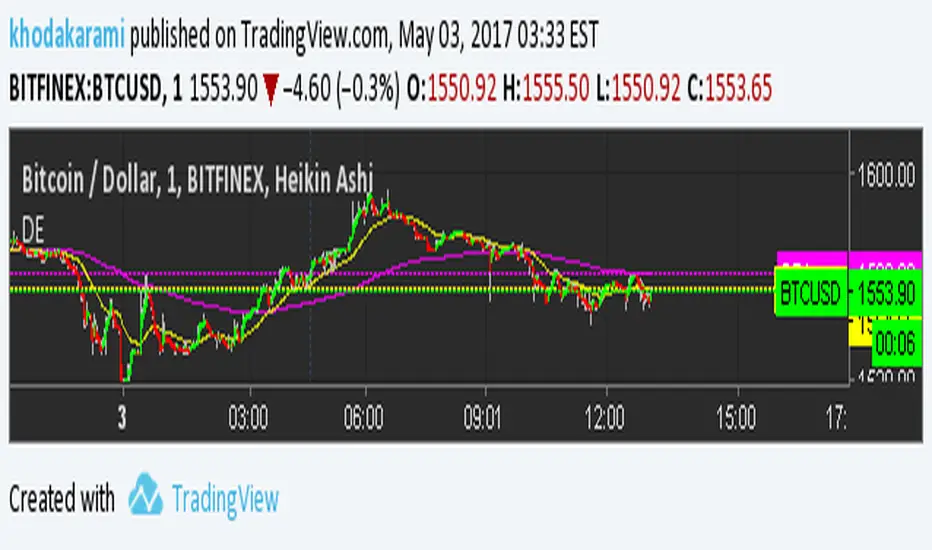
Double EMAThis indicator drops to EMA on your chart. by default it's using different number of bars to calculate the short and long range indicators per time frame. This system is wildly used by professionals to avoid false reading on market's trend and better make decisions. Remember, the crossing of these two indicators should not be used for getting a signal. Instead, you can look into long indicator to see the global market's trend and look at short indicator if the market is reversing the direction of trend to avoid false signals by other systems you may use.
There is also an input and when you check mark the check box, you can tweak the numbers and the two custom numbers will totally override the default ones to make it suite your needs.
X-indicator
Stochastic with False bar R2-2 by JustUncleLThis study project is an updated version of the implementation of the "Stochastic False BAR" indicator.
Description:
The standard Stochastic buy/sell indications come from Stochastic crosses about the standard overbought/oversold zones (80/20). This does not always work and you get stuck in the OB/OS zones with a trend continuation. Utilising a second much longer length Stochastic, the "False BAR" (Black) indicates when it is unsafe to take Stochastic cross over trades. Where the false bar does not appear (aqua, no background highlighing), the overbought / oversold conditions of the Stochastic can be considered higher-probability reversal areas and thus trading opportunities.
This Revision:
Added options to enable/disable False Bar lines and Stochastic trends.
Added options to modify upper and lower limits of false bar Stochastic and trading stochastic trend.
Added option to show the trading Stochastic as coloured Ribbon.
Added name titles for all plots
Added Background highlighting for False Bar.


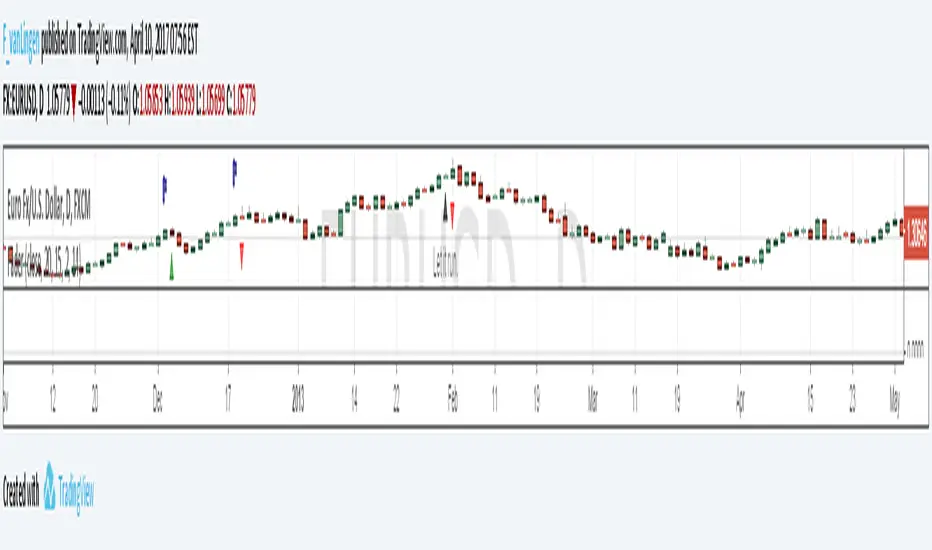
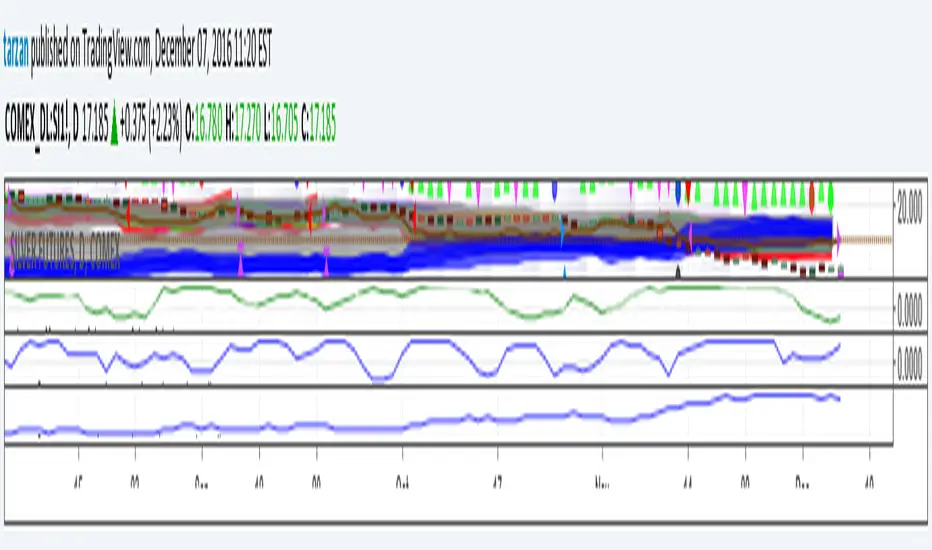
FaderThe Fader indicator finds the moment when trends begin to reverse. It locks down a quick profit which makes it very effective. It also calculates if it's better to stay or leave after a day of having opened the position.
Flags tell you when to buy or sell, red triangles indicate losses whereas green triangles indicate earnings. It has been tested with over 15 currency pairs, and has had consistent earnings.
If you are interested in this indicator please write to me at LingenTrade@gmail.com

YK Dynamic MomentumThis indicator can be useful for analyzing trends and for effective entry and exit points.
The buy entry point is above 0 and the blue line. The buy exit point is below the blue line.
The sell entry point is below 0 and the blue line. The sell exit point is above the blue line.
Don't need any settings. Custom alerts are available.

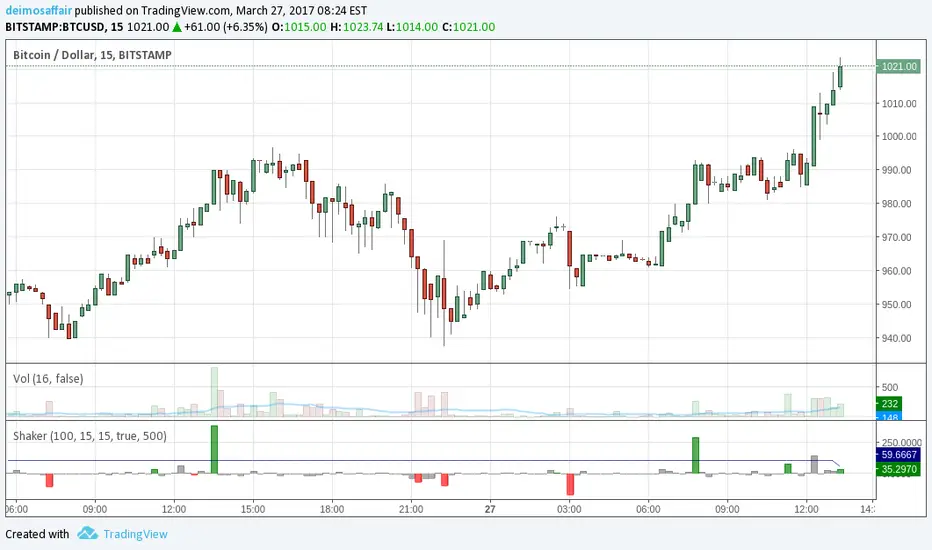
Cooltoyz: market shaker v1.0Panicking over a big ass candle? wondering what's happening on a flat market? Despair no more, this indicator could help with that :)
The market Shaker calculates the price differences, and weights them with the volume used for the move. This volume is not the plain value, but a measure of the past X volume candles.
Examples:
price moves 3%, but with a volume of only ~80% of last candles. looks like weak move
price moves 0.4%, but the volume was a massive 220% bigger than last candles. something happened, even if the market absorbed it all, better pay attention.
in each case, the shaker indicator makes the calculated value bigger/smaller to account for the volume weight of the move.
It's also i real time, the current candle weight is considered on how much time it remains to close. Example, on the 1H chart, if the last candle is 45min to close, the values for the volume are weighted to 25%, since is only 15min "old", while all the other candles are 1h, so the candle is only 25% of it's time to close.
The indicator options has the arguments required to tune the indicator, the candles minutes must match the chart, or the results go crazy.
MACD OverlayMACD Overlay indicator plots the MACD directly on price. This helps you better understand the MACD indicator and filter the false signals.

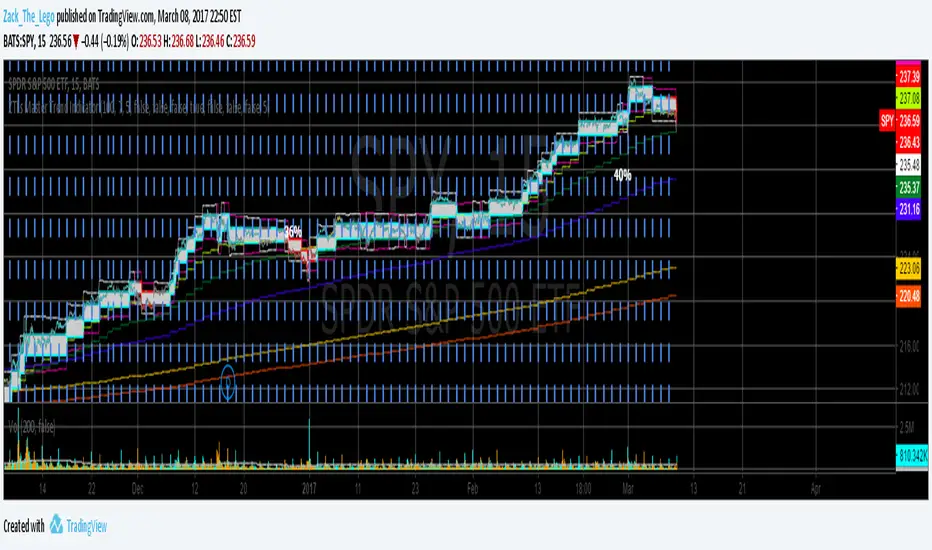
ZTLs Master Trend IndicatorIndicator utilizing a flexible renko (and other indicators assembled in a proprietary way) to "soften" the turbulence. A down-turn in renko combined with a red color signals a sell. An up-turn in renko combined with an aqua color signals a buy. Manually backtested: SPY, JNK, from May 2015 to present: 40%, 24% respectively. Can be used for day-trading or position trading. Has customizeable settings to suit your style. NOT SUITABLE FOR FOREX. (at least not tested)
Multiple Moving Averages using only 1 Indicator!Multiple moving averages in one indicator, so those of you without a pro membership can add multiple moving averages to your chart while only taking up 1 of the 3 indicators.

Action Section, Volatility Choppiness Indicator (by ChartArt)Here is a solution to find entry points to trade. This indicator highlights price sections with low choppiness, where both the ADX (Average Directional Index) indicator shows strong movement (up or down!) in the price and a customized Money Flow indicator (which uses only the change of the volume not the change of the price, hence a Volume Flow indicator), also shows volatility is present. Using higher filter values than the default setting of "30" reduces the noise, but also shows less 'action sections'. Vice versa using values lower than "30" increases the amount and duration of action sections which are shown.
The "action section" indicator does not show the direction if the price is going up or down. It shows if there is enough action worthy the time to trade (lower odds of a neutral sideways trend). Therefore in addition a Heikin-Ashi based price change indicator can optionally be plotted, which shows the actual direction of the price.
Action Section, High Volume Volatility & Low Price Choppiness Indicator
This indicator works only on charts which have volume data.

UCS-Probability to BounceHey All,
This is an indicator I was developing over the last year. Over some extreme testing and good test results. I am confident to add this to the pool of my indicators.
Yes, this is a protected script. Contains some intensive research.... and every value here is manipulated to fit a general context. Therefore, treat this just like any of my indicator.
If you want to know further about how i use. comment below......

Magicians IndicatorMagicians Indicator gave a clear suggested entry point and is giving a clear suggested stop.
Leave a comment if you would like information on how to gain access to The Magician's Indicator.

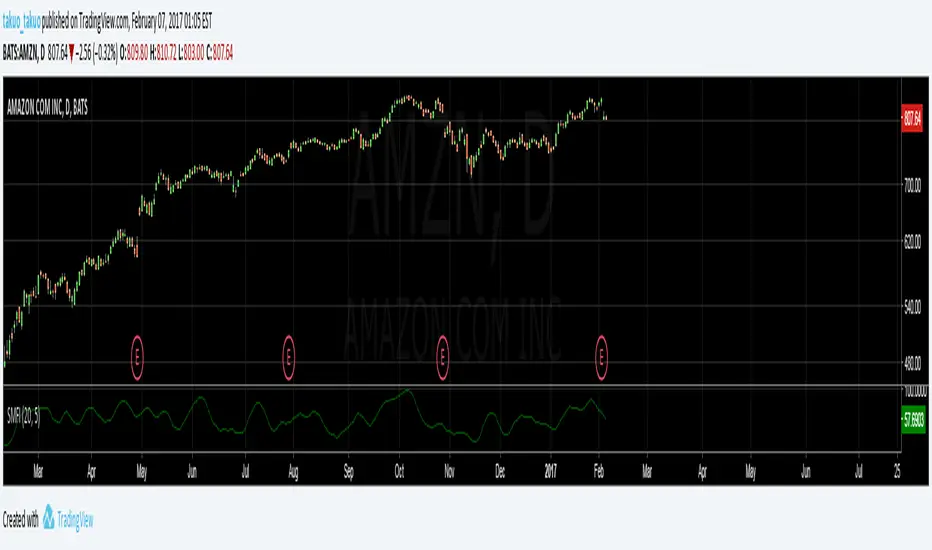
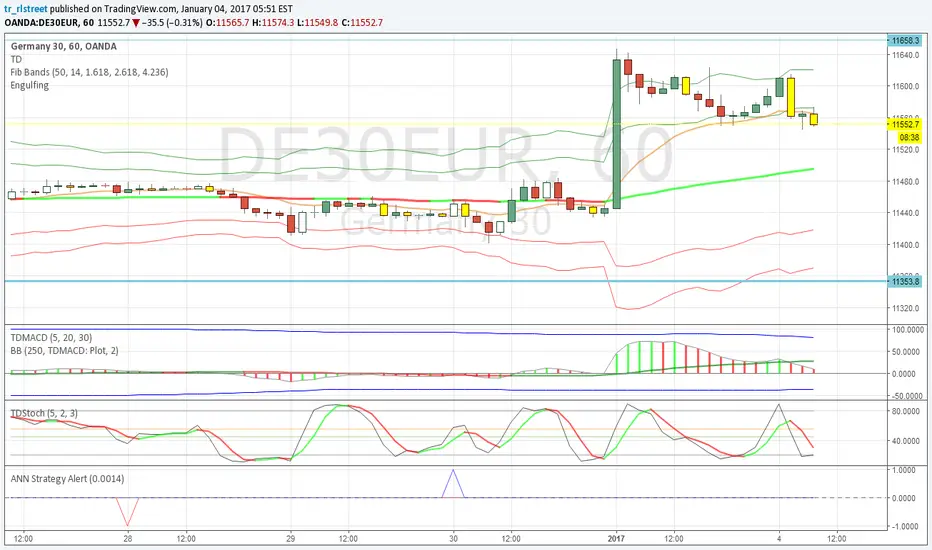
ANN Strategy AlertBased on ANN Strategy by Sirlof2009.
Changed it from strategy to indicator and made appearance less noisy
I use it just for creating alerts (predictionS<0 => Short and predictionL >0 => Long)
Tarzan's spread ratio indicator - DeLuxeThis indicator plots any two securities as a spread ratio using either +,-,/, or *.
It also allows you to use a simple moving average of length 1 to n for your spread ratio.
If you know what you want to do but don't know how to code it, we can work it out, you can float me some cheese on paypal and I'll do a nice job. This indicator is yours for free.
Tarzan = noprism@hushmail.com
Peace
Realtime Volume Checker : reloadedthe main rules are in version 1.0 of this indicator, here: and they provide useful info to make sense of the indicator
two important improvements:
1 - the candle period is now provided in minutes
2 - the volume MA size does not make an average abymore, now IT CHOOSES the highest value in the range. this provides less, but more significant signals.

BB and RSI Indicator Alert v0.3 by JustUncleLI have just recently revised this indicator alert for public release. This is for the 60sec Bollinger Band break Binary Option traders.
This indicator alert is a variation of one found in a well known Broker's marketing videos. It uses Bollinger bands, RSI and moving averages. Included is a pre-warning alert condition. The strategy and settings are designed for 1min charts and Binary Options, but it could work for up to 15 min charts.
The default settings are BB(14,2) and RSI(11) with 75/25 Levels boundaries. To be a valid trade the RSI needs to be within 75/25 channel. The optional Market direction filter is enabled by default and is calculated by two EMA (200 and 50):
When 200ema rising and 50ema above 200ema then market going up.
When 200ema falling and 50ema below 200ema then market going down.
A potential Bollinger Break reversal trades identified by shapes: The purple diamond is the pre-warning purple alert and the green and red pointers with the PUT/CALL labels are the trade alerts. Make Binary Option trade in specified direction 60sec (or can also use 120sec trade without Martingale).
* Notes and Hints *
The original videos specified a Martingale money management strategy, be careful using this management. When I use Martingale I recommend go to 3 levels: 10, 25, 65 if no win at 65 stop trading this alert and start next alert back at 10, you should recovery loss by future wins given you are able to get a reasonable ITM rate with this strategy. Alternatively instead of using Martingale use 120sec Binary Option trade.
Be wary of break alerts on a steep Bollinger, they tend to keep running away for awhile, especially if steep on both sides of Bollinger channel.
As with most of this style of indicator the alert conditions will redraw until the candle is closed. For me this is okay, as it is an Alert is only to a potential trade and final decision to trade is made by me.
You need to practise this and be aware of market news, sessions boundaries, slow trading periods etc. Plan your periods of when you should trade, I prefer Asian session before lunch and London sessions.

Real Time Volume checkerThis indicator was designed to work in real time, and needs the "calculate on every tick" turned on. It verifies if the volume from the current candle is increasing more or less than the average.
Example using 5 min. candles:
1 minute is 20% of the time for the candle. So, if the volume is at 20% or below of the vol.average, the market is stable(price not moving much). If at 1 minute(20% of time) volume is say, at 37%, a big move is happening.
The color of the candle shows the movement direction. A gray means the volume was not important, below average.
The historical candles show how much volume infuenced the price for the corresponding candle.
The current candle is working REAL TIME.
The blue line shows how much time has passed for the candle to complete. All candles are 100% complete(yeah, duh), except for the last one, the line touches zero at start of candle, and slowly fills up to1(1=100%)until the candle ends.
INPUTS:
vol MA size: sets the lenght of the volume average. set to your heard desires
candle Period: set to the number of seconds in the period you chose. 5min = 300, 1h = 3600 and so on. Must be correct, or the results turn into crap
Limit: the value below which the candle is a "non-important" candle. 1 = 100% of average
NOTE: in the very first seconds, the indicator goes crazy. it's expected, due to computed values very close to zero used in the math. after some seconds it stabilizes :)

Ehlers Ideal RSI v1.0 by JustUncleLCreated by Request: Description: This is an implementation of Dr. Ehlers Ideal RSI. It uses a Homodyne Discriminator to calculate the dominate cycle of the trend and then uses the half cycle as the length for the RSI calculation.
Main Reference:
- "http://www.jstas.com/RSI/RSI ideaal.htm" it's in Dutch, use Google translate

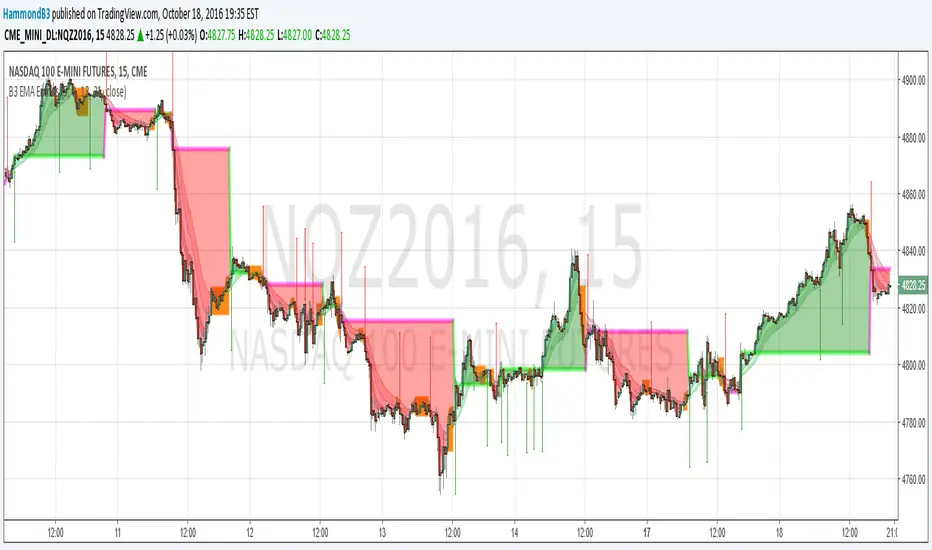
B3 EMA EntriesB3 EMA Entries = B3 EMA Ribbon "Trader"
This study takes the B3 EMA Ribbon and builds trade entries from it. The clouds represent the deviation from entry points; orange equals weakening or undetermined trend. Manage your own exits, and if you have a large deviation cloud in comparison to prior clouds.... take them profits!
Here also is a glimpse into my proprietary scripting that I will likely offer for a subscription at some point. Many simpler freebies like this share to come first of course! I will give away most simple indicators, but there are a few sub-chassis things I use, which I developed myself. One of which is indicator back testing, where I see all of the strategy's history information from the indicator on the chart. Sans trade-ticket automation, this voids the need for a strategy file or A.P.I. or backtesting devices (however, I plan to adapt things to TradingView's strategy system if I can, so that automation can take place). As well as this algorithmic trading system chassis, I also have a specialized statistical output chassis and another few graphical depiction sets.
For this share, you should manage your own exits, (you could simply use the orange clouds as an exit.) This is my most simple of the "indicator traders" I call them. The more intricate algorithmic trading indicators I make have the full trading package down to the risk to reward, entry, target, stop, and trail. The statistical systems are pretty unique, and I haven't seen many doing what I do on that front yet, so I am excited to get those out to more people. Look for these subscriptions in the near future, but as a token of introduction enjoy my next several free shares too.
Cheers, and good trades to you. ~B3
Currency Strength IndicatorSimple but effective don't pay $300 for an MT4 indicator when you can use this for free. Feel free to make it your own!
