Fearzone & Greedzone Levels - Contrarian & Breakout (Expo)"Be fearful when others are greedy, and greedy when others are fearful" - Warren Buffett. Fearzone & Greedzone Levels - Contrarian & Breakout (Expo) is a contrarian and breakout indicator that gives us an indication when fear and greed begins to take over in the market. Traders should be prepared for increased volatility and good trading opportunities.
This indicator can both be used to identify potential reversal points and be used to identify breakouts from previous Fear and Greed Levels.
The Fearzone and Greedzone can be visualized with candlesticks or with circles depending on what you prefer.
Alert conditions are added.
HOW TO USE
1. Use the indicator to identify when investors are fearful and greedy.
2. Use the indicator to identify potential reversal points.
3. Use the indicator to identify potential breakouts.
INDICATOR IN ACTION
4 hour chart
4 hour chart
I hope you find this indicator useful , and please comment or contact me if you like the script or have any questions/suggestions for future improvements. Thanks!
I will continually work on this indicator, so please share your experience and feedback as it will enable me to make even better improvements. Thanks to everyone that has already contacted me regarding my scripts. Your feedback is valuable for future developments!
-----------------
Disclaimer
Copyright by Zeiierman.
The information contained in my scripts/indicators/ideas does not constitute financial advice or a solicitation to buy or sell any securities of any type. I will not accept liability for any loss or damage, including without limitation any loss of profit, which may arise directly or indirectly from the use of or reliance on such information.
All investments involve risk, and the past performance of a security, industry, sector, market, financial product, trading strategy, or individual’s trading does not guarantee future results or returns. Investors are fully responsible for any investment decisions they make. Such decisions should be based solely on an evaluation of their financial circumstances, investment objectives, risk tolerance, and liquidity needs.
My scripts/indicators/ideas are only for educational purposes!
X-indicator

Fearzone (Expo) - Contrarian Indicator"Be fearful when others are greedy, and greedy when others are fearful" - Warren Buffett. Fearzone is a contrarian indicator that gives us an indication when fear begins to take over in the market. Traders should be prepared for increased volatility and good trading opportunities.
The Fearzone is visualized with red candlesticks below the price.
This version of the FearZone indicator is slightly different from the one ©kruskakli has published.
HOW TO USE
1. Use the indicator to identify when investors are fearful.
2. Use the indicator to identify potential reversal points.
INDICATOR IN ACTION
1 hour chart
5 min chart
I hope you find this indicator useful , and please comment or contact me if you like the script or have any questions/suggestions for future improvements. Thanks!
I will continually work on this indicator, so please share your experience and feedback as it will enable me to make even better improvements. Thanks to everyone that has already contacted me regarding my scripts. Your feedback is valuable for future developments!
-----------------
Disclaimer
Copyright by Zeiierman.
The information contained in my scripts/indicators/ideas does not constitute financial advice or a solicitation to buy or sell any securities of any type. I will not accept liability for any loss or damage, including without limitation any loss of profit, which may arise directly or indirectly from the use of or reliance on such information.
All investments involve risk, and the past performance of a security, industry, sector, market, financial product, trading strategy, or individual’s trading does not guarantee future results or returns. Investors are fully responsible for any investment decisions they make. Such decisions should be based solely on an evaluation of their financial circumstances, investment objectives, risk tolerance, and liquidity needs.
My scripts/indicators/ideas are only for educational purposes!

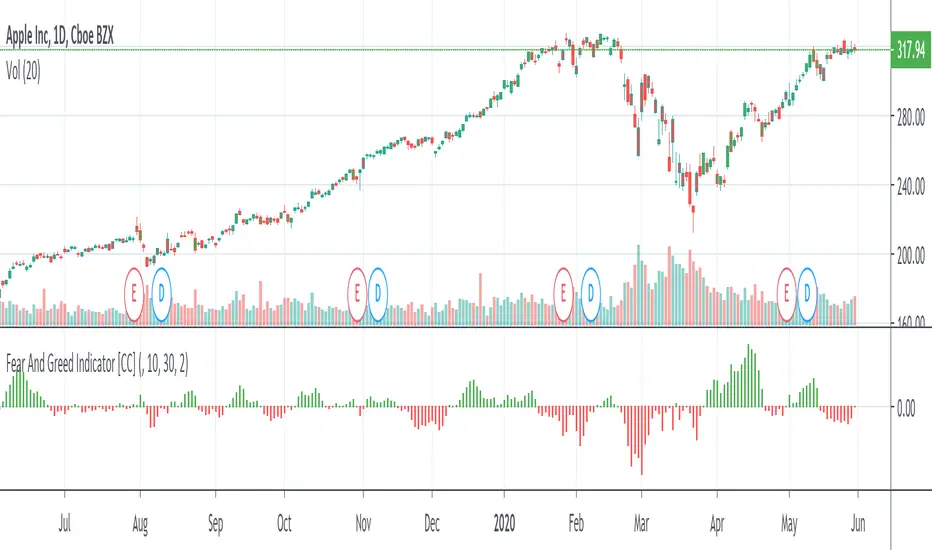
Fear And Greed IndicatorThe Fear And Greed Indicator is a very popular indicator on the Bloomberg platform and since I didn't have actual source code to work with, this is a very close approximation of that indicator. Let me know if you spot any discrepancies with the original and I will do my best to fix them.
For buy and sell signals it is pretty straightforward. Just buy when the green (greed) is in control and sell when the fear (red) is in control
This was a special request so let me know if you want to see more scripts from me or if you want something custom!
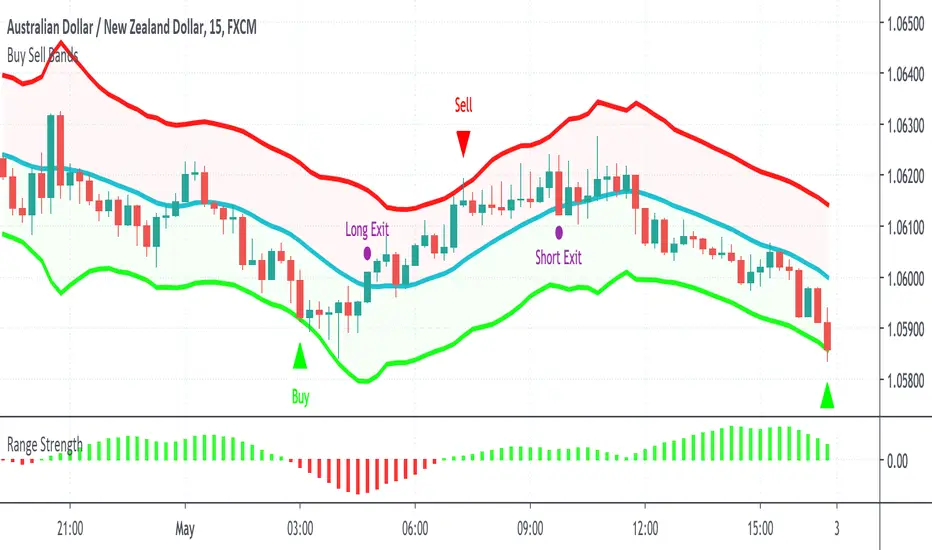
Buy Sell BandsBuy Sell Bands is a super simple indicator based on the mean reversion (range trading) strategy that shows you exactly where to buy, sell and close trades on every chart, market and timeframe.
It's best used together with our Range Strength indicator to identify when the market is in a range mode, this is the best time to take the entry signals from the Buy Sell Bands.
How Is It Different From Other Indicators?
- Designed specifically for the mean reversion (range trading) strategy
- Upper and lower bands are based on current and past volatility
- Aren't as sensitive to "squeezes" after periods of contracted volatility
- Works well in conjunction with the Range Strength Indicator to confirm entry signals
- Helps identify good "pair trading" opportunities
- Can be applied to all markets and timeframes
How To Use The Indicator?
1) Visit our website URL shown below this description and signup
2) We will then grant your TradingView username permission to use our indicators
3) Go to your Indicators window, then the Invite-Only section and add our indicators to your chart
4) Our indicators will then show on every chart you now look at
5) You can set up alerts to be notified in real time of trading signals from our indicators
6) Read our user manual for all the best tips on how to use our indicators as part of a range trading strategy
7) Feel free to reach out to us for personal one-on-one help with getting setup
What Markets and Conditions Does It Work Best On?
All markets cycle between trending and ranging modes, and the key to successfully using these indicators is identifying when the market is in or about to go into a range trading mode, and as such it can be applied to all markets and timeframes.
Some markets and timeframes trade within ranges more predictably than others, for example Forex, Cryptocurrencies, and Futures on the 15 minute timeframe during the US night session can work well due to the lack of price sensitive news creating lasting trends. With Stocks & ETFs on the 5 minute timeframe during the midday session on large cap blue chip stocks with no recent news releases can show strong range trading environments to use our indicators in.
In addition to single markets, you can also use our indicators on pair charts, for example Coca Cola(KO) versus Pepsi(PEP), you can do this by entering KO/PEP inside your TradingView chart quote box and it will bring up a pair chart. Our indicators will show buy and sell signals right on the pair chart just like any other single instrument chart. You can get very creative with what type of pairs you can come up with.
Our indicators are primarily designed for day trading and swing trading, however they can also be used for position trading and investing by identifying technically oversold and overbought range levels that are based on current and past volatility around a dynamic average price, for this we recommend using a weekly chart to identify longer trading opportunities.
As always indicators should be used as part of a trading strategy to assist in making decisions, instead of just blindly following every signal they produce you should always seek to compliment technical trading signals with additional analysis to reduce your risk and increase your odds of making a winning trade.
Examples Of Use On Various Markets and Timeframes
GBP vs CHF Forex Pair 15 Minute Chart
Tesla Stock 1 Minute Chart
Bitcoin vs USD Crypto Pair 15 Minute Chart
Micro E-Mini SP500 Futures 1 Minute Chart
Mastercard vs Visa Stock Daily Pair Chart
To gain access to the Buy Sell Bands and Range Strength Indicators visit our website shown below.
Happy Range Trading :)

VWAP y Standar DeviationThis script presents the real VWAP (Yellow line), in 50 period VWAP (Blue Line) and the 120 period VWAP (Red Line). Additionally, it presents the values of 1 and 1,618 standard deviations of the VWAP of 50 periods.
This confirmation allows to visualize the behavior of the price in realicon to the VWAP key indicator that represents the midpoint of the operating volumes in a period.
This script evaluates the deviation of the price in relation to the average of the volume traded in the different periods.
The indicator settings allow changing the length of the VWAP for custom settings. Standard deviations are determined based on VWAP 2. VWAP 1 is a reference for determining the global trend of movement in the established period.
The upper and lower limits of the representative Standard Deviation of 1.618 (Fibonacci Number) are used as confirmation of continuation of a trend once crossed by the price.
During the ranges the 1.618 limits of the Dev. Standard are used as entry and exit points of the operation (For this it is necessary to adjust the VWAP 2 to the studied temporality and the operated asset)

EURUSD Binary Strategy Indicator ALERTS!Good afternoon traders!
The EURUSD Binary Strategy Indicator ALERT, is a continuation of the " EURUSD Binary Strategy 73% Win Ratio " strategy made by my self. This indicator allows you to add alerts in order for you not to miss a trade! Furthermore, for the purchase of the " EURUSD Binary Strategy 73% Win Ratio " strategy, this indicator is also included.
A FREE 5 DAY VERSION of the " EURUSD Binary Strategy 73% Win Ratio " Strategy is available! Go try it now!
Best regards!
Contact:
emilianomesauribe2000@live.com

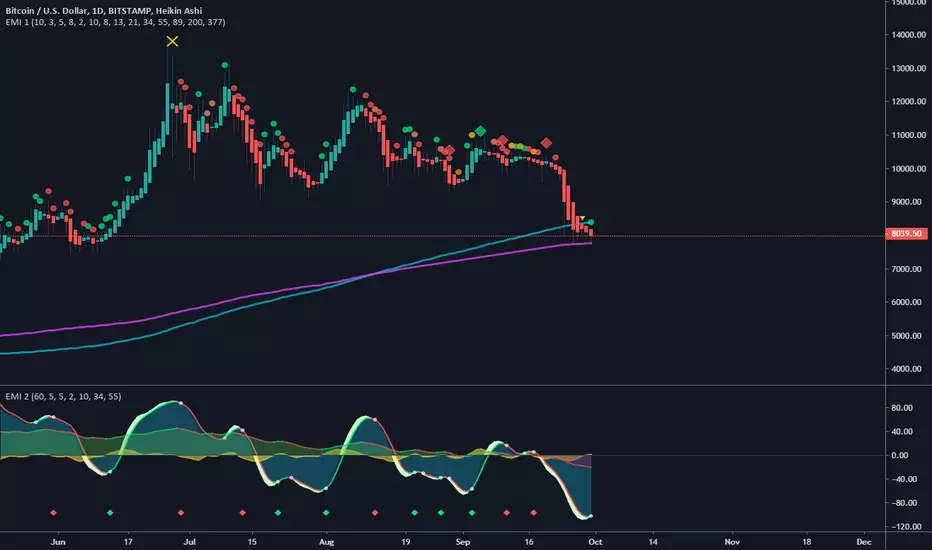
(EMI 1) Epic Market Indicator v2.2Had to release a new version, due to house rules.
This indicator is usable for every market and I do suggest to use it in combination with EMI 2.
Green = buy/long, Red = sell/short
Orange = Price action divergence/convergence.
Yellow X = Manipulation, you might to be careful when you see this, most of the time dumps happens afterwards.
Always wait for the candle/bar to close and if possible wait for another confirmation. No confirmation most of the time means, trend continuation.
Diamonds are the strongest signal, you might want to to buy/long or sell/short when you see this signals.
Cirles/Dots are trend continuation, shows which way the trend. More of the same color in a row the stronger the prediction. But once you see an orange colored signal then it's possibly going to diverge.
Longer the term/period the more accurate prediction signals will be.
You can enable/disable other tools in the settings:
EMA's, SMA , Bollinger Bands and Pivots .
But also trend colors
Setup your own configurations the way you like. I recommend using Fibonacci seq . Keep in mind, sooner the prediction signals become the more riskier.
update:
- Added bollinger bands with trend color. You can disable or enable this in the settings.
- Modified manipulation conditions.
- Modified buy and sell conditions.
Support & Resistance | EMILIANO MESAAfter months of studying, and lots of coding I figured out support & resistance levels are much more complicated than what we thought. After hundreds of failed trials using price(close) as the main source of information for my S/R indicators, after modifying certain values, and creating an effective method to define S/R levels, which does not include price a huge advanced was made. Today I introduce, and make public "Support & Resistance | Emiliano Mesa" by Emiliano Mesa. This indicator uses my method to find support and resistance levels, which again isn't based in price, but other factors.
Furthermore it creates areas rather than simple lines. As they are more precise. When price enters an area a range movement can be expected.
Key:
Blue Fill --> Support/Resistance Areas
Yellow Background --> New S/R Area Created
This indicator works extremely well in 2H, I suggest length value as 314, however you can play with it.
Business Inquiries:
emilianomesauribe2000@live.com
Sincerely,
Emiliano Mesa Uribe

Logistic DifferenceLogistic Difference Indicator uses logistic function (sigmoid), which stabilizes the variance of data.

All-In-One EMA Boll Cross SignalsThis one combines many commonly used indicators and signals into one.
1. EMA lines
2. SMA lines
3. Bolling Bands (EMA based)
4. Ichimoku cloud
5. 3/8, 10/20 EMA crosses
6. 5/10 SMA crosses
7. MACD crosses

Impulse Volume Emiliano Mesa OverlayThe impulse volume overlay, is the 2nd part of my 2 part volume impulse indicator. The indicator has the sole purpose of measurearing a signifcant increase in the volume of either sellers or buyers and with the the help of several EMA lines giving perfect entries. Results are very promising even in FOREX market... For now it has only been tested in 5 min charts.
How it works:
1) Check either if the price is in a down or up trend. So if the price is under both 100 and 200 EMA its down, and viceversa
2) If you have a down trend, wait for the overlay indicator to highlight the bars green, when the highlight stops enter a selling position, it is suggested you calculate your stop loss with the ATR. If the trend was going up, do the same with the red highlight.
3) Exit position when you feel like it, furthermore a trailing stop is suggested in order to maximize profit.
I DO NOT TAKE ANY RESPONSABILITY FOR LOSSES. USE INDICATOR UNDER YOUR OWN RISK.
DepthHouse MTF Volume FlowDepthHouse MTF Volume Flow Indicator is an amazing tool used to help determine market direction on multiple time-frames based on the the traded volume.
This indicator is a superb upgrade to my original volume flow indicators.
You now how the option to adjust the displayed volume timeframe, which in turn adjusts the Volume Flow Moving Averages , along with the new Breakout Candle feature.
Additionally, the background colors represent the volume flow crossovers on the primary time-frame, along with three addition time-frames that are user adjustable.
The primary volume flow crossover is shown on the top of the grid, followed by the First Additional Time Frame and then so on down to the bottom.
I generally have this set with the lowest timeframe value at the top, followed by the next one in line.
For those of you who wish to set the current timeframe greater than the rest. I have built in a grid separator feature which will separate it from the rest of the background crossovers.
My MA Settings:
I generally have my Moving Averages set anywhere from 7-14
Breakout Factor:
I generally have the breakout factor set at 1.5 or 2.5
Note: Since volume amounts vary across the board. The background height is set to readjust based on the highest bars. This lookback amount is adjustable by the user and it does not affect calculations what so ever.
How to get:
As you can see this is an invite only script. In the coming month this indicator, along with many others will become pay to use only. (website on my profile page)
However all my indicators will be FREE until May 1, 2018 . So please try them out!
To take advantage of this FREE trial:
1. Leave comment on this indicator post! Maybe even give me a follow :D
2. Check out and take advantage of all my other indicators!
I hope you all enjoy!


Anomaly Indicator V1.1 The Anomaly Indicator is an idea I recently come up with. Its very simple, yet it can be extremely useful. The Anomaly indicator detects the current and general trend channels. When the yellow line which is the current channel, exits the general channel this will usually mean an anomaly. Anomalies can vary within meaning, from a trend reversal, a market change (trending or rangebound) and lastly it can also give you an entering point. You can even use it to know the volatility of the market.
This is a very early version of the indicator and has pre-set values. I personally use it among a 5 minute chart for daytrading.
NOTE : Have in mind my indicator as ny other is not perfect, it might give fake signals. I suggest using Williams Alligator, and RSI with it. Best of luck. Follow my predictions under your own risk.

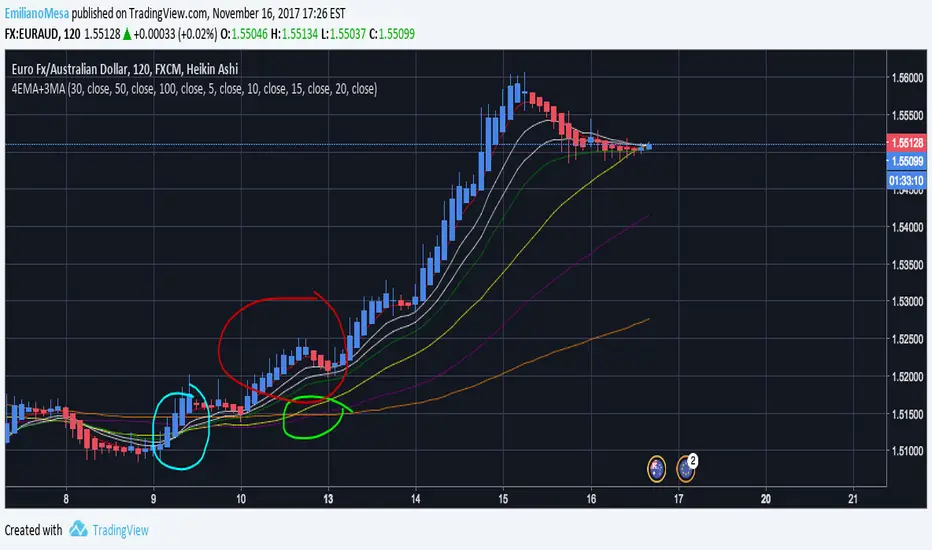
4EMA+3MABased on LazyBear 8MA I decided to do something similar for my personal use. I created an "Alligator" which works with 4 EMA lines and without "future" prediction, it will show you the most recent trend only, creating a later call than the original alligator yet a more precise one. Then there are the 3 MA with huge periods, including 30,50,100. This allows the trader to have a more general idea of the trend compared to that of the 4EMA's which in fact give more value to the current trend. You can change all colors and values.
Details:
As you can see in the graph both EMA & MA work great together. For instance look the blue circle, EMA "Alligator" was crossed giving entry for an early call (which was right), and later on the MA's crossed too! Giving the indication a huge trend was about to appear.
NOTE: Follow my predictions under your own risk. I apreciate all constructive feedback and support on how to improve. Thank you.
Mongerskit Trading System v2.3 lower time frame FIXI had numerous requests and complains on why signals are only generated on larger time frames. (rarely 4hr and mostly daily and weekly time frames)
Now the sensitivity of signals generated can be manually adjusted to work on all time frames.
It is advisable to play around with the sensitivity on your favorite time frame to get a combination that works for you.
Currently we see GBPUSD on hourly time frame at 55 sensitivity which shows a profitable system.
here is a image of a lower sensitivity on 15min TF
(USABILITY)
- Use this system in conjunction to your technical analysis to achieve optimal performance.
- Best time frame is 4 hours and 12 hours on default settings, for 1 hour time frame, sensitivity of 55 has been tested to work, feel free to change sensitivity to something that works for you.
- DO NOT use the system with pairs that are consolidating.
(CHANGES)
v2.3
- Added sensitivity input, users can configure sensitivity to get buy/sell signals on lower time frames.
v2.2
- final tweaks are done to this revision
- few appearance changes
- minor reported bug fixes
v2.1
- changed the sensitivity a little more.
- fixed all the reported bugs and issues
- fixed a problem with chart scaling down when using the indicator
- fixed some typo with signal text
v2.0
- changed the sensitivity and few settings, signals are much more accurate.
- made a few appearance changes.
- Signals may appear less then before but they are much more accurate, use 4 hour and 12 hours together to determine best entry.
- this is the Dark theme, I will release the Light theme too for the ones using lighter background colors.
v1.1
- fixed the amount of times the signals are shown
- fixed some color issues
v1.0
- First free version open to public
This Indicator is not a free indicator, you can request to try the indicator in the comment section below and I will selectively give users access temporarily to try the indicator.
Feel free to message me about any questions related to the indicator.
www.uidubai.net

MA ExtensionThis indicator measures the vertical distance form the current close to the MA of your choice. I find that it does not work best as an oscillator, but it works well for providing early signals for taking profits when trend continuating. For example, if you go short due to a retracement to the MA (of your choice) take profits when a bearish trendline is broken (signalling the start of a bullish correction) that corresponds to the highs of the chart. The logic behind this indicator is that the breakouts of trendlines of an assets difference from an MA will precede corresponding breakouts of trendlines drawn on raw price. Kind of like Momentum, except it takes trend into account. Momentum has the same leading feature when it comes to drawing trendlines , but trendlines will be harder to draw due to the Momentum indicators oscillatory behavior.
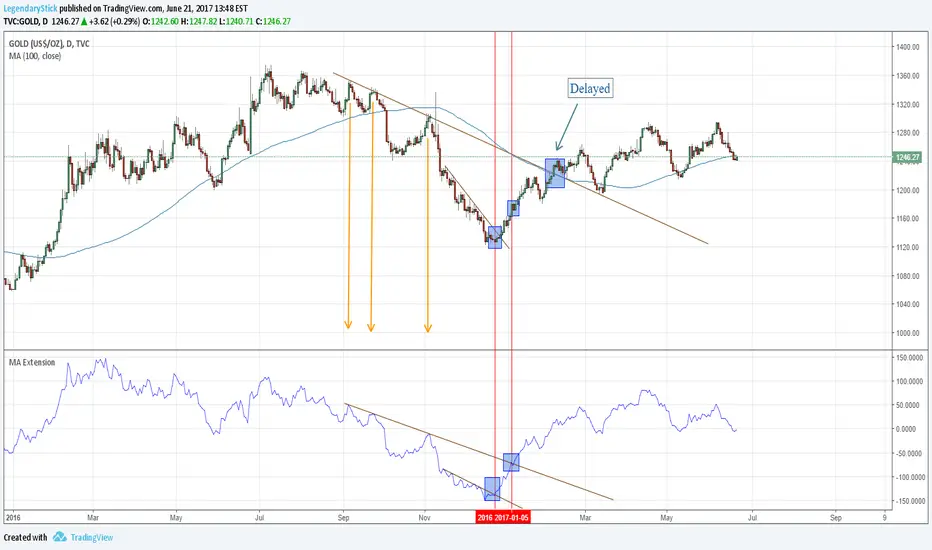
MA ExtensionThis indicator measures the vertical distance form the current close to the MA of your choice. I find that it does not work best as an oscillator, but it works well for providing early signals for taking profits when trend continuating. For example, if you go short due to a retracement to the MA (of your choice) take profits when a bearish trendline is broken (signalling the start of a bullish correction) that corresponds to the highs of the chart. The logic behind this indicator is that the breakouts of trendlines of an assets difference from an MA will precede corresponding breakouts of trendlines drawn on raw price. Kind of like Momentum, except it takes trend into account. Momentum has the same leading feature when it comes to drawing trendlines , but trendlines will be harder to draw due to the Momentum indicators oscillatory behavior.

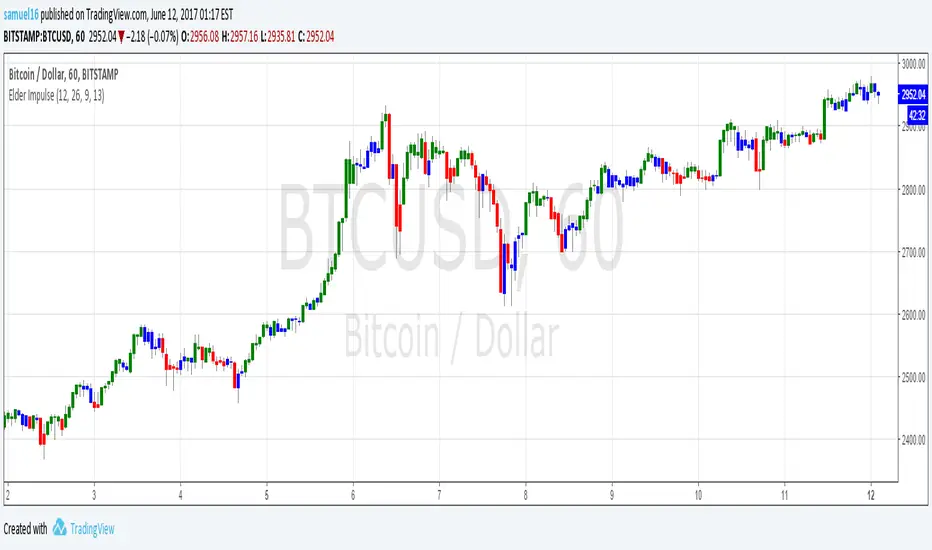
Elder Impulse SystemQuickly Identify Trends with the Elder Impulse Indicator.
Pretty much the same as , but written from scratch to be simpler to use and the source code easier to read (no offense, LazyBear)
For more info, see stockcharts.com
Volume Conversion IndicatorVolume Conversion Indicator
The volume conversion indicator is much like the in-built volume indicator. This particular volume indicator allows you to find out how much of something has been traded in a given timeframe.
This is done by multiplying volume by the average price at that point.
What does this mean?
Well, say, for example, you were watching DGB/BTC (DigiByte/Bitcoin). Instead of the volume being displayed in the amount of DGB traded, the amount of BTC traded is displayed instead.
Feel free to comment... Hope this helps :D

MoD_CM_RSI_2_Strat_Lower_Indicatormodified version of "CM_RSI_2_Strat_Lower_Indicator". credit to CM for the hard work.
updates:
1. now includes inputs for SMA values and RSI values
2. contains option to trigger Alerts.
how to trigger alerts?
-In First Drop Down Box Select Name of Indicator
-In Drop Down to Right Select “RSI Alert....”
-Then Select “Greater Than”.
-Then Select “Value”
-To the Right of Value type in .99
-Select On Bar Close / Once on candle, whatever your preference.
