Enhanced WaveTrend OscillatorThe Enhanced WaveTrend Oscillator is a modified version of the original WaveTrend. The WaveTrend indicator is a popular technical analysis tool used to identify overbought and oversold conditions in the market and generate trading signals. The enhanced version addresses certain limitations of the original indicator and introduces additional features for improved analysis and comparison across assets.
WaveTrend:
The original WaveTrend indicator calculates two lines based on exponential moving averages and their relationship to the asset's price. The first line measures the distance between the asset's price and its EMA, while the second line smooths the first line over a specific period. The result is divided by 0.015 multiplied by the smoothed difference ('d' for reference). The indicator aims to identify overbought and oversold conditions by analyzing the relationship between the two lines.
In the original formula, the rudimentary estimation factor 0.015 times 'd' fails to accomodate for approximately a quarter of the data, preventing the indicator from reaching the traditional stationary levels of +-100. This limitation renders the indicator quantitatively biased, as it relies on the user's subjective adjustment of the levels. The enhanced version replaces this factor with the standard deviation of the asset's price, resulting in improved estimation accuracy and provides a more dynamic and robust outcome, we thereafter multiply the result by 100 to achieve a more traditional oscillation.
Enhancements and Features:
The enhanced version of the WaveTrend indicator addresses several limitations of the original indicator and introduces additional features-
Dynamic Estimation: The original indicator uses an arbitrary estimation factor, while the enhanced version replaces it with the standard deviation of the asset's price. This modification provides a more dynamic and accurate estimation, adapting to the specific price characteristics of each asset.
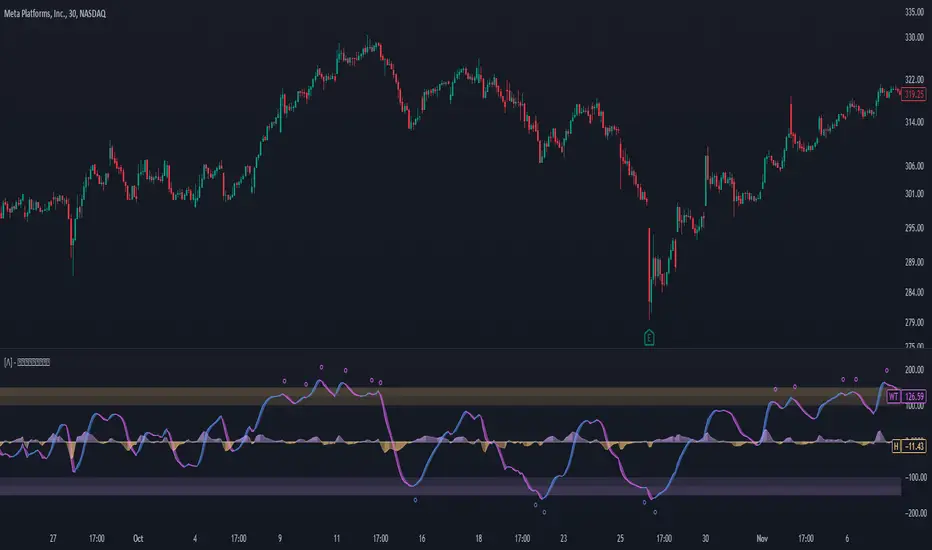
Stationary Support and Resistance Levels: The enhanced version provides stationary key support and resistance levels that range from -150 to 150. These levels are determined based on the analysis of the indicator's data and encompass more than 95% of the indicator's values. These levels offer important reference points for traders to identify potential price reversals or significant price movements.
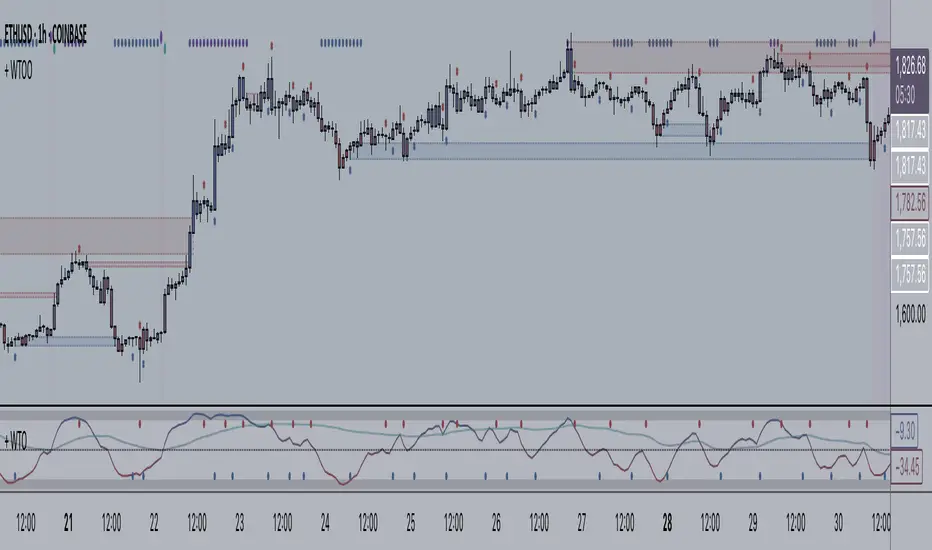
Comparison Across Assets: The enhanced version allows for better comparison and analysis across different assets. By incorporating the standard deviation of the asset's price, the indicator provides a more consistent and comparable interpretation of the market conditions across multiple assets.
Upon closer inspection of the modification in the enhanced version, we can observe that the resulting indicator is a smoothed variation of the Z-Score!
f_ewave(src, chlen, avglen) =>
basis = ta.ema(src, chlen)
dev = ta.stdev(src, chlen)
wave = (src - basis) / dev * 100
ta.ema(wave, avglen)
Z-Score Analysis:
The Z-Score is a statistical measurement that quantifies how far a particular data point deviates from the mean in terms of standard deviations. In the enhanced version, the calculation involves determining the basis (mean) and deviation (standard deviation) of the asset's price to calculate its Z-Score, thereafter applying a smoothing technique to generate the final WaveTrend value.
Utility:
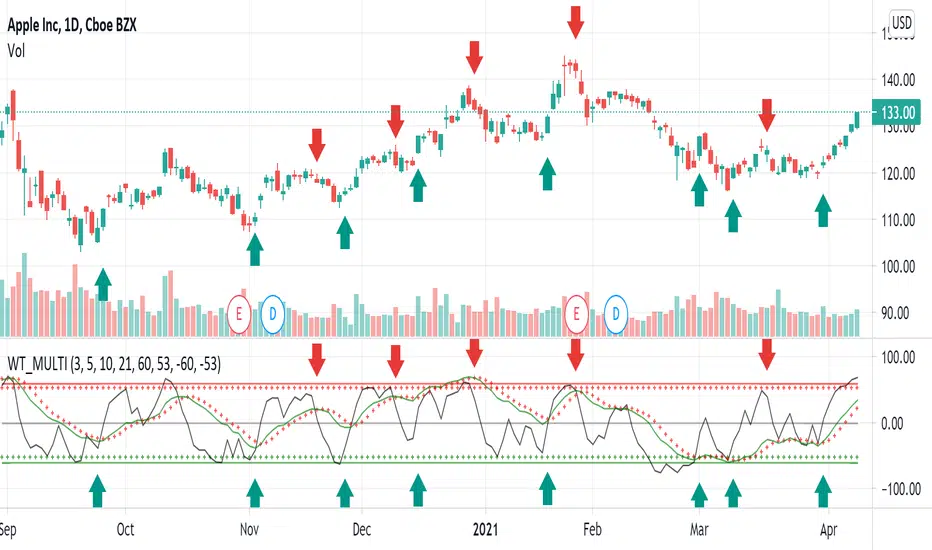
The 𝗘𝗻𝗵𝗮𝗻𝗰𝗲𝗱 𝗪𝗧 indicator offers traders and investors valuable insights into overbought and oversold conditions in the market. By analyzing the indicator's values and referencing the stationary support and resistance levels, traders can identify potential trend reversals, evaluate market strength, and make better informed analysis.
It is important to note that this indicator should be used in conjunction with other technical analysis tools and indicators to confirm trading signals and validate market dynamics.
Credit:
The 𝗘𝗻𝗵𝗮𝗻𝗰𝗲𝗱 𝗪𝗧 indicator is a modification of the original WaveTrend Oscillator developed by @LazyBear on TradingView.
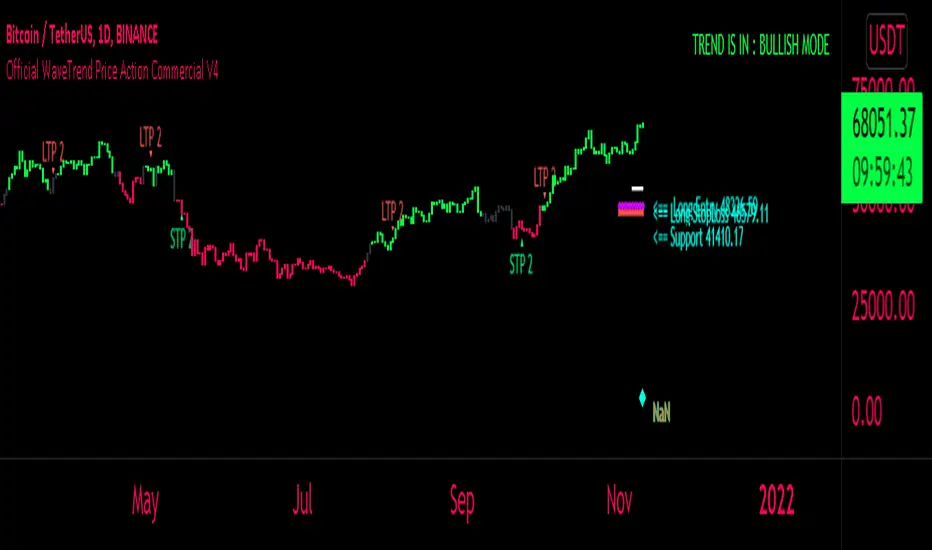
Example Charts:
Wavetrendindicator
Moving Average with Dynamic Color Gradient (WaveTrend Momentum)Similar scripts exist but I haven't seen one using WaveTrend and I haven't seen one that hand picks evenly divided colors between GREEN-YELLOW-RED.
The green is exact green, the yellow is exact yellow, and the red is exact red.
Not complicated, just useful.
FaizanN Official WaveTrend Price Action Commercial PINEV4Hello Traders,
Here i bring you my first Price Action WaveTrend based Indictor combined with fib entry and exit trailing levels with minimum risk and maximum profit , as we must have seen at times as we enter the trend reverse and hits our stoploss . Keeping that in mind as i too struggled and made losses so i decided and focused more on minimizing the loss and only on confirmation Long or Short trade is been initiated along with Stoploss as explaned in the images below , why should we give market our money ;) as we are here to make money :D .. There is no holy grail as Stop loss wont be hit but yes it will be way less and all alerts are based on candle close ... One can use this on any chart and any timeframe and its very good for scalping too . Better results are on 15m and above . Hope you guys will like it and comment if you have any doubts..
-----------------
Disclaimer
Copyright by FaizanNawazz.
The information contained in my scripts/indicators/strategies/ideas does not constitute financial advice or a solicitation to buy or sell any securities of any type. I will not accept liability for any loss or damage, including without limitation any loss of profit, which may arise directly or indirectly from the use of or reliance on such information.
All investments involve risk, and the past performance of a security, industry, sector, market, financial product, trading strategy, or individual’s trading does not guarantee future results or returns. Investors are fully responsible for any investment decisions they make. Such decisions should be based solely on an evaluation of their financial circumstances, investment objectives, risk tolerance, and liquidity needs.
My scripts/indicators are only for educational purposes!
Happy Trading!
+ WaveTrend Oscillator OverlayAn overlay version of pertinent signals from my version of LazyBear's Wavetrend Oscillator.
Shows momentum of long period WTO as either background colors or symbols.
Shows continuation and reversal trade signals.
If Secondary WTO is above the center line (momentum is long), then symbols print across the top of the chart when the primary (faster) WTO comes into "oversold," a number associated with a horizontal line on the off-chart indicator. This number is selectable via a drop-down menu. Same thing for bearish momentum.
Conversely, reversal signals are printed along the bottom when conditions are met. Ex: if the Secondary WTO is showing momentum is bullish, then symbols will print along the bottom when the primary WTO is at "overbought" (or whatever number you deem overbought--again, via a similar drop-down menu).
Also, symbols are printed above and below candles for when the moving average of the primary WTO is crossed.
You could use these for taking profits, exiting a trade, or entering a trade.
Includes a moving average that is an average of the 200 EMA, SMA and Kijun.
Alerts.
Enjoy.
//p.s. I recommend using this in conjunction with my "+ Wavetrend Oscillator" at least starting out. Helps to have a visual
//reference when picking reversal and continuation numbers.
On-chart Wavetrend Divergence with PivotsThis is an OnChart WaveTrend Divergence Indicator with Pivots and Alerts
LazyBears WaveTrend Indicator or also known as "Market Cipher" is an Indicator that is based on Moving Averages, therefore its an "lagging indicator". Lagging indicators are best used in combination with leading indicators. In this script the "leading indicator" component are Daily, Weekly or Monthly Pivots. These Pivots can be used as dynamic Support and Resistance, Stoploss, Take Profit etc.
This indicator combination is best used in larger timeframes. For lower timeframes you might need to change settings to your liking.
What are those circles?
-These are the WaveTrend Divergences. Red for Regular-Bearish. Orange for Hidden-Bearish. Green for Regular-Bullish. Aqua for Hidden-Bullish.
Please keep in mind that this indicator is a tool and not a strategy, do not blindly trade signals, do your own research first! Use this indicator in conjunction with other indicators to get multiple confirmations.
+ WaveTrend OscillatorI'm guessing most of you are familir with LazyBear's adaptation of the Wavetrend Oscillator; it's one of the most popular indicators on TradingView. I know others have done adaptations of it, but I thought I might as well, because that's kind of a thing I like doing.
In this version I've added a second Wavetrend plot. This is a thing I like to do. The longer plot gives you a longer timeframe momentum bias, and the shorter plot gives you entries and/or exits. Here we have one plot with a lookback period of 55, and another with the default set to 6 (change this to 14 if you think you might prefer something slower and that will plot similarly to the default RSI settings). With the traditional Wavetrend Oscillator there is a simple moving average on the WTO that is to help provide entries and exits. I've done away with this as there are already two plots, and I felt more would just clutter the indicator. Instead of plotting the SMA I've plotted the crosses along the bottom and top of the indicator. Also, as is not the case in LazyBear's version, this SMA length is adjustable. By default it is set to 3, which is the default setting on the original indicator.
I've also plotted background colors for when there is what I call a momentum shift. If one or the other oscillators crosses the centerline a colored bar is plotted. By default it is turned on for both WTOs, though in practice you might only want it on for the longer one.
I would say use of the indicator is similar to the original WTO or many other oscillators. Buying oversold and selling overbought, but being mindful of the momentum of the market. If the longer WTO is above the centerline it's best to be looking for dips to the centerline, or for an overbought signal by the faster WTO, and vice versa if the longer WTO is below the centerline. That said, you can also adjust the length of the SMA on the faster WTO to fine tune entries or exits, which is kind of how you would trade LazyBear's version. In this case you have that additional confirmation of market momentum.
You can set colored candles to either of the WTO plots via a dropdown menu.
There are alerts for overbought and oversold situations, centerline crosses, and Wavetrend crosses.
That's about it. Hope you enjoy this particular implementation of LazyBear's well known indicator.
Ah yes, last thing: Original version the source is set to hlc3. I've given you the opportunity to change that, so if you prefer using close you can, or whatever you want.
WaveTrend MultiEMAThis is a modification of LazyBear's WaveTrend. The SMA trend has been removed and a shorter time frame EMA has been added in black. The idea is to buy when the shorter time frame starts to curl up and the longer time frame, green, has started to either flatten out or curl up too. Sell when the shorter time frame has started down and green has either flattened or bottomed out as well. The black line will generate some noise so the key is to use the two in combination. My final goal would be to have the green line looking at daily candles and the black line looking at a 2 or 4 hour candle, but I haven't figured out how to do that.
WaveTrend Momentum (Zeiierman)█ Overview
WaveTrend Momentum (Zeiierman) reveals the underlying rhythm of market movement through positive and negative momentum waves that visualize both sides of trend behavior. This dual-wave structure makes it easy to see how impulses and retracements interact in real time, helping you distinguish between a normal pullback within strength and the early signs of a trend losing momentum.
The indicator layers its waves with higher-timeframe trend alignment and adaptive context filters, mapping when momentum expands, when it fades, and where a pullback is approaching exhaustion or renewed trend strength is likely to emerge.
⚪ Why This One Is Unique
Unlike conventional wave oscillators, this design uses dual, phase-managed wave construction with adaptive scaling across symbols and timeframes. At its core is a three-mode Trend Strength engine (Adaptive, Stability, Structure) that dynamically adjusts to market conditions, supported by higher-timeframe regime sourcing and a dedicated impulse-and-divergence framework.
█ Main features
⚪ WaveTrend Momentum Waves
The foundation of the indicator lies in its ability to build positive and negative momentum waves that visualize both sides of market movement. This dual-wave structure makes it easy to identify trend direction, impulses, retracements, and exhaustion in real time, showing how momentum evolves within broader market phases. The waves can be used directly to gauge trend strength and direction, helping traders stay aligned with prevailing momentum or recognize when a shift is forming.
⚪ Extreme Moves
Extreme Zones highlight points where momentum reaches statistically stretched conditions, areas where price action often pauses, rebalances, or reverses. These zones help traders anticipate potential exhaustion before it becomes visible on price, improving timing for entries, exits, and scaling decisions.
⚪ Impulse Moves
Impulse Markers identify bursts of directional momentum, moments when trend energy expands sharply. These points often align with breakouts, accelerations, or continuation signals, helping traders focus on active opportunities rather than noise or consolidation.
⚪ Trend Strength
The Trend Strength Line adapts dynamically to shifting market regimes. It can operate in three modes: Adaptive, Stability, and Structure, each offering a different sensitivity level to trend changes. This feature helps confirm whether the trend is building, stabilizing, or losing strength, and serves as a foundation for bias filtering or trade direction confirmation.
⚪ Higher-Timeframe Trend Alignment
Integrates a higher-timeframe trend reference directly into the analysis, giving each wave context. This alignment clarifies when local pullbacks occur in harmony or conflict with the broader trend, making it easier to distinguish temporary corrections from true reversals.
⚪ Divergence Engine
A fully integrated divergence detection system that automatically spots both regular and hidden divergences between price and momentum. By surfacing early signs of trend weakening or continuation potential, it gives traders a structured way to detect subtle momentum shifts before they manifest in price.
█ How to Use
⚪ Trend Trading
WaveTrend Momentum excels as a trend-following framework by combining wave direction, Trend Strength, and higher-timeframe alignment to reveal when momentum is expanding or contracting within the broader market phase.
Note: To get trend waves, consider increasing the Wave Transition value to above 40.
Bullish WaveTrend Trend: When the positive momentum waves are above the neutral midpoint, the market is trending upward. Minor downward retracements within this structure often resolve back into trend continuation once buying pressure reasserts itself, particularly when the higher-timeframe context confirms a bullish regime.
Bearish WaveTrend Trend: When the negative wave dominates and remains below the midpoint, downside momentum controls the market. Minor upward retracements within this structure often resolve back into trend continuation once selling pressure reasserts itself, particularly when the higher-timeframe context confirms a bearish regime.
Bullish Trend Strength Line: A Trend Strength Line positioned above the midline indicates a bullish trend. A rising line reflects growing momentum and persistent buying pressure. The steeper the slope, the stronger the current regime. As long as the line continues to rise alongside positive waves, the trend remains structurally intact.
Bearish Trend Strength Line: A Trend Strength Line positioned below the midline indicates a bearish trend. A declining line reflects increasing selling pressure and persistent downside momentum. The steeper the slope, the stronger the current bearish regime. As long as the line continues to fall alongside negative waves, the trend remains structurally intact.
⚪ Momentum Trading
Momentum trading focuses on capturing the energy and force behind price movement, identifying whether the market is accelerating, losing steam, or preparing for a reversal. Momentum shifts can reveal temporary exhaustion, trend-strength continuation, or breakout acceleration before price action fully confirms it.
The indicator includes several features designed to detect and visualize momentum:
Waves: The core element of the indicator. The size and slope of the waves reflect the strength of momentum. Expanding waves indicate strong directional pressure, while contracting waves suggest cooling or consolidation.
Extreme Zones: When waves reach or exceed the extreme levels, the market enters statistically stretched conditions, signaling potential exhaustion or reversal zones. However, these events can also occur during strong trends, indicating continued strength in that direction. Market context is essential to determine whether an extreme should be interpreted as a reversal signal or as confirmation of trend momentum.
Impulse Markers: Highlight sudden bursts of momentum, often associated with breakouts or continuation events. Like Extreme Zones, Impulse Markers can appear within both reversals and strong trending phases. Context from price structure and higher timeframes helps identify whether the impulse reflects a trend-strength expansion or the final surge before exhaustion.
You can use any of these features to identify:
Breakouts: When Impulse or Extreme Markers align with expanding waves.
Reversals: When momentum reaches extreme levels followed by a fade in strength, it signals potential exhaustion before a structural shift. However, strong trends can also produce temporary fades that quickly recover, so context is key to distinguishing between true reversals and brief pauses within the trend.
⚪ Pullback Trading
Pullbacks represent short pauses or retracements within a prevailing trend. The combination of the Wave, Impulse Markers, and the Trend Strength Line helps identify when a pullback is maturing and when continuation is likely to resume.
Bullish WaveTrend and Trend Strength Pullback
In an uptrend, a brief dip in the negative wave, paired with a bullish Trend Strength, typically signals a healthy pullback rather than a reversal. When the negative wave begins to turn upward again, it confirms momentum recovery and potential for continuation.
Bearish WaveTrend and Trend Strength Pullback
In a downtrend, a short-lived rise in the positive wave while Trend Strength remains negative usually signals a counter-trend rally within weakness. As the positive wave fades and the negative wave expands again, downside continuation becomes more probable.
⚪ Divergence Trading
Divergence trading focuses on identifying moments when price and momentum move out of sync, signaling a potential shift in market direction or a slowdown in trend strength. These divergences often appear before reversals, consolidations, or major transitions in structure, making them a valuable early warning tool for traders.
The integrated Divergence Engine automatically detects these imbalances between price action and momentum. When price continues to move in one direction but momentum begins to fade, it suggests that the underlying strength driving the move is weakening.
█ How It Works
⚪ Wave Construction
The momentum wave is derived from phase-managed price smoothers, then normalized and bounded to express both positive and negative momentum within a single coherent structure.
Calculation: Composite moving frameworks with phase management, nonlinear rescaling, and amplitude companding to stabilize wave height and maintain consistent sensitivity.
⚪ Extremes
An auxiliary equilibrium tracker measures deviations from a dynamic mean to identify statistically stretched conditions in which momentum may begin to rebalance.
Calculation: Robust deviation mapping of a smoothed equilibrium series with adaptive thresholds for regime-consistent extremes.
⚪ Trend Strength Core
A tri-mode core measures directional persistence and adapts dynamically to changing market regimes, with optional higher-timeframe sourcing for context.
Calculation: Return-aggregated momentum with envelope gating (Adaptive), stability-biased curvature tracking (Stability), and structure-driven range midpoint logic (Structure).
⚪ Range & Regime Filter
A volatility-adjusted filter produces a smoothed state line and internal bias zones, allowing the indicator to contextualize momentum behavior within current volatility conditions.
Calculation: Volatility-normalized range synthesis with slow/fast quantization modes and optional smoothing to mitigate market chop.
⚪ Impulse Detection
Detects short-term bursts of directional energy and marks them as impulse events. These impulses highlight when momentum rapidly expands, often signaling breakouts, accelerations, or the end of low-volatility phases.
Calculation: Nonlinear impulse-response mapping that emphasizes higher-order rate changes while filtering out micro-noise.
⚪ Divergence Engine (Regular & Hidden)
Compares price swings against the wave’s momentum structure to identify early disagreement between price and internal strength.
Calculation: Swing-logic comparators analyze price relative to normalized wave amplitude to detect momentum shifts and potential divergence setups.
-----------------
Disclaimer
The content provided in my scripts, indicators, ideas, algorithms, and systems is for educational and informational purposes only. It does not constitute financial advice, investment recommendations, or a solicitation to buy or sell any financial instruments. I will not accept liability for any loss or damage, including without limitation any loss of profit, which may arise directly or indirectly from the use of or reliance on such information.
All investments involve risk, and the past performance of a security, industry, sector, market, financial product, trading strategy, backtest, or individual's trading does not guarantee future results or returns. Investors are fully responsible for any investment decisions they make. Such decisions should be based solely on an evaluation of their financial circumstances, investment objectives, risk tolerance, and liquidity needs.
Skrip berbayar
Frontrow SniperThe Sniper indicator combines various indicators together in an effort to predict accurate money making signals. The indicator lets you know when to long or short. So that your trades are spot on and there is no more need for FOMO. The Sniper indicator is the secret weapon you need to give you an edge to win in this market.
Frontrow Sniper is an all-in-one oscillator, allowing for more quality indications on your chart. It combines five well known algorithms (VWAP, MFI, RSI, Stochastic RSI, Wave Trend) which have all been fine-tuned for optimal results. When all of these indicators converge, sniper projects a green dot buy signal. The green dot is characterized by extreme sell momentum. In other words, it tells you to long when price is at the bottom. Making it extremely powerful.
the indicator is a wavetrend indicator
Whenever the 2 lines converge on each other a red sell signal or green buy singal will be created.
When the market is really overbought/oversold it will create a big buy or sell signal


