DeltalexИндикатор связывает спред (momentum=1) и объем. Если они большие на конкретном баре, то индикатор будет повышенным.
Также учитывается хвосты продаж и покупок. Например спред положительный, объем тоже, но хвост покупок составляет всего 10% от диапазона изменения цены на баре, тогда индикатор будет умножен на эти 10%, тем самым уменьшив его и показывая как бы, что да покупки есть но плохие.
Индикатор подкрашивается в зависимости от направления спреда, зелёный если momentum>1, красный если momentum<1
Скрип следует использовать с теорией VSA
Google translate:
The indicator connects spread (momentum = 1) and volume . If they are large on a particular bar, then the indicator will be raised.
The tails of sales and purchases are also taken into account. For example, the spread is positive, the volume is also, but the buy tail is only 10% of the price change range on the bar, then the indicator will be multiplied by these 10%, thereby decreasing it and showing, as it were, that there are but bad buys.
The indicator is colored depending on the direction of the spread, green if momentum> 1, red if momentum <1
Squeak should be used with VSA theory
VSA

Volume on bar VSA - signalЭтот индикатор сравнивает объем со средним его значением и обозначает бар в зависимости от того какой хвост на баре, бычий или медвежий.
В настройках можно задать сигнальную линию (чувствительность) для подкрашивания объемов, если он превышает эту линию. (на графике красная линия)
Сигнальная линия задаётся в процентах от среднего объема за указанный период.
Серым цветом показан средний объем.
Google translate.
This indicator compares the volume with its average value and designates a bar depending on which tail on the bar is bullish or bearish.
In the settings, you can set a signal line (sensitivity) for tinting volumes, if it exceeds this line. (red line on the chart)
The signal line is set as a percentage of the average volume for the specified period.
Gray indicates the average volume.

Volume on bar VSA - indicatorЭтот индикатор сравнивает объем со средним его значением и подкрашивает его в зависимости от того какой хвост на баре, бычий или медвежий.
В настройках можно задать сигнальную линию (чувствительность) для подкрашивания объемов, если он превышает эту линию. (на графике красная линия)
Сигнальная линия задаётся в процентах от среднего объема за указанный период.
Серым цветом показан средний объем.
Google translate
This indicator compares the volume with its average value and tints it depending on which tail on the bar is bullish or bearish.
In the settings, you can set a signal line (sensitivity) for tinting volumes, if it exceeds this line. (red line on the chart)
The signal line is set as a percentage of the average volume for the specified period.
Gray indicates the average volume.

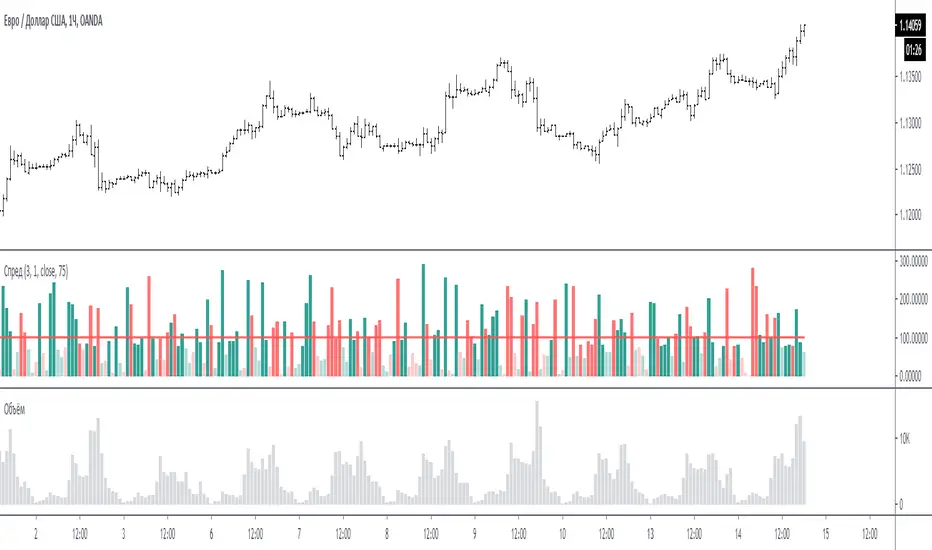
Spread for VSAЭтот индикатор сравнивает спрэд (расстояние от закрытия предыдущего бара до закрытия текущего бара или индикатор Momentum = 1) на периоде для сравнения.
На графике за 100 % принимается среднее значение спрэда за период для сравнения - красная линия. (по умолчанию период сравнения равен 3 - то есть три последних бара)
Размер бара на графике равен текущему спрэду по отношению к 100 %.
Если бар меньше 100 % то он ниже среднего, и наоборот если больше 100% то он больше среднего.
Если бар красный - спрэд отрицательный (текущее закрытие меньше предыдущего закрытия)
Если бар зелёный - спрэд положительный (текущее закрытие больше предыдущего закрытия)
Если бар меньше 75% то он будет окрашен в тусклый цвет (этот процент можно менять в настройках)
Если в настройках период спрэда указать больше 1, например 2, то спрэд будет равен закрытие мину закрытие через 1 бар назад. (это для экспериментов).
Примечание:
по умолчанию период для сравнения равен 3, но также интересен график и при значениях 15 и больше. Экспериментируйте.
По вопросам и предложениям пишите в комментариях.
Automatic translation google translate.
This indicator compares the spread (the distance from the closing of the previous bar to the closing of the current bar or the Momentum indicator = 1) on the period for comparison.
On the chart, the average spread value for the period for comparison is the red line, taken as 100%. (by default, the comparison period is 3 - that is, the last three bars)
The size of the bar on the chart is equal to the current spread with respect to 100%.
If the bar is less than 100%, then it is below average, and vice versa, if more than 100%, then it is more than average.
If the bar is red, the spread is negative (the current close is less than the previous close)
If the bar is green, the spread is positive (the current close is greater than the previous close)
If the bar is less than 75%, then it will be painted in a dull color (this percentage can be changed in the settings)
If in the settings the period of the spread is specified more than 1, for example 2, then the spread will be equal to closing mine closing after 1 bar back. (this is for experimentation).
Note:
the default period for comparison is 3, but the chart is also interesting for values of 15 or more. Experiment.
For questions and suggestions, write in the comments.
SOT INDICATOR for VSARussian language
SOT бар для VSA (Volume spread analysis)
Индикатор обозначает бары указывающие на остановку цены и возможный разворот.
Индикатор в первую очередь написан для таймфреймов от одного часа. На таймфреймах менее 1 часа сигнал будет приводить к неверным результатам, поскольку вечерние объемы существенно ниже дневных.
условие 1: закрытие текущего бара близко к закрытию предыдущего (достигается путём сравнения среднего диапазона последних 5 баров)
sma(high-close,5) - это средний диапазон за 5 баров
итого получается разница между закрытиями меньше 1/2 среднего диапазона за последние 5 баров.
Условие 2: должен быть хвост продаж или покупок (критерий - составляет не менее 2/3 от всего диапазона бара)
Условие 3: объемы должны быть увеличивающиеся (я взял, что текущей объем должен быть больше среднего за последние 5 баров)
Индикатор следует использовать совместно с теорией VSA.
English language (Google Translate)
SOT bar for VSA
The indicator indicates bars indicating a stop of the price and a possible reversal.
The indicator is primarily written for time frames from one hour. On time frames of less than 1 hour, the signal will lead to incorrect results, since evening volumes are significantly lower than daily volumes.
Condition 1: closing the current bar is close to closing the previous one (achieved by comparing the average range of the last 5 bars)
sma (high-close, 5) is the average range for 5 bars
total, the difference between closures is less than 1/2 of the average range for the last 5 bars.
Condition 2: there must be a tail of sales or purchases (the criterion is at least 2/3 of the entire range of the bar)
Condition 3: volumes must be increasing (I took that the current volume should be more than the average for the last 5 bars)
The indicator should be used in conjunction with VSA theory.

Volume DensityA group of two indicators:
The "Volume Density" shows how much volume was thrown out relative to the covered price range.
The "Volume Density Bars" shows the same, but with colour on top of the bar chart.

Delta Divergence(modified)Modified Volume Delta Divergence indicator originally made by @dutta.anupam.02, with some visual modifications. First numbers show delta others are bid and ask volume

Volume Spread Analysis Indicators [Volume Trader]This indicator is based on Volume and Price spread analysis developed by tom williams.
It shows following indicators based on price range and volume data
Bearish Indicators
1. Buying climax
2. End of Rising Market
3. Upthrust
4. Smart selling
5. No Demand
6. VDD
Bullish Indicators
1. Selling Climax
2. End of falling
3. Stop Volume
4. Reverse Upthrust
5. Shakeout
6. VDU
6. No supply

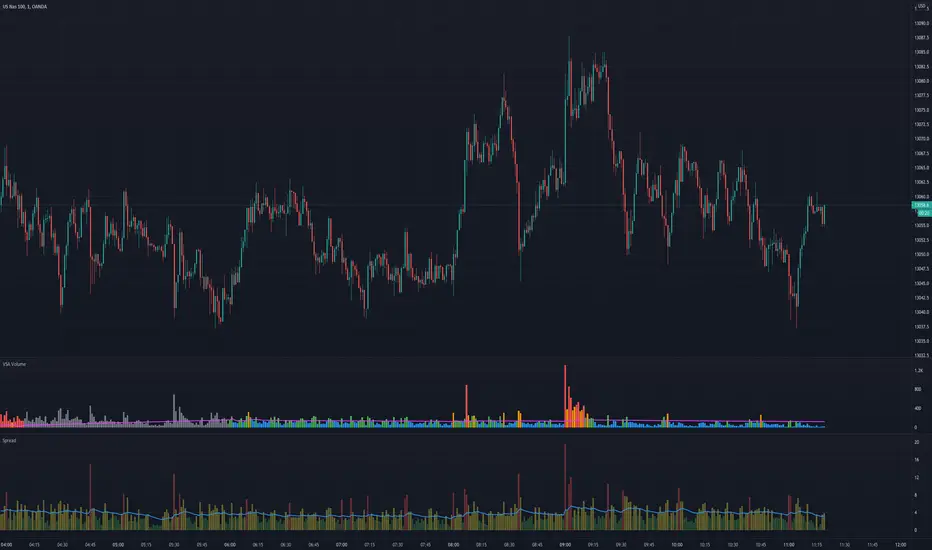
VSA VolumeVolume indicator judging level of volume per bar accordingly to Volume Spread Analysis rules. It allows either to set static volume levels or dynamic ones based on ratio comparable to Moving Average. Bars are coloured based on ratio or static levels, visually presenting level of Volume (low, average, high, ultra high).

VSA SpreadMeasures spread of the candle, useful especially for Volume Spread Analysis (VSA) and to measure trend strength. Spread is coloured based on level comparable to Moving Average.
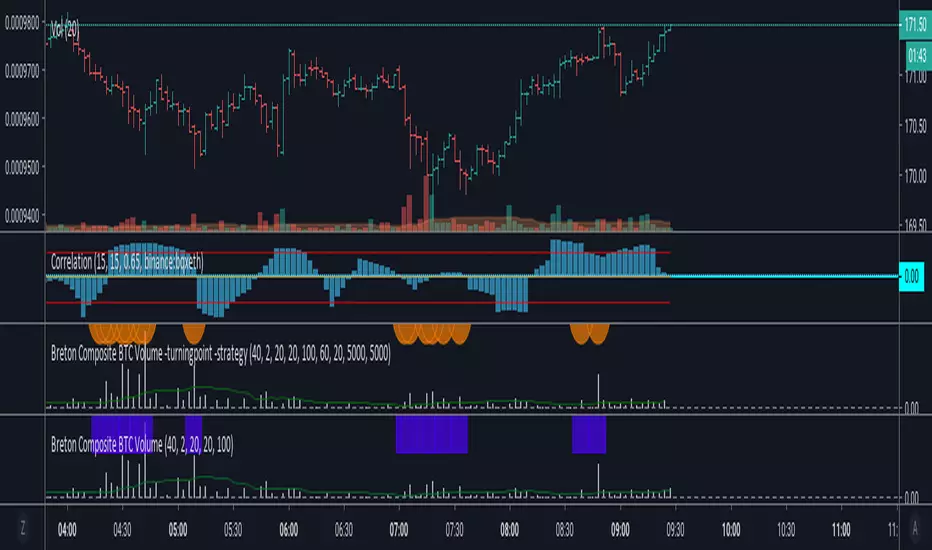
VSA Trading Assistant DashboardThe VSA Trade Assistant is a fully featured data dashboard and information management tool that visually tracks, analyzes and displays key performance indicators in any BTC related market on Trading View
This indicator recognizes climatic up and down bars including when their vol is very high (at least 100 percent of the bar is above the average vol line) and when the subsequent bar is in the opposite direction of the climactic move.
The composite volume of 7 different exchanges is used by this indicator to determine when climactic volume has occurred.
Leave feedback, we'll be adding features to this indicator over time

ITS (Indicator of Turn's Success)IUS (or indicator of Turn's success) indicates either the changes in trend are real and major or minor and trend will continue any time soon. When the orange line (volume sma) gets over white line (the MFI ema) and then returns back, it indicates that the changes has been major. It happens cuz orange line : volumes increase greatly when the accumulation is started or finished, rise much faster than white line (MFI include also spread, so it takes longer time to get sure, that the change is major). Also there is a standart tool of VSA to indicate PRO - volumes. White - great volumes (often changes), green (good in trend), violet (minor moves) and brown (moves w/ no volumes usually just a rest in the trend)


Volume Extension [DepthHouse]DepthHouse Volume Extension uses average calculations to determine the dynamic range which the volume travels through. Any spike above the line represents an over extension in average volume.
The colored bars are then calculated in a similar way, which measures a combination of both price and volume action to determine bull & bear exhaustion levels, and possible entry/exit points for big players.
This indicator is 100% free , so if you benefit from using it, please consider supporting me by checking out the several other indicators available on my page :)

Breton Composite BTC Real10 VolumeComposite for BTC vol from the following Exchanges:
Binance
Bitstamp
Bitfinex
Coinbase
Kraken
Bittrex
Poloniex
ItBit
Gemini
BitFlyer

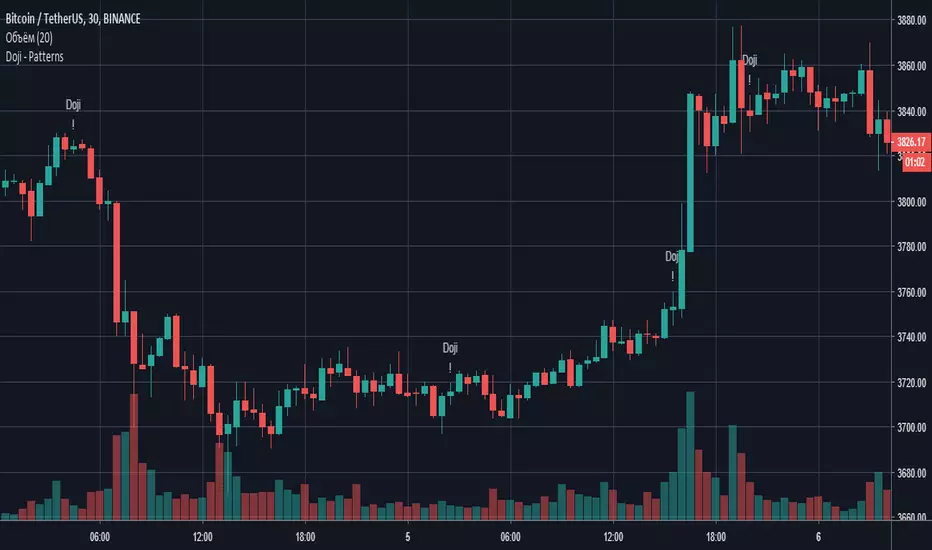
Doji - PatternsПаттерн "Доджи" - показывает равновесие сил продавцов и покупателей. Хотя сам по себе этот паттерн не является сигналом к открытию сделки, не стоит его всегда игнорировать. Доджи встречается в более сложных паттернах, состоящих из двух - трех свечей, например: "Утренняя звезда", "Вечерняя звезда" и "Крест харами" (подробнее о них я расскажу в своих следующих публикациях). Часто появление данного паттерна указывает на окончание трендового движения и/или начале "рэнджа".
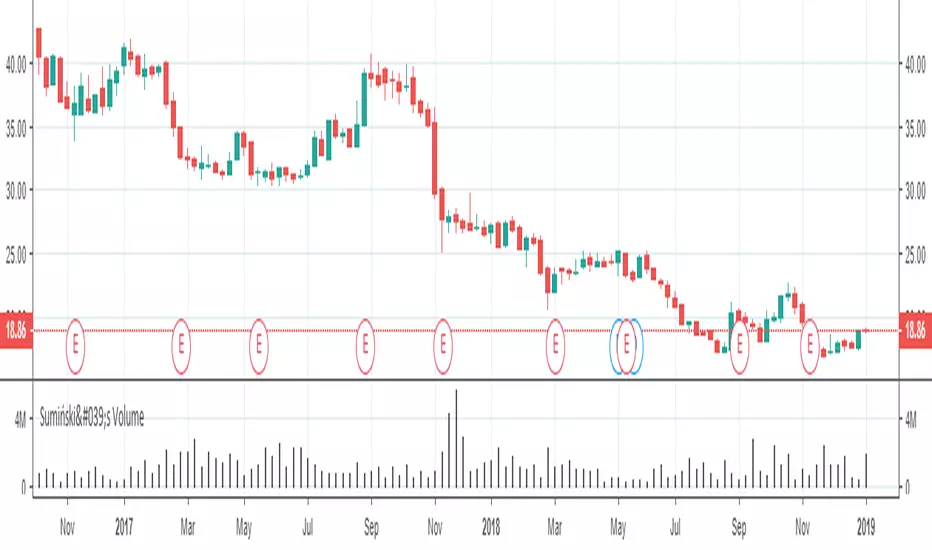
Sumiński's VolumeHello, this indicator shows us the trading activity in the selected time period. It's similar to the tick volume, the difference being that this indicator is based on real volume. It measures the average amount of volume per 1 pips price in the selected time period. It is useful when after the end of the trend the price comes into consolidation, if at the levels close to support or resistance the indicator shows a high value - it means that there is an intense exchange of contracts or shares - which means that this price level is considered by the market as important.
Sorry for my English and good luck in the markets.
Institucional Color Candle Idea extracted from the books by Anna Coulling ,Gavin Holmes and Tin Ord, using Volume and Spread Analysis (VSA) techniques coupled with Al Brooks' expertise with Price Action these candles are magical, identify the exact moment
of the performance of the big players are acting in the market represented by the colors:
1) Red Candles we have an Ultra High activity,
2) Candles Orange we have a Very High Activity
3) Candles Yellow we have one High Activity
4) White Candles represent normal activity in the market
5) Blue Candles, market activity is very low without interest in the continuation of the movement here I fear we usually have the end of the wave of a pullbacks
www.mql5.com

Average buyer/seller priceThis script shows average buyer or seller price since the last bar you define.
The bar is defined by the condition low/high less or greater than specific value.
Recommended to use 15/30 or 1h timerame (the less the better).
The error is about 1%.
Blue - Buyer
Red - Seller.
