Swing Data - SimplifiedThe swing data indicator by jfsrev but simplified. Thank you jfsrev for your work! Indikator Pine Script®oleh cimmarron18
Continuation Suite v1 — 5m/15mContinuation Suite v1 — 5m/15m (Non-Repainting, S/R + Trend Continuation) What it does Continuation Suite v1 is a practical intraday toolkit that combines non-repainting trend-continuation signals with auto-built Support/Resistance (S/R) from confirmed pivots. It’s designed for fast, liquid names on 5m charts with an optional 15m higher-timeframe (HTF) overlay. You get: stacked-EMA bias, disciplined pullback+reclaim entries, optional volume/volatility gates, a “Strong” signal tier, solid S/R lines or zones, and a compact dashboard for fast reads. ⸻ Why traders use it • Clear bias using fast/mid/slow EMA stacking. • Actionable entries that require a pullback, a reclaim, and (optionally) a minor break of prior extremes. • Signal quality gates (volume vs SMA, ATR%, ADX/DI alignment, EMA spacing, slope). • Non-repainting logic when “Confirm on Close” = ON. Intrabar previews show what’s forming, but confirmed signals only print on bar close. • S/R that matters: confirmed-pivot lines or ATR-sized zones, optional HTF overlay, and auto de-dup to avoid clutter. ⸻ Signal construction (no magic, just rules) Bullish continuation (base): 1. Trend: EMA fast > EMA mid > EMA slow 2. Pullback: price pulls into the stack (lowest low or close vs EMA fast/mid over a lookback) 3. Reclaim: close > EMA fast and close > open 4. Break filter (optional): current bar takes out the prior bar’s high 5. Filters: volume > SMA (if enabled) and ATR% ≤ max (if enabled) 6. Cooldown: a minimum bar gap between signals Bearish continuation (base): mirror of the above. Strong signals: base conditions plus ADX ≥ threshold, DI alignment (DI+>DI- for longs; DI->DI+ for shorts), minimum EMA-spacing %, and minimum fast-EMA slope. Reference stops: • Longs: lowest low over the pullback lookback • Shorts: highest high over the pullback lookback Alerts are included for: Bullish Continuation, Bearish Continuation, STRONG Bullish, STRONG Bearish. ⸻ S/R engine (current TF + optional HTF) • Builds S/R from confirmed pivots only (left/right bars). • Choose Lines (midlines) or Zones (ATR-sized). • Zones merge when a new pivot lands near an existing zone’s mid (ATR-scaled epsilon). • Touches counter tracks significance; you can require a minimum to draw. • HTF overlay (default 15m) draws separate lines/zones with tiny TF tags on the right. • De-dup option hides current-TF zones that sit too close to HTF zones (ATR-scaled), reducing overlap. • Freeze on Close (optional) keeps arrays stable intrabar; snapshots show levels immediately as bars open. ⸻ Presets • Auto: Detects QQQ-like tickers (QQQ, QLD, QID) or SoFi; else defaults to Custom. • QQQ: Tighter ATR% and EMA settings geared to index-ETF behavior. • SoFi: Wider ATR allowances and longer mid/slow for single-name behavior. • Custom: Expose all key inputs to tune for your product. ⸻ Dashboard (top-right) • Preset in use • Bias (Bullish CONT / Bearish CONT / Neutral) • Strong (Yes/No) • Volatility (ATR% bucket) • Trend (ADX bucket) • HTF timeframe tag • Volume (bucket or “off”) • Signals mode (Close-Confirmed vs Intrabar) ⸻ Inputs you’ll actually adjust Trend/Signals • Fast/Mid/Slow EMA lengths • Pullback lookback, Min bars between signals • Volume filter (vol > SMA N) • ATR% max filter (cap excessive volatility) • Require break of prior bar’s high/low • “Strong” gates: min EMA slope, min EMA spacing %, ADX length & threshold Support/Resistance • Lines vs Zones • Pivot left/right bars • Extend left/right (bars) • Max pivots kept (current & HTF) • Zone width (× ATR), Merge epsilon (× ATR), Min gap (× ATR) • Min touches, Max zones per side near price • De-dup current TF vs HTF (× ATR) Repainting control • Confirm on Close: when ON, signals/SR finalize on bar close (non-repainting) • Freeze on Close: freeze S/R intrabar with snapshot updates • Show previews: translucent intrabar labels for what’s forming ⸻ How to use it (straightforward) 1. Load on 5-minute chart (baseline). Keep Confirm on Close ON if you hate repainting. 2. Use Bias + Strong + S/R context. If a long prints into HTF resistance, you have information. 3. Manage risk off the reference stop (pullback extreme). If ATR% reads “Great,” widen expectations; if “Poor,” size down or pass. 4. Alerts: wire the four alert types to your workflow. ⸻ Notes and constraints • Designed for liquid symbols. Thin books and synthetic “volume” will degrade the volume gate. • S/R is pivot-based. On very choppy tape, touch counts help. Increase min touches or switch to Lines to declutter. • If your chart timeframe isn’t 5m, behavior changes because lengths are in bars, not minutes. Tune lengths accordingly. ⸻ Disclaimers This is a research tool. No signals are guaranteed. Markets change, outliers happen, slippage is real. Nothing here is financial advice—use your own judgment and risk management. ⸻ Author: DaddyScruff License: MPL-2.0 (Mozilla Public License 2.0)Indikator Pine Script®oleh DaddyScruffDiupdate 124
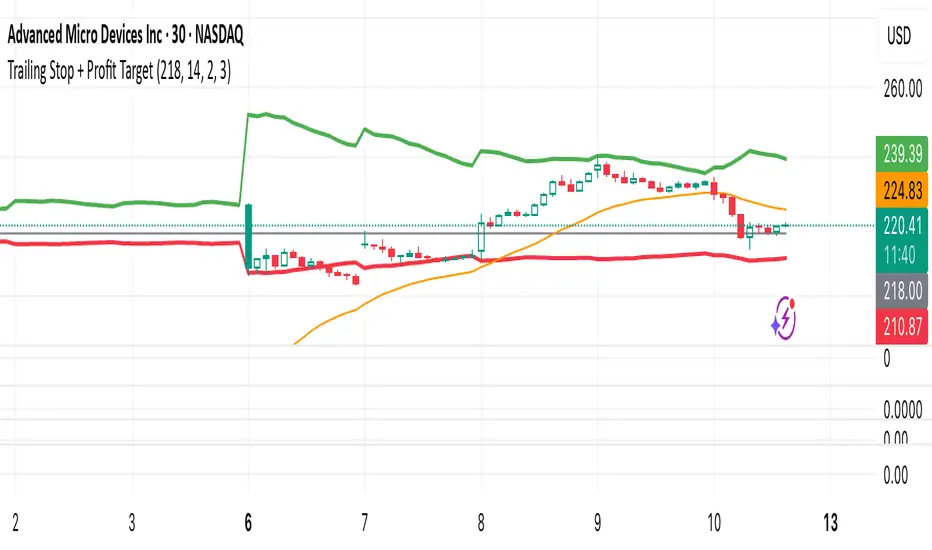
Trailing Stop + Profit TargetTrailing Stop + Exit Confirmation is a manual-entry tool designed to help traders visually manage trades with dynamic trailing stops and profit targets, based on ATR projections with a toggle button to reset calculations in real-time. Contains a “Short” toggle to work for short positions as well, which automatically inverses the PT and SL lines when toggled on. Primary Calculations: Utilizes a manually adjustable entry price (default: $5 — ideal for options traders) that (when adjusted and recalculated) populates the chart with an adaptive ATR-based trailing stop line, dynamic profit target line, and optional 21-day EMA for directional context. Below the Entry Price is a fully functional, manual reset toggle to reset all parameters mid-session to assess risk-reward based on entry price, risk tolerance, etc. followed by the “Short” toggle. Primary Directions/Functions: Enter your trade price in the “Manual Entry Price” field. The script will begin plotting a dynamic trailing stop and profit target based on current market conditions. Use the reset toggle to clear all calculations and start a new position at any time. Customizable Settings: ATR Length and Multiplier Risk/Reward Profit Target Multiplier Toggle to show/hide trailing stop, target, and EMA lines Options Trading Use Case: This tool is especially useful for options traders looking to manage premium-based entries (e.g., $5.00) on intraday or swing trades. The dynamic stop and target lines provide clear visual cues for scaling out or exiting based on price action, while allowing for tighter or looser risk depending on volatility (ATR). This tool does not auto-detect entries or backtest positions. It is intended to complement your entry signals, not generate them. I've written an Options Momentum Signal indicator you can find right here which functions well in tandem with this tool. Made for traders who execute trades manually and want typical preset guidelines for profit and stop loss signals but lets you recalculate them by simply clicking a button, especially if any major news or downturn causes a big change in market conditions so you can make adjustments in real time.Indikator Pine Script®oleh TylerisTrading19
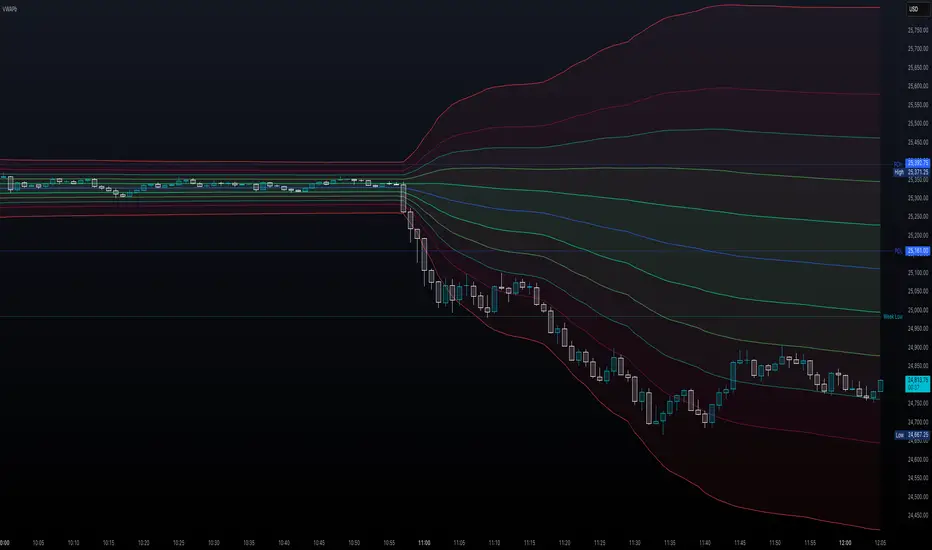
Volume Weighted Average Price Band Extension## Volume Weighted Average Price Band Extension (VWAPb) **Volume Weighted Average Price Band Extension** is an enhanced VWAP indicator that extends the traditional three-band system to include up to **five configurable standard deviation bands**, making it particularly well-suited for analyzing volatile market conditions where price action frequently extends beyond conventional boundaries. ### Key Features **Extended Band System** Unlike standard VWAP indicators that typically offer three bands, this indicator provides five independently configurable bands with customizable multipliers (default: 0.5x, 1.0x, 1.5x, 2.0x, and 3.0x). Each band can be toggled on or off, allowing traders to adapt the display to current market volatility and their specific trading strategy. **Dual Calculation Modes** The indicator offers flexibility in how bands are calculated: - **Standard Deviation Mode**: Traditional statistical approach measuring price dispersion from the VWAP - **Percentage Mode**: Distance calculated as a percentage of VWAP (1 multiplier = 1%), useful for comparing relative moves across different price levels **Flexible Anchor Periods** Calculate VWAP from multiple timeframes and events: - Time-based: Session, Week, Month, Quarter, Year, Decade, Century - Event-based: Earnings reports, Dividend announcements, Stock splits - Customizable source (default: hlc3) **Visual Clarity** Color-coded bands with semi-transparent fills between upper and lower boundaries help identify key support and resistance zones at a glance. The indicator automatically hides on daily and higher timeframes when enabled, keeping charts clean. ### Ideal For - **Volatile Markets**: The extended band system captures extreme price movements that often exceed traditional 2-3 standard deviation bounds - **Scalping & Day Trading**: Multiple bands provide granular entry and exit zones for short-term trades - **Mean Reversion Strategies**: Identify overextended price action relative to volume-weighted fair value - **Institutional Order Flow Analysis**: VWAP remains a key benchmark for institutional execution ### How It Works The Volume Weighted Average Price represents the average price weighted by volume throughout the selected anchor period. The surrounding bands act as dynamic support and resistance levels, with each successive band representing areas of increasing deviation from the volume-weighted mean. In volatile conditions, price may regularly test the outer bands (2.0x, 3.0x), which would be invisible on standard three-band implementations. **Trading Applications:** - Price near outer bands (±2.0x, ±3.0x) may signal exhaustion and potential reversal opportunities - Price oscillating between inner bands (±0.5x, ±1.0x) indicates consolidation - VWAP itself acts as a dynamic pivot point—bullish above, bearish below ### Settings Overview - **VWAP Settings**: Anchor period selection, source input, offset capability, option to hide on D/W/M timeframes - **Bands Settings**: Toggle each of the five bands independently, adjust multipliers, choose between Standard Deviation or Percentage calculation mode --- **Note**: This indicator requires volume data to function properly. A runtime error will display if volume data is unavailable for the selected symbol. **Disclaimer**: This indicator is designed for technical analysis and should be used in conjunction with other forms of analysis and proper risk management. Past performance and indicator signals do not guarantee future results.Indikator Pine Script®oleh rdjxyz48
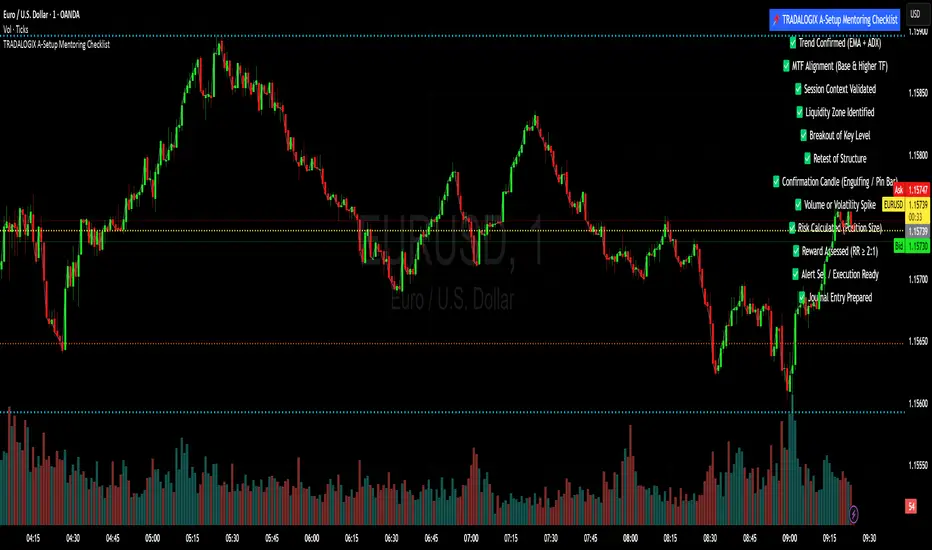
TRADALOGIX A-Setup Mentoring Checklist97% of traders (new or old) sometime forget that to win the markets consistently, you have to be consistent in your thought process as well. Many that come to me desire only to know the secrets to my trading success. And I ask the same question to each and everyone: What are your steps in finding, validating & executing the best trade possible? Majority of the times, they know of only 3-5 points to consider when trading. Hence the reason why many traders fail. This led me down to compiling a 1000 trader survey. It resulted in finding the reasons for trader failures. Most traders were unaware of some of the critical steps in finding, validating & executing the A-Setup trade of the day. Once launched, you will find the critical steps in processing your setup. No one item should be ignored if you are seeking consistency in your trading. Good luck. Indikator Pine Script®oleh DrPipstone16
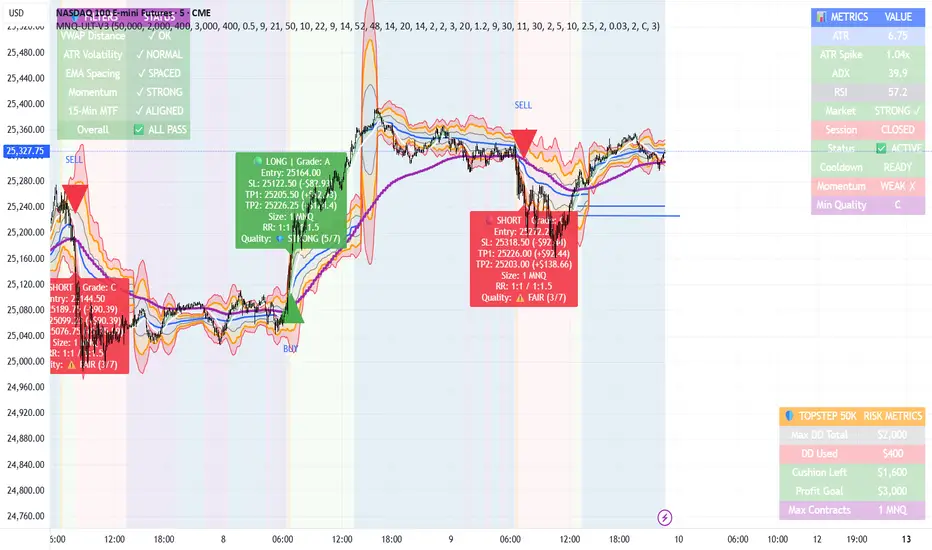
MNQ TopStep 50K | Ultra Quality v3.0MNQ TopStep 50K | Ultra Quality v3.0 - Publish Summary📊 OverviewA professional-grade trading indicator designed specifically for MNQ futures traders using TopStep funded accounts. Combines 7 technical confirmations with 5 advanced safety filters to deliver high-quality trade signals while managing drawdown risk.🎯 Key FeaturesCore Signal System 7-Point Confirmation: VWAP, EMA crossovers, 15-min HTF trend, MACD, RSI, ADX, and Volume Signal Grading: Each signal is rated A+ through D based on 7 quality factors Quality Threshold: Adjustable minimum grade requirement (A+, A, B, C, D) Advanced Safety Filters (Customizable) Mean Reversion Filter - Prevents chasing extended moves beyond VWAP bands ATR Spike Filter - Avoids trading during extreme volatility events EMA Spacing Filter - Ensures proper trend separation (optional) Momentum Filter - Requires consecutive directional bars (optional) Multi-Timeframe Confirmation - Aligns with 15-min trend (optional) TopStep Risk Management Real-time drawdown tracking Position sizing calculator based on remaining cushion Daily loss limit monitoring Consecutive loss protection Max trades per day limiter Visual Components VWAP with 1σ, 2σ, 3σ bands EMA 9/21 with cloud fill 15-min EMA 50 for HTF trend Comprehensive metrics dashboard Risk management panel Filter status panel Detailed trade labels with entry, stops, and targets ⚙️ Default Settings (Balanced for Regular Signals)Technical Indicators Fast EMA: 9 | Slow EMA: 21 | HTF EMA: 50 (15-min) MACD: 10/22/9 RSI: 14 period | Thresholds: 52 (buy) / 48 (sell) ADX: 14 period | Minimum: 20 ATR: 14 period | Stop: 2x | TP1: 2x | TP2: 3x Volume: 1.2x average required Session Settings Default: 9:30 AM - 11:30 AM ET (adjustable) Avoids first 15 minutes after market open Customizable trading hours Safety Filters (Default Configuration) ✅ Mean Reversion: Enabled (2.5σ max from VWAP) ✅ ATR Spike: Enabled (2.0x threshold) ❌ EMA Spacing: Disabled (can enable for quality) ❌ Momentum: Disabled (can enable for quality) ❌ MTF Confirmation: Disabled (can enable for quality) Risk Controls Minimum Signal Quality: C (adjustable to A+ for fewer/better signals) Min Bars Between Signals: 10 Max Trades Per Day: 5 Stop After Consecutive Losses: 2 📈 Expected PerformanceWith Default Settings: Signals per week: 10-15 trades Estimated win rate: 55-60% Risk-Reward: 1:2 (TP1) and 1:3 (TP2) With Aggressive Settings (Min Quality = D, All Filters Off): Signals per week: 20-25 trades Estimated win rate: 50-55% With Conservative Settings (Min Quality = A, All Filters On): Signals per week: 3-5 trades Estimated win rate: 65-70% 🚀 How to UseBasic Setup: Add indicator to MNQ 5-minute chart Adjust TopStep account settings in inputs Set your risk per trade percentage (default: 0.5%) Configure trading session hours Set minimum signal quality (Start with C for balanced results) Signal Interpretation: Green Triangle (BUY): Long signal - all confirmations aligned Red Triangle (SELL): Short signal - all confirmations aligned Label Details: Shows entry, stop loss, take profit levels, position size, and signal grade Signal Grade: A+ = Elite (6-7 points) | A = Strong (5) | B = Good (4) | C = Fair (3) Dashboard Monitoring: Top Right: Technical metrics and market conditions Top Left: Filter status (which filters are passing/blocking) Bottom Right: TopStep risk metrics and position sizing ⚡ Customization TipsFor More Signals: Lower "Minimum Signal Quality" to D Decrease ADX threshold to 18-20 Lower RSI thresholds to 50/50 Reduce Volume multiplier to 1.1x Disable additional filters For Higher Quality (Fewer Signals): Raise "Minimum Signal Quality" to A or A+ Increase ADX threshold to 25-30 Enable all 5 advanced filters Tighten VWAP distance to 2.0σ Increase momentum requirement to 3-4 bars For TopStep Compliance: Adjust "Max Total Drawdown" and "Daily Loss Limit" to match your account Update "Already Used Drawdown" daily Monitor the Risk Panel for cushion remaining Use recommended contract sizing 🛡️ Risk DisclaimerIMPORTANT: This indicator is for educational and informational purposes only. Past performance does not guarantee future results All trading involves substantial risk of loss Use proper risk management and position sizing Test thoroughly in paper trading before live use The indicator does not guarantee profitable trades Adjust settings based on your risk tolerance and trading style Always comply with your broker's and TopStep's rulesIndikator Pine Script®oleh elivgorelick79
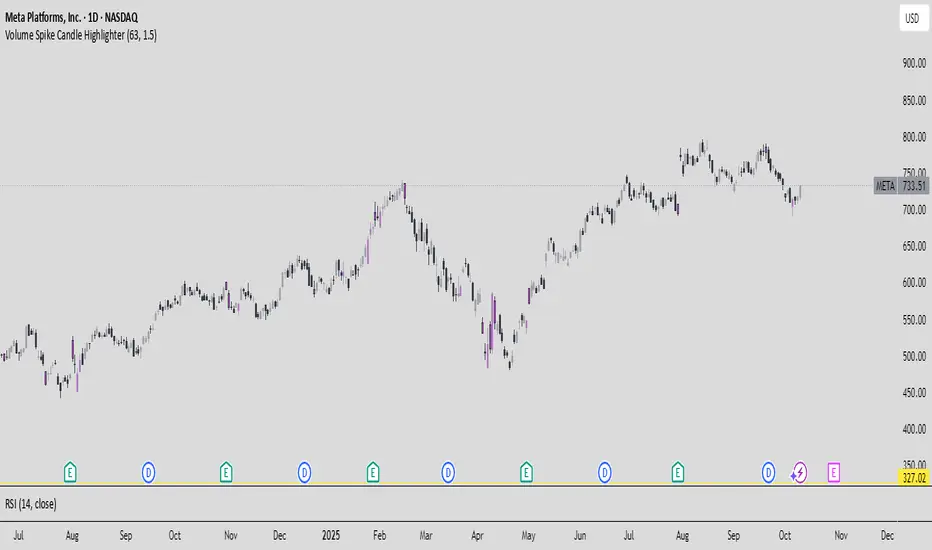
Finlay's Volume Spike Candle HighlighterFinding unusual spikes in volume compared to the mean. Indikator Pine Script®oleh finlayjacks20178
MNQ Morning Indicator | Clean SignalsMNQ Morning Trading Indicator Summary What It Does This is a TradingView indicator designed for day trading MNQ (Micro Nasdaq-100 futures) during morning sessions. It generates BUY and SELL signals only when multiple technical conditions align, helping traders identify high-probability trade setups. Core Strategy BUY Signal Requirements (All must be true): ✅ Price above VWAP (volume-weighted average price) ✅ Fast EMA (9) above Slow EMA (21) - uptrend confirmation ✅ Price above 15-minute 50 EMA - higher timeframe confirmation ✅ MACD histogram positive - momentum confirmation ✅ RSI above 55 - strength confirmation ✅ ADX above 25 - trending market (not choppy) ✅ Volume 1.5x above average - strong participation SELL Signal (opposite conditions) Key Features 🎯 Risk Management Stop Loss: 2× ATR (Average True Range) Take Profit 1: 2× ATR (1:2 risk-reward) Take Profit 2: 3× ATR (1:3 risk-reward) Dollar values: Calculates P&L based on MNQ's $2/point value ⏰ Session Filter Default: 9:30 AM - 11:30 AM ET (customizable) Safety feature: Avoids first 15 minutes (high volatility period) Won't generate signals outside trading hours 🛡️ Signal Quality Rates each signal: 🔥 STRONG, ⚡ MEDIUM, or ⚠️ WEAK Requires minimum 15 bars between signals (prevents overtrading) 📊 Visual Dashboard Shows real-time metrics: ATR values ADX (trend strength) RSI (momentum) Market condition (TREND/CHOP) Session status Volume status Signal cooldown timer Visual Elements 📈 VWAP with standard deviation bands (1σ, 2σ, 3σ) 📉 Multiple EMAs with trend-based coloring 🟢/🔴 Buy/Sell arrows on chart 📋 Detailed trade labels showing entry, SL, TPs, and risk-reward ratios 🎨 Background highlighting for market conditions Safety Features Cooldown period between signals Session restrictions (no trading outside set hours) First 15-minute avoidance (post-open volatility) Multi-confirmation requirement (all 7 conditions must align) Trend filter (ADX minimum to avoid choppy markets) Best For Day traders focused on morning sessions MNQ futures traders Traders who prefer systematic, rule-based entries Those wanting pre-calculated risk management levels Customization All parameters are adjustable: EMA periods MACD settings RSI thresholds ADX minimum ATR multipliers Session times Visual preferences This indicator is designed to be conservative — it waits for strong confirmation before signaling, which means fewer but potentially higher-quality trades.Indikator Pine Script®oleh elivgorelick1187
cd_VWAP_mtg_CxCd_VWAP_mtg_Cx Overview The most important condition for being successful and profitable in the market is to consistently follow the same rules without compromise, while the price constantly moves in countless different ways. Regardless of the concept or trading school, those who have rules win. In this indicator, we will define and use three main sections to set and apply our rules. The indicator uses the VWAP (Volume Weighted Average Price) — price weighted by volume. Two VWAPs can be displayed either by manually entering date and time, or by selecting from the menu. From the menu, you can select the following reference levels: • HTF Open: Opening candle of the higher timeframe • ATH / ATL: All-Time High / All-Time Low candles • PMH / PML, PWH / PWL, PDH / PDL, PH4H / PH4L: Previous Month, Week, Day, or H4 Highs/Lows • MH / ML, WH / WL, DH / DL, H4H / H4L: Current Month, Week, Day, or H4 Highs/Lows Additionally, it includes: • Mitigation / Order Block zones (local buyer-seller balance) across two timeframes. • Buy/Sell Side Liquidity levels (BSL / SSL) from the aligned higher timeframe (target levels). ________________________________________ Components and Usage 1 – VWAP Calculated using the classical method: • High + Volume for the upper value • Close + Volume for the middle value • Low + Volume for the lower value The VWAP is displayed as a colored band, where the coloring represents the bias. Let’s call this band FVB (Fair Value Band) for ease of explanation. The FVB represents the final line of defense, the buyer/seller boundary, and in technical terms, it can be viewed as premium/discount zones or support/resistance levels. Within this critical area, the strong side continues its move, while the weaker side is forced to retreat. But does the side that breaks beyond the band always keep going? We all know that’s not always the case — in different pairs and timeframes, price often violates both the upper and lower edges multiple times. To achieve more consistent analysis, we’ll define a new set of rules. ________________________________________ 2 – Mitigation / Order Blocks In trading literature, there are dozens of different definitions and uses of mitigation or order blocks. Here, we will interpret the candlesticks to create our own definition, and we’ll use the zones defined by candles that fit this pattern. For simplicity, let’s abbreviate mitigation as “mtg.” For a candle to be selected as an mtg, it must clearly show strength from one side (buyers or sellers) — which can also be observed visually on the chart. ________________________________________ Bullish mtg criteria: 1. The first candle must be bullish (close > open) → buyers are strong. 2. The next candle makes a new high (buyers push higher) but fails to close above and pulls back to close inside the previous range → sellers react. It also must not break the previous low → buyers defend. 3. In the following candle(s), as long as the first candle’s low is protected and the second candle’s high is broken, it indicates buyer strength → a bullish mtg is confirmed. When price returns to this zone later (gets mitigated), the expectation is that the zone holds and price pushes upward again. If the low is violated, the mtg becomes invalid. In technical terms: If the previous candle’s high is broken but no close occurs above it, the expectation is a reversal move that will retest its low. Question: What if the low is protected and in the next candle(s) a new high forms? Answer: → Bullish mtg. Bearish mtg (opposite) 3 – Buy/Sell Side Liquidity Levels With the help of the aligned higher timeframe (swing points), we will define our market structure framework and set our liquidity targets accordingly. Let’s put the pieces together. If we continue explaining from a trade-focused perspective, our first priority should be our bias — our projection or expectation of the market’s potential movement. We will determine this bias using the FVB. Since we know the band often gets violated on both sides, we want the price action to convince us of its strength. To do that, we’ll use the first candle that closes beyond the band. The distance from that candle’s high to low will be our threshold range Bullish level = high + (candle length × coefficient) Bearish level = low - (candle length × coefficient) When the price closes beyond this threshold, it demonstrates strength, and our bias will now align in that direction. How long will this bias remain valid? → Until a closing candle appears on the opposite side of the band. If a close occurs on the opposite side, then a new bias will only be confirmed once the new threshold level is broken. During the period in between, we have no bias. Let’s continue on the chart: Now that our bias has been established, where and how do we look for trade opportunities? There are two possible entry approaches: • Aggressive entry: Enter immediately with the breakout. • Conservative entry: Wait for a pullback and enter once a suitable structure forms. (The choice depends on the user’s preference.) At this stage, the user can apply their own entry model. Let’s give an example: Let’s assume we’re looking for setups using HTF sweep + LTF CISD confirmation. Once our bias turns bearish, we look for an HTF sweep forming on or near an FVB or mtg block, and then confirm the entry with a CISD signal. In summary: • FVB defines the bias, the entry zone, and the target zone. • Mtg blocks represent entry zones. • BSL / SSL levels suggest target zones. Overlapping FVB and mtg blocks are expected to be more effective. The indicator also provides an option for a second FVB. A band attached to a lower timeframe can be used as confirmation. • Main band: Bias + FVB • Extra band: Entry trigger confirmed by a close beyond it. Mtg blocks can provide trade entry opportunities, especially when the price is moving strongly in one direction (flow). Consecutive or complementary mtg blocks indicate that the price is decisive in one direction, while sometimes also showing areas where we should wait before entering. Mtg blocks that contain an FVG (Fair Value Gap) within their body are expected to be more effective. Settings: The default values are set to 1-3-5m, optimized for scalping trades. VWAP settings: Main VWAP (FVB): • Can be set by selecting a start time, manually entering date and time, or choosing a predefined level. Extra VWAP (FVB): • Set from the menu. If not needed, select “none.” • Visibility, color, and fill settings for VWAP are located here. • Threshold levels visibility and color options are also in this section. • The multiplier is used for calculating the threshold level. Important: • If the Extra VWAP is selected but not displayed, you need to increase the chart timeframe. o Example: If the chart is on 3m and you select WH from the extra options, it will not display correctly. • Upper limits for VWAP: o 1m and 3m charts: daily High/Low o 5m chart: weekly High/Low ________________________________________ Mtg Settings: • Visibility and color settings for blocks are configured here. • To display on a second timeframe, the box must be checked and the timeframe specified. • Optional display modes: “only active blocks,” “only last violated mtg,” or “all.” • For confirmation and removal criteria, choosing high/low or close determines the source used for mtg block formation and deletion conditions. BSL/SSL Settings: • Visibility, color, font size, and line style can be configured in this section. When “Auto” is selected, the aligned timeframe is determined automatically by the indicator, while in manual mode, the user defines the timeframe. Final Words: Simply opening trades every time the price touches the VWAP or mtg blocks will not make you a profitable trader. Searching for setups with similar structures while maintaining proper risk management will yield better results in the long run. I would be happy to hear your feedback and suggestions. Happy trading! Indikator Pine Script®oleh cdikici71Diupdate 2626 1.3 K
Wyckoff Effort vs. Result📌 Wyckoff Effort vs. Result (E/R) – Visualizing Supply & Demand Imbalance with Volume Confirmation 📖 Overview The Wyckoff Effort vs. Result (E/R) indicator is designed to help traders interpret market behavior through the lens of volume vs. price movement — a foundational concept in Richard Wyckoff’s methodology. This tool aims to highlight moments where the “effort” (volume) is not in proportion to the “result” (price movement) — giving insight into potential accumulation or distribution events. By detecting high-volume candles and classifying them based on their price direction, the indicator visualizes zones where smart money might be active . ⚙️ How It Works 1. Effort Accumulation (High Volume Down Bar): • When a candle closes lower than it opens (down bar) and has above-average volume , it’s marked as potential absorption of selling pressure (effort to push down met by buying). • These candles are colored red and the open level is plotted, acting as a potential support or re-test zone. 2. Effort Distribution (High Volume Up Bar): • When a candle closes higher than it opens (up bar) and has above-average volume , it’s marked as potential distribution (effort to push up absorbed by sellers). • These candles are colored green and the open level is plotted , acting as a potential resistance or rejection zone. 3. Average Volume Calculation: • The script calculates a simple moving average (SMA) of volume over a user-defined lookback period. • If current volume exceeds the average multiplied by a set threshold, it’s treated as a high-effort bar . 🧪 Inputs Input Description Average Volume Lookback - Number of bars used to calculate the volume average High Volume Multiplier. - Multiplier to define what qualifies as “high volume” 🖥️ Visual Output • 🔴 Red candles = High volume on a down bar → possible accumulation • 🟢 Green candles = High volume on an up bar → possible distribution • 📉 Horizontal lines at bar open price mark the potential zones where effort occurred These zones can serve as: • Areas of support/resistance • Trap zones where smart money absorbs liquidity • Entry/exit filters when combined with price action 🧠 How to Use • Use in combination with price structure, support/resistance, and volume profile tools • Watch how price reacts when it revisits the plotted lines • Look for effort bars that fail to lead to continuation, signaling potential reversal • Can be used in scalping, swing trading, or Wyckoff-style phase analysis 🔒 Technical Notes • ✅ Does not repaint • ✅ Built with Pine Script v6 • ✅ Lightweight and customizable • ❌ Does not generate buy/sell signals — it provides context, not predictions Indikator Pine Script®oleh TradeTechanalysis37
Short Only Bot (3Commas Webhook Uyumlu)Short işlem açmaya ce 3commans ile uyumlu hacim odaklı indikatör. halka açık herkes kullanabilir.Strategi Pine Script®oleh zumahk21
MULTI-CONDITION RSI SIGNAL GENERATOR═══════════════════════════════════════════════ MULTI-CONDITION RSI SIGNAL GENERATOR ═══════════════════════════════════════════════ OVERVIEW: This indicator generates trading signals based on Relative Strength Index (RSI) movements with multiple confirmation layers designed to filter false signals and identify high-probability reversal opportunities. ═══════════════════════════════════════════════ WHAT MAKES THIS ORIGINAL: ═══════════════════════════════════════════════ Unlike basic RSI indicators that simply plot overbought/oversold crossovers, this system combines FOUR distinct confirmation mechanisms: 1. PERSISTENCE FILTERING - Requires RSI to remain in extreme zones for a minimum duration 2. LOOKBACK VALIDATION - Verifies recent extreme zone visits before signaling 3. DIVERGENCE DETECTION - Identifies price/RSI divergence for stronger signals 4. MOMENTUM CONFIRMATION - Provides trend-continuation entries via midline crosses This multi-layered approach significantly reduces whipsaw trades that plague simple RSI crossover systems. ═══════════════════════════════════════════════ HOW IT WORKS (TECHNICAL METHODOLOGY): ═══════════════════════════════════════════════ STEP 1: RSI CALCULATION - Standard RSI calculation using user-defined period (default: 14) - Monitors two extreme zones: Overbought (default: 70) and Oversold (default: 30) STEP 2: PERSISTENCE FILTERING The script counts how many bars RSI has spent in extreme zones within the lookback period: - For overbought signals: Counts bars where RSI > 70 - For oversold signals: Counts bars where RSI < 30 - Signal only triggers if count >= Minimum Duration (default: 4 bars) This filters out brief spikes that immediately reverse, focusing on sustained extreme conditions that are more likely to lead to genuine reversals. STEP 3: LOOKBACK VALIDATION - Checks if RSI reached extreme zones within the Lookback Bars period (default: 20) - Uses ta.highest() and ta.lowest() functions to verify recent extremes - Ensures we're trading reversals from meaningful extremes, not random crossovers STEP 4: BASIC SIGNAL GENERATION - BUY SIGNAL: RSI crosses above the oversold level (30) after meeting persistence and lookback conditions - SELL SIGNAL: RSI crosses below the overbought level (70) after meeting persistence and lookback conditions STEP 5: DIVERGENCE DETECTION The script identifies two types of divergence over the Divergence Lookback period (default: 5 bars): A) BULLISH DIVERGENCE (indicates potential upward reversal): - Price makes a lower low (current low < previous low) - RSI makes a higher low (current RSI low > previous RSI low) - Suggests weakening downward momentum B) BEARISH DIVERGENCE (indicates potential downward reversal): - Price makes a higher high (current high > previous high) - RSI makes a lower high (current RSI high < previous RSI high) - Suggests weakening upward momentum STEP 6: STRONG SIGNAL CONFIRMATION - STRONG BUY: Basic buy signal + bullish divergence present - STRONG SELL: Basic sell signal + bearish divergence present - These represent the highest-probability setups STEP 7: MOMENTUM SIGNALS (OPTIONAL) - MOMENTUM BUY: RSI crosses above 50 after being oversold (trend continuation) - MOMENTUM SELL: RSI crosses below 50 after being overbought (trend continuation) - Smaller signals for traders who want trend-following entries ═══════════════════════════════════════════════ SIGNAL TYPES AND VISUAL INDICATORS: ═══════════════════════════════════════════════ 📈 GREEN TRIANGLE (below bar) - Standard Buy Signal RSI crossed above oversold level with confirmation filters 📉 RED TRIANGLE (above bar) - Standard Sell Signal RSI crossed below overbought level with confirmation filters 🔵 BLUE TRIANGLE (below bar) - Strong Buy Signal Buy signal + bullish divergence (HIGHEST PRIORITY) 🟣 PURPLE TRIANGLE (above bar) - Strong Sell Signal Sell signal + bearish divergence (HIGHEST PRIORITY) 🟢 GREEN CIRCLE (small) - Momentum Buy RSI crosses above 50 after oversold conditions 🔴 RED CIRCLE (small) - Momentum Sell RSI crosses below 50 after overbought conditions BACKGROUND SHADING: - Light red background: RSI currently overbought - Light green background: RSI currently oversold ═══════════════════════════════════════════════ PARAMETER SETTINGS: ═══════════════════════════════════════════════ 1. OVERBOUGHT LEVEL (default: 70, range: 50-90) - Higher values = fewer but stronger overbought signals - Lower values = more sensitive to overbought conditions - Recommended: 70 for standard markets, 80 for crypto/volatile assets 2. OVERSOLD LEVEL (default: 30, range: 10-50) - Lower values = fewer but stronger oversold signals - Higher values = more sensitive to oversold conditions - Recommended: 30 for standard markets, 20 for crypto/volatile assets 3. RSI PERIOD (default: 14, range: 2-50) - Standard RSI calculation period - Lower = more sensitive/faster signals - Higher = smoother/slower signals - Recommended: 14 (industry standard) 4. MINIMUM DURATION (default: 4, range: 1-20) - Required bars in extreme zone before signal - Higher values = fewer signals but better quality - Lower values = more signals but more false positives - Recommended: 3-5 for day trading, 5-10 for swing trading 5. LOOKBACK BARS (default: 20, range: 5-100) - How far back to check for extreme zone visits - Should match your typical trading timeframe - Recommended: 20 for intraday, 50 for daily charts 6. DIVERGENCE LOOKBACK (default: 5, range: 2-20) - Period for comparing price/RSI highs and lows - Lower values = more frequent divergence signals - Higher values = more significant divergences - Recommended: 5-10 depending on timeframe ═══════════════════════════════════════════════ HOW TO USE THIS INDICATOR: ═══════════════════════════════════════════════ RECOMMENDED TRADING APPROACH: 1. PRIMARY ENTRIES: Focus on Strong Buy/Sell signals (blue/purple triangles) - These have the highest win rate due to divergence confirmation - Wait for price action confirmation (support/resistance, candlestick patterns) 2. SECONDARY ENTRIES: Regular Buy/Sell signals (green/red triangles) - Use these when Strong signals are infrequent - Require additional confirmation from other indicators or chart patterns 3. TREND CONTINUATION: Momentum signals (small circles) - Best used when overall trend is clear - Not recommended for reversal trading 4. FILTER TRADES: Use background shading as context - Be cautious entering longs when background is red (overbought) - Be cautious entering shorts when background is green (oversold) RISK MANAGEMENT GUIDELINES: - Never risk more than 2-5% of capital per trade - Use stop losses below recent swing lows (buys) or above swing highs (sells) - Target at least 1.5:1 reward-to-risk ratio - Consider position sizing based on signal strength TIMEFRAME RECOMMENDATIONS: - 15min - 1hour: Day trading with adjusted parameters (lower minimum duration) - 4hour - Daily: Swing trading with default parameters - Weekly: Position trading with increased lookback periods COMPLEMENTARY TOOLS: This indicator works best when combined with: - Support and resistance levels - Trend indicators (moving averages, trend lines) - Volume analysis - Price action patterns (engulfing candles, pin bars) ═══════════════════════════════════════════════ LIMITATIONS AND CONSIDERATIONS: ═══════════════════════════════════════════════ - This is NOT a standalone trading system - requires additional analysis - RSI-based strategies perform best in ranging/choppy markets - May generate fewer signals in strong trending markets - Divergence signals can be early - wait for price confirmation - Not recommended for highly illiquid assets - Backtest on your specific market before live trading - No indicator is 100% accurate - always use proper risk management ═══════════════════════════════════════════════ TECHNICAL NOTES: ═══════════════════════════════════════════════ - Code is original and does not reuse external libraries - Uses Pine Script v5 native functions only - Alert conditions included for all signal types - No repainting - signals appear and remain fixed - Efficient calculation methods minimize processing load ═══════════════════════════════════════════════ ALERT SETUP: ═══════════════════════════════════════════════ Four alert conditions are available: 1. "Buy Alert" - Triggers on standard buy signals 2. "Sell Alert" - Triggers on standard sell signals 3. "Strong Buy Alert" - Triggers on divergence-confirmed buy signals 4. "Strong Sell Alert" - Triggers on divergence-confirmed sell signals To set up alerts: Right-click chart → Add Alert → Select desired condition ═══════════════════════════════════════════════ This indicator is provided for educational and informational purposes. Always practice proper risk management and never trade with money you cannot afford to lose.Indikator Pine Script®oleh DrFXGOD1174
Auto AVWAP (Anchored-VWAP) with Breakout Screener_v2Updated indicator for AWAP breakout. The indicator identified the candle that breaks out of AVWAPIndikator Pine Script®oleh manoharvs29
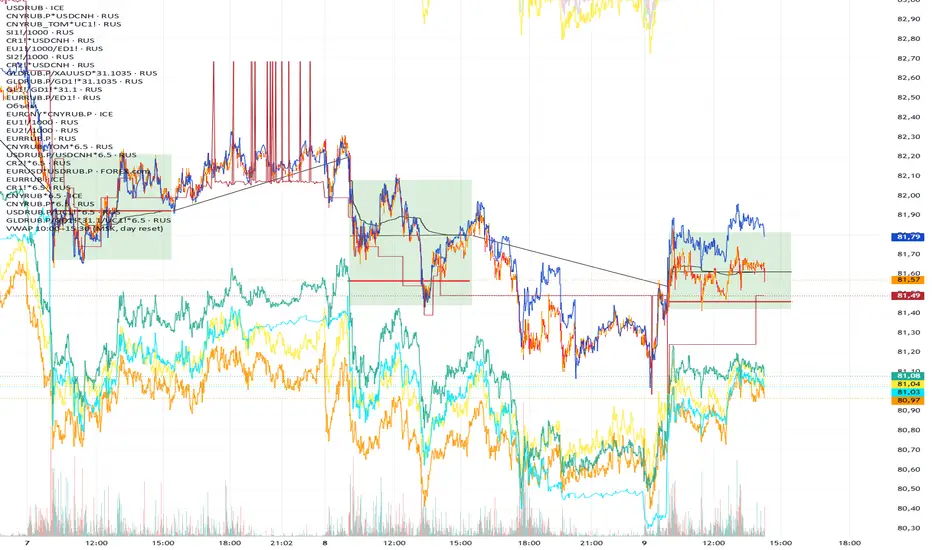
VWAP 10:00–15:00 (MSK, daily reset)Calculates the volume-weighted average price (VWAP) from 10:00 to 15:00 MSK. The data is used to determine the funding rate of MOEX perpetual futures by comparing the average price of the perpetual contract with the official Central Bank exchange rate on the following day.Indikator Pine Script®oleh Ppntrg119
Cumulative Volume Delta Profile and Heatmap [BackQuant]Cumulative Volume Delta Profile and Heatmap A multi-view CVD workstation that measures buying vs selling pressure, renders a price-aligned CVD profile with Point of Control, paints an optional heatmap of delta intensity, and detects classical CVD divergences using pivot logic. Built for reading who is in control, where participation clustered, and when effort is failing to produce result. What is CVD Cumulative Volume Delta accumulates the difference between aggressive buys and aggressive sells over time. When CVD rises, buyers are lifting the offer more than sellers are hitting the bid. When CVD falls, the opposite is true. Plotting CVD alongside price helps you judge whether price moves are supported by real participation or are running on fumes. Core Features Visual Analysis Components CVD Columns - Plot of cumulative delta, colored by side, for quick read of participation bias. CVD Profile - Price-aligned histogram of CVD accumulation using user-set bins. Shows where net initiative clustered. Split Buy and Sell CVD - Optional two-sided profile that separates positive and negative CVD into distinct wings. POC - Point of Control - The price level with the highest absolute CVD accumulation, labeled and line-marked. Heatmap - Semi-transparent blocks behind price that encode CVD intensity across the last N bars. Divergence Engine - Pivot-based detection of Bearish and Bullish CVD divergences with optional lines and labels. Stats Panel - Top level metrics: Total CVD, Buy and Sell totals with percentages, Delta Ratio, and current POC price. How it works Delta source and sampling You select an Anchor Timeframe that defines the higher time aggregation for reading the trend of CVD. The script pulls lower timeframe volume delta and aggregates it to the anchor window. You can let it auto-select the lower timeframe or force a custom one. CVD is then accumulated bar by bar to form a running total. This plot shows the direction and persistence of initiative. Profile construction The recent price range is split into Profile Granularity bins. As price traverses a bin, the current delta contribution is added to that bin. If Split Buy and Sell CVD is enabled, positive CVD goes to the right wing and negative CVD to the left wing. Widths are scaled by each side’s maximum so you can compare distribution shape at a glance. The Point of Control is the bin with the highest absolute CVD. This marks where initiative concentrated the most. Heatmap For each bin, the script computes intensity as absolute CVD relative to the maximum bin value. Color is derived from the side in control in that bin and shaded by intensity. Heatmap Length sets how far back the panels extend, highlighting recurring participation zones. Divergence model You define pivot sensitivity with Pivot Left and Right . Bearish divergence triggers when price confirms a higher high while CVD fails to make a higher high within a configurable Delta Tolerance . Bullish divergence triggers when price confirms a lower low while CVD fails to make a lower low. On trigger, optional link lines and labels are drawn at the pivots for immediate context. Key Settings Delta Source Anchor Timeframe - Higher TF for the CVD narrative. Custom Lower TF and Lower Timeframe - Force the sampling TF if desired. Pivot Logic Pivot Left and Right - Bars to each side for swing confirmation. Delta Tolerance - Small allowance to avoid near-miss false positives. CVD Profile Show CVD Profile - Toggle profile rendering. Split Buy and Sell CVD - Two-sided profile for clearer side attribution. Show Heatmap - Project intensity panels behind price. Show POC and POC Color - Mark the dominant CVD node. Profile Granularity - Number of bins across the visible price range. Profile Offset and Profile Width - Position and scale the profile. Profile Position - Right, Left, or Current bar alignment. Visuals Bullish Div Color and Bearish Div Color - Colors for divergence artifacts. Show Divergence Lines and Labels - Visualize pivots and annotations. Plot CVD - Column plot of total CVD. Show Statistics and Position - Toggle and place the summary table. Reading the display CVD columns Rising CVD confirms buyers are in control. Falling CVD confirms sellers. Flat or choppy CVD during wide price moves hints at passive or exhausted participation. CVD profile wings Thick right wing near a price zone implies heavy buy initiative accumulated there. Thick left wing implies heavy sell initiative. POC marks the strongest initiative node. Expect reactions on first touch and rotations around this level when the tape is balanced. Heatmap Brighter blocks indicate stronger historical net initiative at that price. Stacked bright bands form CVD high volume nodes. These often behave like magnets or shelves for future trade. Divergences Bearish - Price prints a higher high while CVD fails to do so. Effort is not producing result. Potential fade or pause. Bullish - Price prints a lower low while CVD fails to do so. Capitulation lacks initiative. Potential bounce or reversal. Stats panel Total CVD - Net initiative over the window. Buy and Sell volume with percentages - Side composition. Delta Ratio - Buy over Sell. Values above 1 favor buyers, below 1 favor sellers. POC Price - Current control node for plan and risk. Workflows Trend following Choose an Anchor Timeframe that matches your holding period. Trade in the direction of CVD slope while price holds above a bullish POC or below a bearish POC. Use pullbacks to CVD nodes on your profile as entry locations. Trend weakens when price makes new highs but CVD stalls, or new lows while CVD recovers. Mean reversion Look for divergences at or near prior CVD nodes, especially the POC. Fade tests into thick wings when the side that dominated there now fails to push CVD further. Target rotations back toward the POC or the opposite wing edge. Liquidity and execution map Treat strong wings and heatmap bands as probable passive interest zones. Expect pauses, partial fills, or flips at these shelves. Stops make sense beyond the far edge of the active wing supporting your idea. Alerts included CVD Bearish Divergence and CVD Bullish Divergence. Price Cross Above POC and Price Cross Below POC. Extreme Buy Imbalance and Extreme Sell Imbalance from Delta Ratio. CVD Turn Bullish and CVD Turn Bearish when net CVD crosses zero. Price Near POC proximity alert. Best practices Use a higher Anchor Timeframe to stabilize the CVD story and a sensible Profile Granularity so wings are readable without clutter. Keep Split mode on when you want to separate initiative attribution. Turn it off when you prefer a single net profile. Tune Pivot Left and Right by instrument to avoid overfitting. Larger values find swing divergences. Smaller values find micro fades. If volume is thin or synthetic for the symbol, CVD will be less reliable. The script will warn if volume is zero. Trading applications Context - Confirm or question breakouts with CVD slope. Location - Build entries at CVD nodes and POC. Timing - Use divergence and POC crosses for triggers. Risk - Place stops beyond the opposite wing or outside the POC shelf. Important notes and limits This is a price and volume based study. It does not access off-book or venue-level order flow. CVD profiles are built from the data available on your chart and the chosen lower timeframe sampling. Like all volume tools, readings can distort during roll periods, holidays, or feed anomalies. Validate on your instrument. Technical notes Delta is aggregated from a lower timeframe into an Anchor Timeframe narrative. Profile bins update in real time. Splitting by side scales each wing independently so both are readable in the same panel. Divergences are confirmed using standard pivot definitions with user-set tolerances. All profile drawing uses fixed X offsets so panels and POC do not swim when you scroll. Quick start Anchor Timeframe = Daily for intraday context. Split Buy and Sell CVD = On. Profile Granularity = 100 to 200, Profile Position = Right, Width to taste. Pivot Left and Right around 8 to 12 to start, then adapt. Turn on Heatmap for a fast map of interest bands. Bottom line CVD tells you who is doing the lifting. The profile shows where they did it. Divergences tell you when effort stops paying. Put them together and you get a clear read on control, location, and timing for both trend and mean reversion. Indikator Pine Script®oleh BackQuantDiupdate 1010699
Options Momentum SignalCustomizable Intraday Options Scalping Alert. Several important, complementary indicators combined into one simple signal that pops up under a bar to indicate sustained momentum on a trend. It uses a combination of calculations based on the 1m VWAP, price increase in contrast to previous day's close, and customizable Volatility and Volume Data. It has adjustable values for the % increase from last close (labeled as Pre-Mkt % Threshold), minimal candle body % to filter out weaker signals, RVOL threshold, minimum CVD (it's rolling, so functions in tandem with the CVD lookback value for the number of bars.) It offers individual boxes that can be checked on or off to help filter out noise. Boxes are: Use 1m VWAP, Use CVD, 3-bar cooldown (reduces back-to-back signals, especially on shorter (1m, 2m, and 5m) charts), VWAP bounce option to catch bounces happening in real time before the candle closes, Use RVOL, and Use Rolling CVD. These can all be checked on or off and will create vastly different signals depending on what you are filtering for. These indicators were chosen specifically as I feel they help most with option scalping and is intended to be used alongside a few other indicators for confirmation. Personally, I use a couple anchored VWAPs (highest high, session) as well as a FRAMA channel for confirmation. I also use the following to further confirm trends: TradingView’s RVOL, CVD, and Price Pattern Oscillators, in addition to Beardy Fred's TTM Squeeze Pro. Hope this helps some people!Indikator Pine Script®oleh TylerisTradingDiupdate 49