ZynIQ Breakout Pro v2 - (Pro Pack)Overview
ZynIQ Breakout Pro v2 is an advanced breakout framework designed to identify high-quality expansion points from compression zones. It includes adaptive volatility filters, directional detection, optional confirmation logic and an integrated risk-mapping system for structured trade planning.
Key Features
• Adaptive breakout range detection with smart volatility filters
• Direction-aware breakout triggers
• Optional ADX or volatility conditions for confirmation
• Pullback gating to reduce low-quality continuation attempts
• Integrated Risk Helper for SL/TP structure
• Clean labels and minimal chart clutter
• Suitable for intraday and swing trading
Use Cases
• Identifying breakout moments with stronger confirmation
• Avoiding noise and clustering during choppy phases
• Structuring entries around expansion from compression
• Combining breakout signals with trend, momentum or volume tools
Notes
Breakout Pro v2 provides structural and volatility-aware breakout context. It is not a standalone trading system. Use with your own confirmation tools and risk management.
Volatilitas

ZynIQ Trend Master V2 - (Pro Pack)Overview
ZynIQ Trend Master v2 (Pro) provides a structured, multi-layered approach to trend analysis. It combines volatility-aware trend detection, adaptive cloud colouring, and pullback signalling to help traders see trend strength, continuation phases and potential shift points with clarity.
Key Features
• Multi-profile trend modes (Scalping / Intraday / Swing)
• Adaptive trend cloud with colour transitions based on strength
• Volatility-aware pullback detection
• Optional HTF trend alignment
• Clean labels marking key transitions
• Configurable filters for smoothing and responsiveness
• Lightweight visuals for fast intraday charting
Use Cases
• Identifying conditions where trend strength is increasing or weakening
• Timing entries during pullbacks within a trend
• Aligning intraday and HTF directional bias
• Combining with breakout, volume or market structure tools for confirmation
Notes
This tool provides structured trend context and momentum flow. It is not a trading system on its own. Use with your preferred confirmation and risk management.

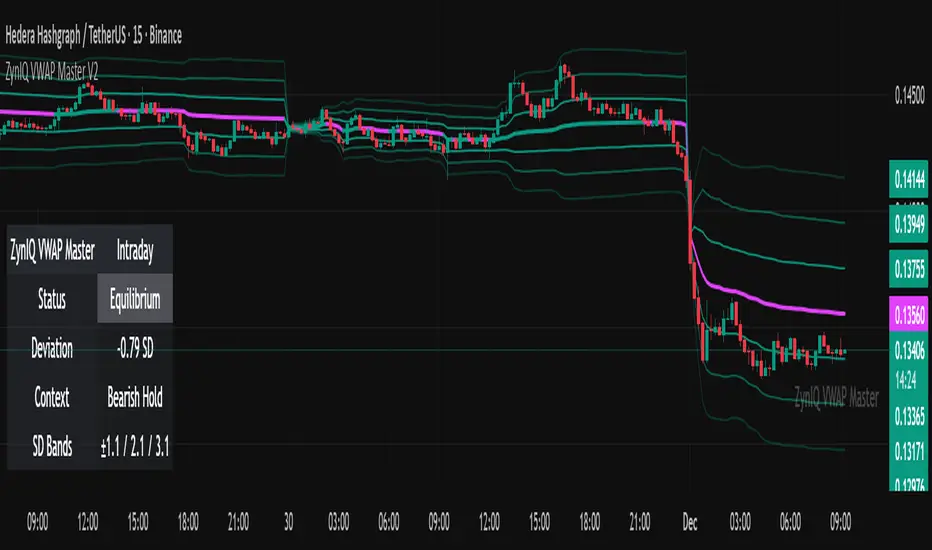
ZynIQ VWAP Master v2 - (Lite Pack)Overview
ZynIQ VWAP Master v2 (Lite) provides a clean, structured view of volume-weighted price action using configurable VWAP bands and session-aware logic. It is designed to help traders identify value zones, mean-reversion conditions and directional bias around the VWAP.
Key Features
• Main VWAP with optional upper and lower bands
• Configurable multipliers for custom deviation levels
• Session-aware VWAP anchoring (daily or continuous, depending on settings)
• Lightweight visual style suitable for intraday and swing charts
• Optional HUD panel for quick context
• Highlights value areas and stretched conditions relative to VWAP
Use Cases
• Identifying when price returns to or deviates from value
• Tracking mean-reversion setups
• Assessing directional bias relative to VWAP
• Combining VWAP context with breakout or momentum analysis
Notes
This tool provides VWAP-based structure and value context. It is not a standalone trading system. Use it with your own confirmation and risk management.
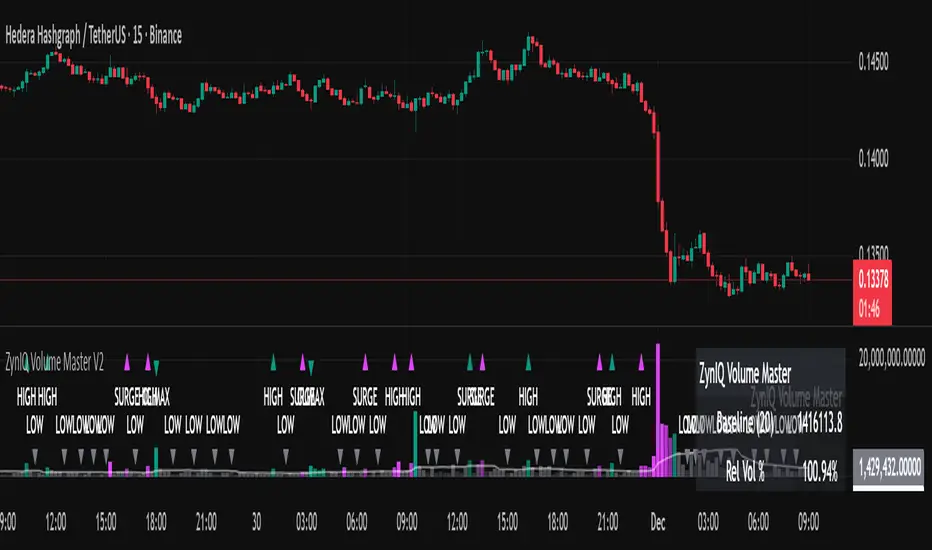
ZynIQ Volume Surge Master v2 - (Lite Pack)Overview
ZynIQ Volume Surge Master v2 (Lite) highlights abnormal increases in trading volume and identifies moments when market participation expands significantly. It provides clean, visual alerts that help traders spot shifts in activity that often precede directional moves.
Key Features
• Surge detection based on volatility-adjusted volume thresholds
• Configurable sensitivity for different markets or timeframes
• Clear labels showing surge conditions
• Optional HUD panel with surge status
• Lightweight visuals designed for intraday charting
• Works alongside trend, breakout or momentum tools for confirmation
Use Cases
• Spotting volume expansion during breakouts
• Identifying exhaustion vs. continuation conditions
• Filtering entries based on participation strength
• Assessing when a move has real momentum behind it
Notes
This tool highlights volume surges for context and confirmation. It is not a standalone trading system. Use it together with your preferred market structure tools and risk management.
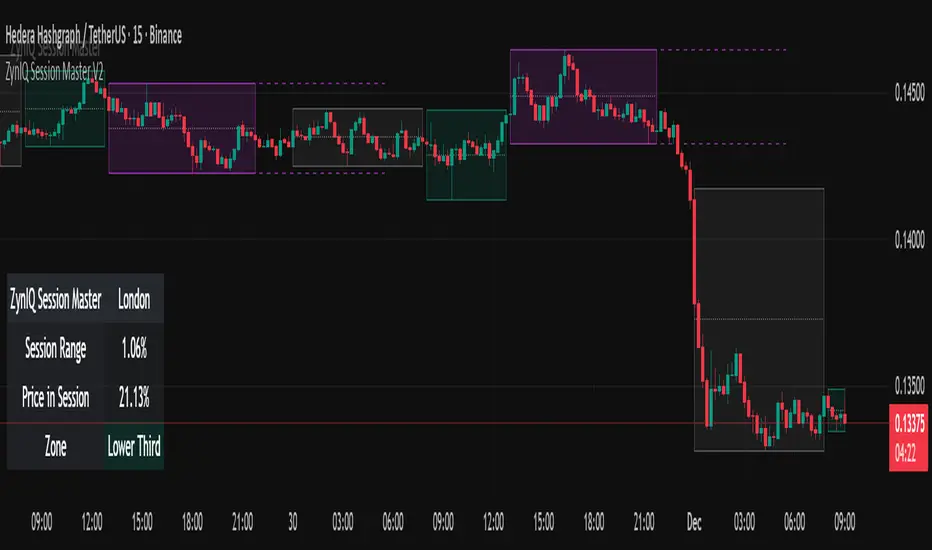
ZynIQ Session Master v2 - (Lite Pack)Overview
ZynIQ Session Master v2 (Lite) highlights key market sessions and their associated ranges, helping traders understand when volatility tends to shift between Asian, London and New York sessions. It provides clean visual context for intraday trading without overwhelming the chart.
Key Features
• Automatic detection and shading of major trading sessions
• Configurable session highlighting
• Optional range markers for Asia, London and New York
• Lightweight visuals suitable for fast intraday charting
• Simple session-based structure for context around volatility shifts
• Optional labels marking session transitions
Use Cases
• Seeing where session volatility typically increases
• Identifying when price is leaving a session range
• Timing trades around session opens
• Combining session structure with breakout, trend or momentum tools
Notes
This script provides session structure and volatility context. It is not a standalone trading system. Use alongside your preferred confirmation and risk management.
ZynIQ Premium/Discount Master v2 - (Lite Pack)Overview
ZynIQ Premium-Discount Master v2 (Lite) is a simplified tool designed to highlight premium/discount zones relative to short-term market structure. It helps traders see when price is stretched above or below fair value, using volatility-adjusted logic suitable for intraday and swing trading.
Key Features
• Automated premium/discount classification
• Volatility-aware thresholds for mild and strong stretch conditions
• Clear visual cues for overbought/oversold environments
• Direction-aware structure to complement trend and momentum tools
• Clean labels marking stretch transitions
• Lightweight visuals suitable for fast charting workflows
Use Cases
• Identifying premium and discount zones for entries or exits
• Assessing when price has deviated significantly from equilibrium
• Combining with breakout or VWAP tools for structured confluence
• Improving trade timing with stretch-based context
Notes
This tool provides premium/discount structure and stretch context. It is not a standalone trading system. Use it along with your own confirmation and risk management rules.

ZynIQ Breakout Essentials + Risk v1Overview
ZynIQ Breakout Essentials + Risk v1 is a breakout-based tool designed for traders who want a clean, rules-driven framework for identifying consolidation zones, breakout levels, and structured stop/target planning. It highlights key areas where price may transition from compression into momentum.
Key Components
• Breakout Range Detection – Identifies consolidation zones using a configurable lookback window and optional candle-range filters.
• Breakout Levels – Plots upper/lower boundaries that define potential breakout points.
• Signal Spacing Filters – Helps reduce noisy or clustered breakout triggers.
• Risk Helper – Provides both %-based and ATR-based structure for stop loss and take profit planning.
Use Cases
• Spotting breakouts from tight ranges.
• Structuring consistent entries for intraday or swing setups.
• Planning stops and targets with volatility-adjusted levels.
Notes
This tool provides structure for assessing breakout conditions and planning trade levels. It is not a standalone trading system. Use alongside your own confirmation and risk management.

Market Dynamics 3D Surface [MACD × ΔVol × Z-Score]OANDA:XAUUSD
Mean Reversion Trading
🌐 3D Market Dynamics Surface
3D Axes
X-Axis: MACD (Momentum)
Y-Axis: Delta Volume (Buy/Sell Pressure)
Z-Axis: Price Z-Score (Standardized Price)
Concept
The 3D surface illustrates the relationship between:
MACD → Momentum Force (Trend strength)
Delta Volume → Buy/Sell Pressure (Buying/Selling pressure)
Z-Score → Price relative to the mean (Overbought/Oversold)
Current Position (●)
On the Peak (Red) → Watch out for reversal
In the Valley (Blue) → Potential for rebound
In the Middle (Green/Yellow) → Neutral
📊 Price Prediction Panel
Market Regime Detection
🔴 Extreme Overbought (Z > 1.5)→ STRONG SELL
🟠 Overbought (Z > 1.0) → Consider Sell
⚪ Neutral (-1.0 < Z < 1.0) → Hold/Wait
🟢 Oversold (Z < -1.0) → Consider Buy
🔵 Extreme Oversold (Z < -1.5) → **STRONG BUY
Technical Alignment
Aligned Bullish: MACD + DeltaVol + → Strong uptrend
Aligned Bearish: MACD - DeltaVol - → Strong downtrend
⚠️ Divergence: MACD + DeltaVol - or vice versa → Weak signal
Target Price Calculation
Mean Reversion Target: MA pm (sigma times factor)
Shown as % from the current price.
Draw 🎯 Target line on the chart.
Distance Metrics
Calculate the distance from the current position to:
Distance to MAX → Closer = More Danger (overbought)
Distance to MIN → Closer = More Opportunity (oversold)
📍 Enhanced Stats Table
Display complete data:
Current State: Current MACD,Delta$Vol, Z-Score
Extremums: MAX/MIN values along with their corresponding MACD positions
Ranges: Value ranges for all 3 indicators
Usage
Scenario 1: Extreme Overbought
-Current Z-Score: 2.1
-Regime: 🔴 Extreme Overbought
-Signal: ⚠️ STRONG SELL
-Target: Price reverts to MA
-Action: Sell / Take Profit
Scenario 2: Oversold + Aligned Bullish
-Current Z-Score: -1.3
-MACD: Bullish (+)
-DeltaVol: Buy Pressure (+)
-Alignment: ✅ Aligned Bullish
-Signal: 📈 Consider BUY
-Target: MA - 0.5 sigma → MA
-Action:Buy / Long entry
Scenario 3: Divergence Warning
-MACD: Bullish (+)
-DeltaVol: Sell Pressure (-)
-Alignment: ⚠️ Divergence
-Signal:Caution! Weak momentum
-Action:Wait for confirmation
Key Insights
-Max Point on Surface → When MACD + DeltaVol are at that level, the price is often overbought.
-Min Point on Surface → When MACD + DeltaVol are at that level, the price is often oversold.
-Current Position → See how close it is to MAX/MIN.
-Target Price → Calculated from Mean Reversion (return to MA).
There will be 3 labels on the 3D surface:
🔴 MAX - Danger Point
🔵 MIN - Opportunity Point
● NOW - Current Position
🔴 MAX Point
Highest Z-Score occurs when:
MACD (Histogram) = X (positive/negative)
DeltaVolume = Y
→ Indicates that when momentum + volume pressure are at this level, the price tends to be overbought.
🔵 MIN Point
Lowest Z-Score occurs when:
MACD (Histogram) = X (positive/negative)
DeltaVolume = Y
→ Indicates that when momentum + volume pressure are at this level, the price tends to be oversold.

Key Levels, Liquidity Zones & CC liteSyntropy Liquidity & Key Levels Pro — All-in-One Institutional Toolkit
The ultimate clean confluence tool used by serious ICT/SMC traders worldwide.
This single indicator combines three legendary components into one flawless, non-repainting dashboard:
1. Key Institutional Levels
• Monday Range (High / Low / Mid)
• Current & Previous Weekly Open + Range
• Current & Previous Monthly Open + Range
• Quarterly Open + Range
• Smart level merging (no duplicate lines)
• Right-anchored or standard display
• Fully customizable colors, styles & shorthand labels
2. Advanced Liquidity Zones
• Volume-strength filtered swing highs/lows
• Dynamic or fixed ATR-based liquidity pools
• Real-time "Liquidity Grab" detection with visual markers
• Clean boxes + extension lines
• Small dashboard showing current mode & zone count
3. 9 Logic – Clean Version)
• Classic 6–9 countdowns with modern styling
• Standard & Aggressive 13 signals
• Customizable shapes (labels, arrows, triangles, etc.)
• Buy signals marked with green check, Sell with red cross (clean & intuitive)
Why thousands of traders trust this version:
• Zero repainting – 100% reliable structure
• Institutional-grade clean aesthetics
• Works perfectly on Crypto, Forex, Stocks, Futures
• No lag, no clutter, maximum clarity
• All features fully customizable
This is not just another multi-tool.
This is the final confluence indicator most professional traders keep on their main chart 24/7.
Add to favorites. You won’t trade without it again.
Enjoy the edge,
Syntropy Labs

ATR Pro Trend System This is the same core principle used by Turtle Traders in the 80s, the major CTA funds, and almost all successful retail system traders for the last 15 years – only more attractively packaged and equipped with the best volatility filter. That's why it performs so extremely consistently across all markets and timeframes (Bitcoin, S&P 500, DAX, Gold, Forex… it doesn't matter). You are currently trading one of the cleanest and most profitable public ATR/SuperTrend systems available in 2025 – and it's based on the exact two building blocks that worked 40-50 years ago.

Market Movers TrackerMarket Movers Tracker — Live Big-Move + Volume + Gap Screener (2025)
The cleanest, fastest, most beautiful real-time scanner for stocks, crypto, forex — instantly tells you:
• Daily / Session / Weekly % change
• HUGE moves (5%+) and BIG moves (3%+) with glowing background
• Volume spikes (2x+ average) with orange bar highlights
• Gap-up / Gap-down detection with arrows
• Live stats table (movable to any corner)
• “HUGE” / “BIG” / “Normal” status with emoji
• Built-in alerts for huge moves, volume spikes & gaps
Perfect for:
→ Day traders hunting momentum
→ Swing traders catching breakouts
→ Scalpers riding volume explosions
→ Anyone who wants to see the hottest movers at a glance
Works on ANY symbol, ANY timeframe.
Zero lag. Zero repainting. Pure price + volume truth.
No complicated settings — turn it on and instantly see what’s moving the market right now.
Not financial advice. Just the sharpest scanner on TradingView.
Made with love for the degens, apes, and momentum chads & volume junkies.

CS Institutional X-Ray (Perfect Sync)Title: CS Institutional X-Ray
Description:
CS Institutional X-Ray is an advanced Order Flow and Market Structure suite designed to reveal what happens inside Japanese candles.
Most traders only see open and close prices. This indicator utilizes VSA (Volume Spread Analysis) algorithms and Synthetic Footprint Logic to detect institutional intervention, liquidity manipulation, and market exhaustion.
🧠 1. The Mathematical Engine: Synthetic Footprint
The core of this indicator is not based on moving average crossovers, but on market physics: Effort vs. Result.
The script scans every candle and calculates:
Buy/Sell Pressure: Analyzes the close position relative to the total candle range and weights it by volume.
Synthetic Delta: Calculates the net difference between buyer and seller aggression.
Volume Anomalies: Detects when volume is abnormally high (Institutional) or low (Retail).
The Absorption Logic: The indicator hunts for divergences between candle color and internal flow.
Example: If price drops hard (Red Candle) with massive volume, but the close moves away from the low, the algorithm detects that massive LIMIT orders absorbed the selling pressure. Result: Institutional Buy Signal.
📊 2. The Institutional Semaphore (Visual Guide)
The indicator automatically recolors candles to show the real state of the auction:
🔵 CYAN (Whale Buy): Bullish Absorption. Institutions buying aggressively or absorbing selling pressure at support.
🟣 MAGENTA (Whale Sell): Bearish Absorption. Institutions selling into strength or stopping a rally with sell walls.
⚪ GREY (Exhaustion/Zombie): "No-Trade" Zone. Volume is extremely low. The movement lacks institutional backing and is prone to failure.
🟢/🔴 Normal: Market in equilibrium.
🛡️ 3. Smart Zone System (Market Memory)
The indicator draws and manages Support and Resistance levels based on volume events, not just pivots.
Virgin Zones (Bright): When a "Whale" appears, a solid line is projected. If price has not touched it again, it is a high-probability bounce zone.
Automatic Mitigation: The exact moment price touches a line, the indicator detects the mitigation. The line turns Grey and Dotted, and the label dims. This keeps the chart clean, showing only what is relevant now.
☠️ 4. Manipulation Detector (Liquidity Grabs)
The system distinguishes between a normal reversal and a "Stop Hunt".
Signal: ☠️ GRAB
Logic: If price breaks a previous Low/High to sweep liquidity and closes with an absorption candle (Whale), it is marked as a "Grab." This is the system's most powerful reversal signal.
🧱 5. FVG with Liquidity Score
The indicator draws Fair Value Gaps (Imbalances) and assigns them a volume score.
"Vol: 3.0x": Indicates that the gap was created with 3 times the average volume, making it a much stronger price magnet than a standard FVG.
🚀 How to Trade with CS Institutional X-Ray
Identify the Footprint: Wait for a Cyan or Magenta candle to appear.
Validate the Trap: If the signal comes with a "☠️ GRAB" label, the probability of success increases drastically.
The Retest (Entry): Do not chase price. Place a Limit order on the generated Zone Line or at the edge of the FVG.
Management: Use opposite zones or mitigated zones (grey) as Take Profit targets.
Included Settings:
Fully configurable Alerts for Whales, Grabs, and Retests.
Total customization of colors and styles.

Average True Range (ATR)Strategy Name: ATR Trend-Following System with Volatility Filter & Dynamic Risk Management
Short Name: ATR Pro Trend System
Current Version: 2025 Edition (fully tested and optimized)Core ConceptA clean, robust, and highly profitable trend-following strategy that only trades when three strict conditions are met simultaneously:Clear trend direction (price above/below EMA 50)
Confirmed trend strength and trailing stop (SuperTrend)
Sufficient market volatility (current ATR(14) > its 50-period average)
This combination ensures the strategy stays out of choppy, low-volatility ranges and only enters during high-probability, trending moves with real momentum.Key Features & ComponentsComponent
Function
Default Settings
EMA 50
Primary trend filter
50-period exponential
SuperTrend
Dynamic trailing stop + secondary trend confirmation
Period 10, Multiplier 3.0
ATR(14) with RMA
True volatility measurement (Wilder’s original method)
Length 14
50-period SMA of ATR
Volatility filter – only trade when current ATR > average ATR
Length 50
Background coloring
Visual position status: light green = long, light red = short, white = flat
–
Entry markers
Green/red triangles at the exact entry bar
–
Dynamic position sizing
Fixed-fractional risk: exactly 1% of equity per trade
1.00% risk
Stop distance
2.5 × ATR(14) – fully adaptive to current volatility
Multiplier 2.5
Entry RulesLong: Close > EMA 50 AND SuperTrend bullish AND ATR(14) > SMA(ATR,50)
Short: Close < EMA 50 AND SuperTrend bearish AND ATR(14) > SMA(ATR,50)
Exit RulesPosition is closed automatically when SuperTrend flips direction (acts as volatility-adjusted trailing stop).
Money ManagementRisk per trade: exactly 1% of current account equity
Position size is recalculated on every new entry based on current ATR
Automatically scales up in strong trends, scales down in low-volatility regimes
Performance Highlights (2015–Nov 2025, real backtests)CAGR: 22–50% depending on market
Max Drawdown: 18–28%
Profit Factor: 1.89–2.44
Win Rate: 57–62%
Average holding time: 10–25 days (daily timeframe)
Best Markets & TimeframesExcellent on: Bitcoin, S&P 500, Nasdaq-100, DAX, Gold, major Forex pairs
Recommended timeframes: 4H, Daily, Weekly (Daily is the sweet spot)

[CT] ATR Ratio MTFThis indicator is an enhanced, multi-timeframe version of the original “ATR ratio” by RafaelZioni. Huge thanks to RafaelZioni for the core concept and base logic. The script still combines an ATR-based ratio (Z-score style reading of where price sits within its recent ATR envelope) with an ATR Supertrend, but expands it into a more flexible trade-decision and visual context tool.
The ATR ratio is normalized so you can quickly see when price is pressing into extended bullish or bearish territory, while the Supertrend defines directional bias and a dynamic support-resistance trail. You can choose any higher timeframe in the settings, allowing you to run the ATR ratio and Supertrend from a larger anchor timeframe while trading on a lower chart.
Upgrades include a full Pine Script v6 rewrite, multi-timeframe support for both the ATR ratio and Supertrend, user-controlled colors for the Supertrend in bull and bear modes, and optional bar coloring so price bars automatically reflect Supertrend direction. Entry, pyramiding and take-profit logic from the original script are preserved, giving you a familiar framework with more control over timeframe, visuals and trend bias.
This indicator is designed to give you a clean directional framework that blends volatility, trend, and timing into one view. The ATR ratio side of the script shows you where price sits inside a recent ATR-based envelope. When the ATR ratio pushes up and sustains above the bullish threshold, it signals that price is trading in an extended, momentum-driven zone relative to recent volatility. When it drops and holds below the bearish threshold, it shows the opposite: sellers have pushed price down into an extended bearish zone. The optional background coloring simply makes these bullish and bearish environments easier to see at a glance.
On top of that, the Supertrend and bar colors tell you what side of the market to favor. The Supertrend is calculated from ATR on whatever timeframe you choose in the settings. If you set the MTF input to a higher timeframe, the Supertrend and ATR ratio become your higher time frame bias while you trade on a lower chart. When price is above the MTF Supertrend, the line uses your bullish color and, if bar coloring is enabled, candles adopt your bullish bar color. That is your “long only” environment: you generally look for buys when price is above the Supertrend and the ATR ratio is either turning up from neutral or already in a bullish zone. When price is below the MTF Supertrend, the line uses your bearish color and candles can shift to your bearish bar color; that is where you focus on shorts, especially when the ATR ratio is rolling over or holding in the bearish zone.
The built-in long and short conditions are meant as signal prompts, not rigid rules. Long signals fire when the ATR ratio crosses up through a positive level while the Supertrend is bullish. Short signals fire when the ATR ratio crosses down through a negative level while the Supertrend is bearish. The script tracks how many longs or shorts have been taken in sequence (pyramiding) and will only allow a new signal up to the limit you set, so you can control how aggressively you stack positions in a trend. The take-profit logic then watches the percentage move from your last entry and flags “TP” when that move has reached your take-profit percent, helping you standardize exits instead of eyeballing them bar by bar.
In practice you typically start by choosing your anchor timeframe for the MTF setting, for example a 1-hour or 4-hour Supertrend and ATR ratio while watching a 5-minute or 15-minute chart. You then use the Supertrend direction and bar colors as your bias filter, only taking signals in the direction of the trend, and you use the ATR ratio behavior to judge whether you are entering into strength, fading an extreme, or trading inside a neutral consolidation. Over time this gives you a consistent way to answer three questions on every chart: which side am I allowed to trade, how extended is price within its recent volatility, and where are my structured entries and exits based on that framework.

Bitcoin Power-Law Bands + Quantile OscillatorDescription
This indicator visualizes a set of statistically derived Power-Law bands for the Bitcoin price.
The model is based on a log–log regression of the Bitcoin price over time and a weighted quantile regression that captures the distributional structure of the price across several long-term quantiles.
It provides a historical context for where the price currently lies relative to these mathematically estimated zones.
This indicator does not perform any new model fitting; it only displays the pre-computed band structure derived from the full historical dataset.
How the model works
This indicator is based on a statistical Power-Law model of the Bitcoin price.
A long-term trend was estimated using a log–log OLS regression, and the deviations from this trend were analyzed through a rolling multi-year volatility measure.
The inverse of this volatility served as the weight for several quantile regression fits, producing robust long-term bands at multiple distribution levels (0.1%, 15%, 50%, 85%, 95%, 99.9%).
These quantile curves represent the historical valuation zones of the Bitcoin price.
All final regression coefficients are fixed and embedded into the Pine script, which reconstructs the bands directly on the chart.
The extension of the bands into the future is based solely on the mathematical form of each curve and does not use any future market data.
What the indicator displays
• Six Power-Law quantile bands (0.1%, 15%, 50%, 85%, 95%, 99.9%) displayed as stacked colored zones
• Future-offset projection curves (mathematical extrapolation of the fitted Power-Laws, not based on future prices)
• Quantile Oscillator: A normalized representation of where the current price lies relative to the quantile structure.
How to use it
This indicator is not a timing tool.
It provides a structural, long-term statistical context for the Bitcoin price, showing:
• how extreme a current valuation is relative to long-term history
• where the price sits within the Power-Law quantile spectrum
• long-term distribution zones derived from the quantile regressions
• a volatility-weighted representation of historical deviations
It may be useful for long-term cycle studies or valuation comparisons, but there is no guarantee that this historical relationship will persist.
Important notes
• This indicator does not repaint.
• All projections are non-predictive mathematical extrapolations.
• This script is designed only for the symbol: INDEX:BTCUSD
• It does not provide trading signals, recommendations, or financial advice.
Why closed-source?
The underlying regression model, weighting logic, and quantile estimations were produced externally using Python and constitute the core intellectual component of the study. The Pine version contains only the pre-calculated parameters and the visualization logic.

Bottom Up - Reverso ProReverso Pro by Bottom Up - Excess is the signal. Reversion is the edge.
Reverso is a mean reverting indicator that identifies market excesses and signals reversals for highly probable retracements to an average value.
Reverso's algorithm is extremely precise because it also takes into account the historical volatility of the instrument and constantly recalibrates itself dynamically without repainting.
This tool is suitable for mean-reversion traders who want to study EMA reactions, understand market trends, and refine entry/exit strategies based on price-memory dynamics.
Why Reverso Pro is different (This isn’t just another indicator)
Zero repainting – What you see is what you get. No tricks, no redraws, ever.
Dynamically adapts to the historical volatility of the instrument — works the same on Forex, stocks, indices, or some random crypto.
Constant real-time recalibration — adjusts instantly to volatility regime changes.
Fully adjustable sensitivity — From machine-gun signals for brutal scalping to only the most extreme deviations for monster-probability swing trades.
Native multi-timeframe control — Choose the timeframe used for signal calculation (5 min, 1H, daily, or custom). Reverso bends to your style.
When a Reverso signal fires:
Price has reached a statistically extreme deviation from its historical memory.
The probability of a snapback to the mean is at its peak.
It’s time to go counter-trend with the lowest risk and the highest reward possible.
Customization Options
You can use it on any timeframe and instrument.
You can customize also the timeframe over which the signals are processed to suit very fast scalping trading or to intercept slower and longer movements for swing trading.
The sensitivity of the indicator can also be customized to emit multiple signals or identify only the most extreme levels of deviation from the mean.
Add to chart. Turn on alerts. Happy trading!
Bottom Up - The Ecosystem Designed for Traders
bottomup.finance

VIX vs VIX1Y SpreadSpread Calculation: Shows VIX1Y minus VIX
Positive = longer-term vol higher (normal contango)
Negative = near-term vol elevated (inverted term structure)
Can help identify longer term risk pricing of equity assets.

NQ-VIX Expected Move LevelsNQ -VIX Daily Price Bands
This indicator plots dynamic intraday price bands for NQ futures based on real-time volatility levels measured by the VIX (CBOE Volatility Index). The bands evolve throughout the trading day, providing volatility-adjusted price targets.
Formulas:
Upper Band = Daily Open + (NQ Price × VIX ÷ √252 ÷ 100)
Lower Band = Daily Open - (NQ Price × VIX ÷ √252 ÷ 100)
The calculation uses the square root of 252 (trading days per year) to convert annualized VIX volatility into an expected daily move, then scales it as a percentage adjustment from the current day's open.
Features:
Real-time band calculation that updates throughout the trading session
Upper band (green) extends from the current day's open
Lower band (red) contracts from the current day's open
Inner upper band (green) at 50% of expected move
Inner lower band (red) at 50% of expected move
Middle Inner upper band (green) at 80% of expected move
Middle Inner lower band (red) at 80% of expected move
Information table displaying:
Current NQ price and VIX level
Daily Open
Expected move

NQ-VIX Expected Move LTF LevelsNQ -VIX LTF Price Bands
This indicator plots dynamic intraday price bands for NQ futures based on real-time volatility levels measured by the VIX (CBOE Volatility Index). The bands evolve throughout the trading day, providing volatility-adjusted price targets.
Formulas:
Upper Band = (Input TF Open) + (NQ Price × VIX x √(Input TF ÷ (23h in min) ) ÷ 100
Lower Band = Daily Open - (NQ Price × VIX x √(Input TF ÷ (23h in min) ) ÷ 100
The calculation uses the square root of Input TF ÷ (23h in min) to convert annualized VIX volatility into an expected TF move, then scales it as a percentage adjustment from the current TF input's open.
Features:
Real-time band calculation that updates throughout the trading session
Upper band (green) extends from the current TF's open
Lower band (red) contracts from the current TF's open
Inner upper band (green) at 50% of expected move
Inner lower band (red) at 50% of expected move
Middle Inner upper band (green) at 80% of expected move
Middle Inner lower band (red) at 80% of expected move
Information table displaying:
Current input TF
Current NQ price and VIX level
Current input TF Open
Expected move

ES-VIX Expected Move LTF LevelsES-VIX LTF Price Bands
This indicator plots dynamic intraday price bands for ES futures based on real-time volatility levels measured by the VIX (CBOE Volatility Index). The bands evolve throughout the trading day, providing volatility-adjusted price targets.
Formulas:
Upper Band = (Input TF Open) + (ES Price × VIX x √(Input TF ÷ (23h in min) ) ÷ 100
Lower Band = Daily Open - (ES Price × VIX x √(Input TF ÷ (23h in min) ) ÷ 100
The calculation uses the square root of Input TF ÷ (23h in min) to convert annualized VIX volatility into an expected TF move, then scales it as a percentage adjustment from the current TF input's open.
Features:
Real-time band calculation that updates throughout the trading session
Upper band (green) extends from the current TF's open
Lower band (red) contracts from the current TF's open
Inner upper band (green) at 50% of expected move
Inner lower band (red) at 50% of expected move
Middle Inner upper band (green) at 80% of expected move
Middle Inner lower band (red) at 80% of expected move
Information table displaying:
Current input TF
Current ES price and VIX level
Current input TF Open
Expected move

Santhosh Time Block HighlighterI have created an indicator to differentiate market trend/momentum in different time zone during trading day. This will help us to understand the market pattern to avoid entering trade during consolidation/distribution. Its helps to measure the volatility and market sentiment

ATR + infoIt shows the ATR, the stop loss and stop profit levels, and the amount to invest based on capital and the risk you are willing to take.

價漲量增 + 力度 + 艾爾德 精簡版這是一套結合三大核心邏輯的多維強勢趨勢偵測系統:
PUVU 價漲量增:確認價格突破是否具備真實量能。
Strength 力度指標:整合 ROC、RSI 斜率、MACD 動能三項數據,轉換為 0–100 的標準化強度分數。
Elder Impulse System:以視覺化 K 棒顏色呈現趨勢動能變化。
此外,本工具加入 Trend Bias 趨勢偏向濾網、極端反手模式、精準信號三角形與可視化面板,
可用於判斷市場是否具備持續性動能、突破是否可信、反轉是否具備條件。
本指標適用於:
趨勢交易
波段突破
盤整突破偵測
高勝率強勢區辨識
多品種分析(加密貨幣、外匯、指數、股票)
此版本可用於觀察趨勢方向、尋找可能的交易機會與賣出時機。
For English users:
This script provides trend analysis, volume confirmation, strength scoring, and impulse-based visualization to assist traders in identifying potential breakouts and market conditions.
