VFI MagnoVFI – Virtual Football Index (Bet365)
A statistical mean-reversion indicator that compares the current “price” (white line) against a Fair Value baseline (SMA) and standard deviation bands.
When price moves outside the normal range:
OVER Signal (green triangle) → price below the lower band + momentum turning up (potential rebound / correction).
UNDER Signal (red triangle) → price above the upper band + momentum turning down (potential pullback / correction).
Background colors highlight extreme zones: green (scarcity/undersold) and red (excess/overbought).
Vfi_indicator_strategy

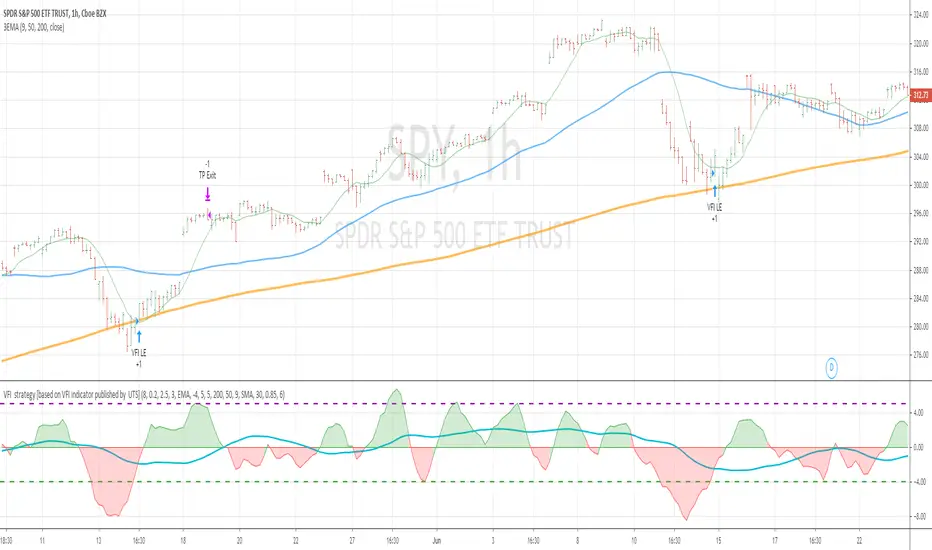
VFI strategy [based on VFI indicator published by UTS]This strategy is based on VFI indicator published by UTS.
for the strategy purpose , I have added buy line and sell line to the indicator and tested SPY stock/index on one hour chart
BUY RULE
==========
1. EMA 50 is above EMA 200
2. vfi line is pulled down and crossing above -4
EXIT RULE
==========
1. when vfi line crossing down 5
STOP LOSS
=========
1. default stop loss is set to 5%
ALL the above values (Buy Line , Sell line and Stop Loss ) can be modified in settings window
Notes :
more details of VFI indicator can be found at mkatsanos.com and precisiontradingsystems.com
Warning:
for educational purposes only