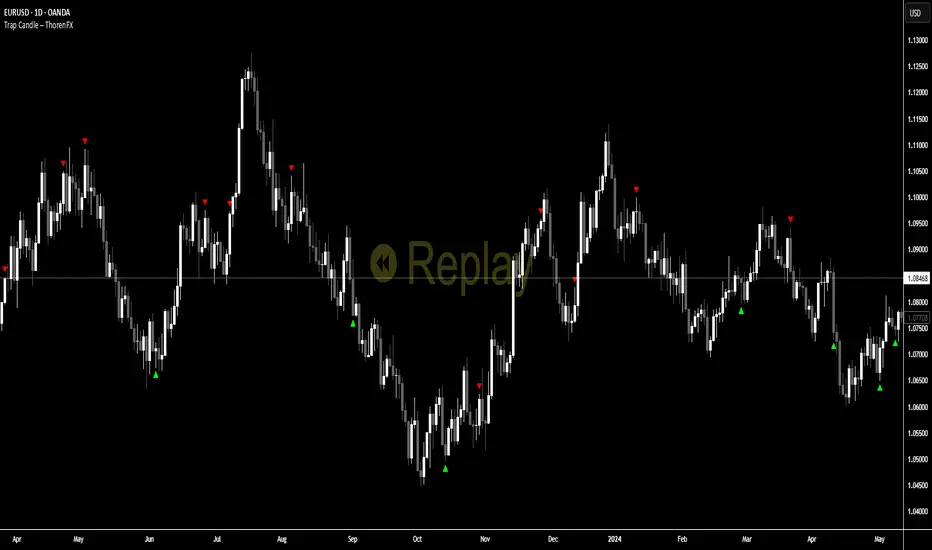
Trap Candle ThorenFXThis tool identifies Trap Candles by combining swing structure, bias shifts, and momentum shifts. The indicator evaluates recent highs and lows to define directional bias, tracks consecutive momentum candles using a custom AO-based sequence, and triggers signals only when the trend bias flips and momentum contradicts the prevailing direction.
The script uses a 20-candle swing lookback to detect the most recent Highest High and Lowest Low. When the market touches these swing extremes, the bias is updated (bullish or bearish). After a bias is confirmed, the indicator waits for a sequence of momentum candles in favor of the trend and then looks for an opposing candle to identify a trap.
Trap signals are only valid if they occur away from current swing extremes, filtering noise and late entries.
BUY Signal logic
Price touches a swing Low to set bullish bias
A minimum sequence of green momentum candles forms
First red momentum candle after the sequence triggers a BUY trap
Signal only prints if the swing Low is not hit again
SELL Signal logic
Price touches a swing High to set bearish bias
A minimum sequence of red momentum candles forms
First green momentum candle after the sequence triggers a SELL trap
Signal only prints if the swing High is not hit again
A compact table display highlights the latest active signal for quick visualization.
How to use
Use in trending or post-liquidity grab environments
BUY traps indicate potential bearish exhaustion followed by bullish reversal
SELL traps indicate potential bullish exhaustion followed by bearish reversal
Combine with structure confirmation and lower-timeframe entry techniques
Works best when aligned with swing bias and momentum context
Avoid signals that form directly at swing extremes; this filter is already built-in but additional confluence improves reliability
No indicator is 100% accurate — it’s all about understanding the logic behind the signals.
Trapzone
Dynamic FVG & Trap Zones📘 Dynamic FVG & Trap Zones (DFTZ)
A Hybrid Model Combining Imbalance Mapping, Volume Behavior, and Trap Detection
Concept Overview
“Dynamic FVG & Trap Zones” is built to visualize real-time Fair Value Gaps (FVGs) and identify liquidity trap events inside those gaps using adaptive volume filters and wick-based logic.
Traditional FVG indicators merely mark imbalance zones between consecutive candles, but this model goes further — it measures how volume reaction and price penetration inside those zones reveal potential f alse moves or trap formations by smart money.
⚙️ How It Works
1. FVG Detection
• A Bullish FVG is detected when low > high , showing a price void left by aggressive buying.
• A Bearish FVG forms when high < low , implying a selling imbalance.
• These zones are automatically drawn as semi-transparent boxes that extend forward for 10 bars and decay once they exceed the configurable lookback window.
2. Volume Normalization & Grading
• Every bar’s volume is compared against a dynamic SMA( volLookback ) average to calculate a Volume Grade = current vol / avg vol.
• Only bars exceeding the Min Volume Grade threshold are eligible to generate valid FVG zones, ensuring that low-participation moves are ignored.
• The Trap Volume Threshold sets how quiet the reaction bar must be (relative to average volume) to qualify as a trap event.
3. Trap Detection Logic
• Each active FVG zone monitors incoming candles.
• A potential trap is triggered when price re-enters the zone (body or wick depending on settings) but fails to expand with confirming volume.
• If the event occurs inside a Bullish FVG, it marks a Bear Trap (green zone turned red).
If it happens inside a Bearish FVG, it flags a Bull Trap (red zone turned green).
• This reversal in zone color visually conveys trapped liquidity and potential directional fade.
4. Exclusivity and Cooldown Control
• To avoid signal clustering, you can choose exclusivity modes:
Allow Both, Bear over Bull, or Bull over Bear.
• A built-in per-signal cooldown timer prevents back-to-back plots of the same type, enhancing signal clarity during rapid price action.
5. Adaptive Visualization
• Wick-based vs body-based trap detection (toggleable).
• Optional cooldown filtering on shapes ensures the chart only displays validated events.
• Old FVG boxes are pruned automatically beyond the chosen lookback horizon.
🧠 Why It’s Different
Unlike static FVG detectors or simple liquidity sweep tools, DFTZ blends:
• Volume context (Smart Volume Grade filtering)
• Behavioral trap detection within imbalance zones
• Dynamic cooldown mechanics that control over-signaling
• Forward-propagating zones that self-expire gracefully
This synergy makes it a compact yet powerful tool for visualizing imbalances + liquidity traps in one framework — ideal for discretionary traders combining SMC concepts with volume analytics.
📈 How to Use
• Primary Context: Use on 15 min to 1 h charts to spot active FVG zones forming after impulsive moves.
• Trap Signal Interpretation:
• 🔴 “Trap” below bar → Bullish reversal (Bear Trap).
• 🟢 “Trap” above bar → Bearish reversal (Bull Trap).
• Combine With: Market structure breaks, VWAP, or delta volume tools to confirm true reversal intent.
• Alerts: All major events (FVG creation & trap confirmation) trigger ready-to-use alerts for automation or back-testing.
🧩 Customization
Setting Function
Max FVG Lookback Controls how long old zones remain active.
Volume SMA Period Defines the baseline for volume grading.
Min Volume Grade & Trap Volume Threshold Tune the sensitivity of trap confirmation.
Wick-Based Trap Detection Enable to capture wick rejections inside zones.
Signal Cooldown Prevents rapid multiple plots on successive bars.
⚠️ Disclaimer
This tool is designed for educational and analytical purposes only. It does not constitute financial advice or guarantee trading performance. Always conduct your own analysis and risk management before entering a position.

4-Hour Range Scalping [v6.3]User Guide: 4-Hour Range Scalping Strategy
Hello! Here is the guide for the Pine Script strategy. Please read it carefully to get the best results.
📈 This script automates the "4-Hour Range Scalping Strategy" from the video.
The main idea is that the first four hours of a major trading day (like New York) set up a "trap zone." The strategy waits for the price to break out of this zone and then fail, giving us a signal that the breakout was false and the price is likely to reverse.
Here’s the simple logic:
Define the Range: It precisely calculates the highest high and lowest low during the first four hours of the selected trading session (e.g., 00:00 to 04:00 New York Time).
Wait for a Breakout: It then monitors the 5-minute chart for a price breakout where a candle fully closes outside of this established range.
Identify the Reversal: The trade trigger occurs when the price fails to continue its breakout and a subsequent 5-minute candle closes back inside the range. This signals a potential reversal or "failed breakout."
Execute the Trade:
]A Short (Sell) trade is triggered after a failed breakout above the range high.
A Long (Buy) trade is triggered after a failed breakout below the range low.
Manage the Risk: The Stop Loss is automatically placed at the peak (for shorts) or trough (for longs) of the breakout move, and the Take Profit is set to a default 2:1 Risk/Reward Ratio.
How to Use the Script (Step-by-Step) ⚙️
Follow these instructions to get it running perfectly.
1. Set Your Chart Timeframe This is the most important step. The strategy is designed to run on a 5-minute (5m) chart. Open your TradingView chart and make sure the timeframe is set to "5m".
2. Add the Script to Your Chart Open the Pine Editor tab at the bottom of TradingView, paste the entire script, and click the "Add to chart" button.
3. Configure the Settings On your chart, find the strategy's name (e.g., "4-Hour Range Scalping ") and click the gear icon ⚙️ to open its settings.
Trading Session: Choose the session for the range. New York is the default and the one from the video.
Risk/Reward Ratio: The default is 2.0, meaning your potential profit is twice your potential loss. You can adjust this to test other targets.
Backtesting Period: To see how the strategy performed on all historical data, go to the "Strategy Tester" panel, click its own gear icon ⚙️, and uncheck the boxes for "Start Date" and "End Date."
4. Understand the Visuals on Your Chart
Blue Background Area: This is the 4-hour calculation window. The script is identifying the day's high and low during this time. No trades will ever happen here.
Red Line (Range High): The highest price of the 4-hour window. This is the upper boundary of the "trap zone."
Green Line (Range Low): The lowest price of the 4-hour window. This is the lower boundary.
Green Triangle (▲): Shows where a Long (Buy) trade was entered.
Red Triangle (▼): Shows where a Short (Sell) trade was entered.
A Very Important Note on Timezones 🕒
This is critical for you in the Philippines (PHT).
The script is based on the New York session, which is 12 hours behind you. Your TradingView chart will still show your local time, but the script works on NY time in the background.
The New York "day" begins at 12:00 PM (Noon) your time.
The script's blue calculation window will be from 12:00 PM to 4:00 PM your local time.
The red and green range lines will appear on your chart only after 4:00 PM your time.
So, if you look at your chart in the morning or early afternoon, you will not see today's range yet. This is normal! The script is just waiting for the New York session to start.
How to Set Up Trade Alerts 🔔
You can have TradingView send you a notification whenever the script enters a trade.
Click the "Alert" button (looks like a clock) in the right-hand toolbar of TradingView.
In the "Condition" dropdown, select the name of the script (e.g., "4-Hour Range Scalping...").
You will then see two options: "Long Signal" and "Short Signal".
Select one (e.g., "Long Signal") and configure how you want to be notified (e.g., "Notify on app").
Click "Create". Repeat the process to create an alert for the other signal.
⚠️ Important Disclosure
For Educational and Research Purposes Only.
This script and all accompanying information are provided for educational and research purposes only. The strategy demonstrated is a technical concept and should not be misconstrued as financial, investment, legal, or tax advice.
Trading financial markets involves substantial risk and is not suitable for every investor. There is a possibility that you could sustain a loss of some or all of your initial investment. Therefore, you should not invest money that you cannot afford to lose.
Past performance is not indicative of future results. The backtesting results shown by this script are historical and do not guarantee future performance. Market conditions are constantly changing.
By using this script, you acknowledge that you are solely responsible for any and all trading decisions you make. You should conduct your own thorough research and, if necessary, seek advice from an independent financial advisor before making any investment decisions. The creators of this script assume no liability for any of your trading results.

Trap Zone — Shinobi LabPurpose
Trap Zone draws a clean intraday “no-man’s-land” and its surrounding + / – zones so you can quickly see where momentum trades are favored — and where to avoid fighting the tape. It also overlays ADR bands to frame extreme extensions.
How it works
Trap Zone core: Built from recent high/low lookbacks and key MAs. You can include MA200 in the box bounds (on by default) for stronger regime context.
+1 / –1 zones: Dynamic bands just outside the Trap Zone, sized by an adaptive EB minimum (bar-size floor based on instrument price) or average body size.
ADR bands (+/–): Daily range estimate using the last 20 sessions with outlier filtering (keeps the 5 most representative ranges under a safe cap).
Anchoring & visuals: New zones/ADR levels are projected from the prior session close with configurable left/right extension, labels (“++”, “––”, “+++”, “–––”), and a skull label inside the box.
Why it’s useful
Clarity at a glance: Above the box → long context; below the box → short context. Inside the box = trap area where signals are lower-quality.
Avoid the worst spots: The shaded center helps you skip chop and wait for clean breaks.
Frame extensions: ADR lines highlight when price is getting stretched beyond a typical session move.
Main features
MAs: 8 / 20 / 200 / 500 (200 is optional in the box logic).
Lookbacks: independent highs/lows for precise box edges.
Adaptive EB sizing drives +1 / –1 placement.
Outlier-robust ADR calculation.
Customizable colors, labels, and projection length.
Best practices
Treat the Trap Zone as a filter, not an entry signal.
Favor longs for signals above the box and shorts for signals below it.
Use with your signal tool (e.g., EB/TB V11.4) to time entries while the Trap Zone provides bias and location.
Inputs (highlights)
Include MA200 in Trap Zone (on/off)
Bars for High / Low (lookback)
Visual Extension Zones & Left Visual Extension
Show Zones / Show ADR Labels
MA lengths (8/20/200/500)
Notes
Designed for equities; ADR is computed at the end of the regular session and projected forward.
Works on intraday charts; precision set to 2 by default.

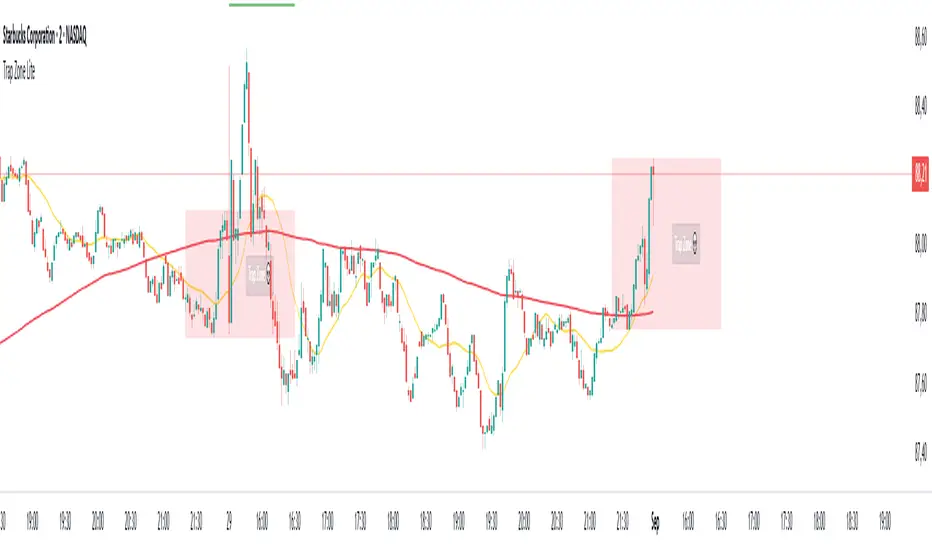
Trap Zone Lite – Shinobi LabThis indicator is designed for day traders, especially on lower timeframes such as the 2-minute chart. It highlights the Trap Zone: an area of congestion created by the 20-period moving average, the 200-period moving average, and the previous day’s closing price. This zone often acts as a heavy area of support or resistance where price can stall or trap participants.
What it shows:
A shaded Trap Zone box (congestion zone).
Two boundary lines that extend outward from the zone:
Zone + (above the trap) → context for bullish confirmation. A long signal forming here has stronger reliability.
Zone – (below the trap) → context for bearish confirmation. A short signal forming here has stronger reliability.
How to use:
The Trap Zone is meant as context, not signals. Traders should avoid taking setups inside the zone due to congestion. The value comes from using the boundaries:
Avoid shorting in Zone + (too much overhead resistance from prior day close + MAs).
Avoid longing in Zone – (too much downward pressure).
Focus on confirmations that occur outside the trap zone for higher-quality setups.
[GrandAlgo] Candle Trap ZonesThe Candle Trap Zones indicator identifies areas where price becomes "trapped" within a defined range and refines these zones using a proprietary algorithm. This unique approach ensures that only the most relevant zones, based on both proximity and price behavior, are highlighted for traders. By integrating advanced features like Fibonacci Cloud visualization and customizable detection parameters, the indicator offers tools to support detailed and adaptable price action analysis.
How It Works:
The Candle Trap Zones indicator evaluates historical price data to identify ranges where price has been trapped. Zones are filtered using proximity detection to prevent overlaps and maintain clarity. Additionally:
The strength parameter adjusts the sensitivity of zone identification, while the trap detection range determines how far back the algorithm evaluates price data.
The Fibonacci Cloud acts as an extension of the identified zones, providing additional precision by highlighting key levels just outside the zones
The auto-adjustment feature dynamically modifies zones if new zones are formed in close proximity, ensuring the chart reflects the most relevant areas.
The zone extension feature expands zones when price re-enters, allowing traders to track extended interactions with critical levels.
Key Features:
Proximity-Based Trap Zone Detection
Dynamically identifies and refines trap zones while avoiding overlaps to keep charts clean.
Fibonacci Cloud Integration:
Extends trap zones with Fibonacci-based levels, providing actionable reference points for potential reactions.
Customizable Detection Parameters:
Fine-tune zone detection with adjustable strength and range settings to suit various trading styles.
Real-Time Alerts:
Sends notifications when price enters, exits, or re-tests a trap zone, enabling timely trading decisions.
Dynamic Zone Updates:
Continuously recalculates zones as new data becomes available, reflecting current market conditions.
Clear and Intuitive Visuals:
Trap zones and Fibonacci clouds are highlighted in distinct colors for seamless chart analysis.
Use Cases:
Identify areas where price consolidates or liquidity builds up.
Monitor zones for potential breakouts or reversals.
Fibonacci Clouds serve as additional reference points for anticipating market reactions and refining trade setups
Trap zones may highlight areas of accumulation or distribution where traders can anticipate price reversals or breakouts.
Useful for identifying liquidity zones in range-bound markets or pinpointing key levels for breakout trades in trending markets.
Adaptable for use in Forex, crypto, stocks, and other trading markets.
Disclaimer:
This indicator is a technical analysis tool designed to assist traders by providing insights into market conditions. It does not guarantee future price movements or trading outcomes and should not be relied upon as a sole decision-making tool. The effectiveness of this indicator depends on its application, which requires your trading knowledge, experience, and judgment.
Trading involves significant financial risk, including the potential loss of capital. Past performance of any tool or indicator does not guarantee future results. This script is intended for educational and informational purposes only and does not constitute financial or investment advice. Users are strongly encouraged to perform their own analysis and consult with a qualified financial professional before making trading decisions.

TrapZone ProThis script combines the concepts of Price Action, Trend and Momentum to identify Price Zones (Red and Green filled areas) and Price Bars (Red, Green and Gray) where traders can get trapped in the Market.
It will clearly mark the bars which favor the prevailing Trend and those bars which just don't have the momentum anymore. TrapZone moves with the market trend and will often provide it support. As the TrapZone changes direction & its color, traders can change their trade bias.
Features:
Identify strong & weak price action - By leveraging a regression calculation of price movement on Y axis against the x axis, we identify the strength of current bars. Increasing relative strength of bars indicate Bullish (Green Bars) & Bearish (Red Bars) price movement, respectively. As the relative strength starts to decrease in Bullish or Bearish price action, the indicator immediately changes the color of these bars to Gray (by default). We call these TrapBars .
Current price trend - By using the highs and lows of price in multiple periods, we are calculating the trend of the price. The Bullish trend is shown by the Green zone and Bearish trend is shown by the Red zone. These zones are the shaded areas which are plotted on the chart. If the price is in these Zones, Longs or Short trades are not advised as that price action is weak. We call these TrapZones .
Strength of the Momentum - the thickness of the TrapZone shows the strength of the current Bullish or Bearish trend. That means the wider the shaded area grows the stronger is the current market momentum. A Flat TrapZone indicates sideways price action.
Knowing when NOT to Trade is as important as when to Trade. While this indicator is designed to avoid taking bad trades such as FOMO, Catching a Falling Knife or Fighting The Trend , it successfully reveals the good trade setups!
How these features of this indicator helps Traders avoids common mistakes:
FOMO or Fear of Missing Out - If a Trader Sees TrapBars in a Bullish or Bearish Trend, they will avoid entry as the price action is weak at that time. This will avoid late entries.
Catching a Falling Knife (a.k.a. Picking a Bottom) - When Red TrapZone is being plotted, Traders can avoid taking Long Entries hoping for a price reversal.
Fighting The Trend (a.k.a Picking a Top) - When Green TrapZone is being plotted, Traders can avoid taking Short entries hoping for a price reversal.
TrapZone Pro does all this in a single panel of the chart irrespective of the market or timeframe.
How to use TrapZone Pro indicator for trading [
A. Market Analysis
Green TrapZone is Bullish and traders should not take Shorts. If Green TrapZone is moving higher, Market is Strong
Red TrapZone is Bearish and traders should not take Longs. If Red TrapZone is moving Lower, Market is Strong
No trades when TrapBars are forming
No trades inside the TrapZone
B. Trade Guidance System
Establish Market Bias - Bullish or Bearish using the TrapZone Color
Only Enter Long in Long Color Bars i.e. Green by default
Only Enter Short in Short Color Bars i.e. Red by default
3 Classes of Trades are Possible Class A, B & C. A being the best Reward : Risk ratio and C being the least rewarding. So use trade size accordingly.
Class A - Best bars are always the first & Second, close to the TrapZone
Class B - Long Bar or Short Bar Forming after TrapBar away from the TrapZone in a Strong Market
Class C - Long Bar or Short Bar Forming after TrapBar close to the TrapZone in a Flat Market (identified by Flat TrapZone )
Take profits when Price moves away from the TrapZone & TrapBars start forming OR Your Target is hit !
See a few examples of Trade Classes & Entries/ Exits for a better understanding
Recommendations
Select Session to “Electronic Trading Hours” in chart settings so you can see the Post & Pre Market trading as well. You can change the color of these sessions to the same color as chart background, so it is not distracting.
Start by Trading in the Hourly or Daily time frame to get used to the new indicator and its Trade Guidance System .
Position Size is the best form of Risk Management. Have a fixed dollar loss per trade pre-determined and adjust the size based on market volatility.
Even though this indicator is designed to work on any market or timeframe, trade the markets that you are familiar with and timeframe that matches your lifestyle. Your understanding of the instrument's behavior and knowledge of what makes it move is valuable.
Basic Set-Up
Add the Indicator to the chart
Open Chart Settings and in Symbol Section
Switch off “ Borders ”
Switch off “ Wick ” or Change the colors to a same non-distracting color like Black or Gray
Open TrapZone Pro Settings
Set the colors for the “ Long Bars ”, “ Short Bars ” & “ No Entry Bars ” if you wish to change the default colors
Change “ TrapZone ” colors to your Taste or leave the defaults
Green for “Color 0” that represents Bullish Price Action
Red for “Color 1” that represents Bearish Price Action
Important Advice & Disclaimer: This indicator does not guarantee that you will make money. It is a tool that performs market analysis for you and presents it in a easy to consume fashion. Markets are truly random and can change direction on a dime. You must use prudent risk and money management strategy based on your investor profile, investment objectives and risk appetite.
To Get Access - See Author’s instructions below
