Wyckoff Effort vs. Result📌 Wyckoff Effort vs. Result (E/R) – Visualizing Supply & Demand Imbalance with Volume Confirmation
📖 Overview
The Wyckoff Effort vs. Result (E/R) indicator is designed to help traders interpret market behavior through the lens of volume vs. price movement — a foundational concept in Richard Wyckoff’s methodology.
This tool aims to highlight moments where the “effort” (volume) is not in proportion to the “result” (price movement) — giving insight into potential accumulation or distribution events.
By detecting high-volume candles and classifying them based on their price direction, the indicator visualizes zones where smart money might be active .
⚙️ How It Works
1. Effort Accumulation (High Volume Down Bar):
• When a candle closes lower than it opens (down bar) and has above-average volume , it’s marked as potential absorption of selling pressure (effort to push down met by buying).
• These candles are colored red and the open level is plotted, acting as a potential support or re-test zone.
2. Effort Distribution (High Volume Up Bar):
• When a candle closes higher than it opens (up bar) and has above-average volume , it’s marked as potential distribution (effort to push up absorbed by sellers).
• These candles are colored green and the open level is plotted , acting as a potential resistance or rejection zone.
3. Average Volume Calculation:
• The script calculates a simple moving average (SMA) of volume over a user-defined lookback period.
• If current volume exceeds the average multiplied by a set threshold, it’s treated as a high-effort bar .
🧪 Inputs
Input Description
Average Volume Lookback - Number of bars used to calculate the volume average
High Volume Multiplier. - Multiplier to define what qualifies as “high volume”
🖥️ Visual Output
• 🔴 Red candles = High volume on a down bar → possible accumulation
• 🟢 Green candles = High volume on an up bar → possible distribution
• 📉 Horizontal lines at bar open price mark the potential zones where effort occurred
These zones can serve as:
• Areas of support/resistance
• Trap zones where smart money absorbs liquidity
• Entry/exit filters when combined with price action
🧠 How to Use
• Use in combination with price structure, support/resistance, and volume profile tools
• Watch how price reacts when it revisits the plotted lines
• Look for effort bars that fail to lead to continuation, signaling potential reversal
• Can be used in scalping, swing trading, or Wyckoff-style phase analysis
🔒 Technical Notes
• ✅ Does not repaint
• ✅ Built with Pine Script v6
• ✅ Lightweight and customizable
• ❌ Does not generate buy/sell signals — it provides context, not predictions
Tradetechanalysis

Impulse Range Compression & Expansion (IRCE)📌 Impulse Range Compression & Expansion (IRCE) – Visualizing Price Traps Before Breakouts
📖 Overview
The IRCE Indicator is a precision breakout detection tool designed to identify consolidation traps and price coil zones before expansion moves occur. Unlike traditional volatility indicators that rely solely on statistical thresholds (e.g., Bollinger Bands or ATR), IRCE focuses on behavioral price compression, detecting tight-range candle clusters and validating breakouts through body expansion and/or volume surges.
This makes it ideal for traders looking to:
• Catch breakouts from range traps
• Avoid choppy and premature signals
• Spot early-stage momentum moves based on clean price behavior
⸻
⚙️ How It Works
1. Impulse Range Compression Detection
• Measures the high-low range of each candle
• Compares it to a user-defined average range (default 7 bars)
• Flags candles where the range is significantly smaller (e.g., <60% of average)
• Groups these into tight clusters, indicating compression zones or potential “trap ranges”
2. Cluster Box Construction
• When a valid cluster (e.g., 3 or more tight candles) is detected, the indicator:
• Marks the high and low of the cluster
• Draws a shaded box over this “trap zone”
• This helps visually track where price has coiled before a breakout
3. Breakout Confirmation Logic
A breakout from the trap zone is only validated when:
• Price closes above the cluster high (bullish) or below the cluster low (bearish)
• One or both of the following confirm strength:
• Body Expansion: Current candle body is 120%+ of recent average
• Volume Expansion: Volume exceeds recent volume average
4. Optional Trend Filter
• An optional EMA filter (default: 50 EMA) ensures breakout signals align with trend direction
• Helps filter out countertrend noise in ranging markets
5. Signal Cooldown
• Prevents repeated signals by enforcing a cooldown period (e.g., 10 bars) between entries
⸻
🖥️ Visual Elements
• 📦 Yellow compression boxes represent tight price traps
• 🟢 Buy labels appear when price breaks above the trap with confirmation
• 🔴 Sell labels appear when price breaks below with confirmation
• All visuals are non-repainting and updated in real-time
🧠 How to Use
1. Wait for a yellow trap box to appear
2. Watch for a confirmed breakout from the trap zone
3. Take the trade in the direction of the breakout:
• Only if it satisfies body or volume confirmation
• And if trend alignment is enabled, it must match EMA direction
4. Place stops just outside the opposite end of the trap zone
5. Use risk/reward ratios or structure levels for exits
This logic works great on:
• Lower timeframes (scalping breakouts)
• Higher timeframes (detecting price coiling before major moves)
• Any market: Stocks, Crypto, FX, Commodities
⸻
🔒 Technical Notes
• ✅ No repainting
• ✅ No future-looking logic
• ✅ Suitable for both discretionary and systematic traders
• ✅ Built in Pine Script v6

Cycle-Synced Channel Breakout📌 Cycle-Synced Channel Breakout – Detect Breakouts Confirmed by Candles and Momentum Cycles
📖 Overview
The Cycle-Synced Channel Breakout indicator is a precision breakout detection tool that combines the power of:
• Adaptive Keltner Channels
• Dominant Cycle Period Analysis (Ehlers-inspired)
• Candlestick Pattern Recognition (Engulfing)
This multi-layered approach helps identify true breakout opportunities by filtering out noise and false signals, making it ideal for swing traders and intraday traders seeking high-probability directional moves.
⚙️ How It Works
1. Keltner Channel Envelope
A dynamic volatility channel based on the EMA and ATR defines the upper and lower bounds of price movement.
2. Engulfing Candle Detection
The script detects strong bullish and bearish engulfing patterns, which often signal trend reversals or momentum continuations.
3. Dominant Cycle Momentum (Ehlers-inspired)
Using a smoothed power oscillator derived from a detrended price series, the indicator assesses whether momentum is accelerating during the breakout — filtering out weak moves.
4. Signal Confirmation Logic
A signal is only shown when:
• An engulfing pattern is detected, and
• Price breaks out of the Keltner Channel, and
• Momentum (cycle power) is rising
5. Visual Feedback
• Breakout signals are plotted with “BUY” or “SELL” labels
• Faded green/red background highlights confirmed breakouts
• Optional display of engulfing candles with triangle markers
⸻
🛠️ Key Features
• ✅ Adaptive Keltner Channels
• ✅ Bullish/Bearish Engulfing Candle Recognition
• ✅ Ehlers-style Cycle Momentum Confirmation
• ✅ Background highlights for confirmed breakouts
• ✅ Optional candle pattern visualization
• ✅ Lightweight and Pine v6 compatible
⸻
🧪 Inputs
• Keltner Length – EMA period for channel basis
• Multiplier – Multiplied with ATR to determine band width
• Cycle Lookback – Used to calculate smoothed cycle power
• Show Engulfing Candles? – Toggles candlestick signals
• Show Breakout Signals? – Toggles breakout labels and backgrounds
⸻
🧠 How to Use
• Look for “BUY” or “SELL” labels when:
• An engulfing candle breaks through the Keltner Channel
• Cycle momentum confirms strength behind the move
• The background color will faintly highlight the breakout direction.
• Use in combination with other trend or volume indicators for added confluence.
🔒 Notes
• This indicator is not repainting.
• It is designed for educational and research purposes only.
• Works across all timeframes and asset classes (stocks, crypto, forex, etc.)

Smart Wick AnalyzerSmart Wick Analyzer (SWA)
Purpose: Highlight potential liquidity‑grab candles (long wicks) and turn them into actionable, rule‑based buy/sell signals with trend, volume, and cooldown filters.
Type: Indicator (not a strategy). Educational tool to contextualize wick events.
🧠 What This Script Does
SWA looks for candles where the wick is large relative to its body—a common signature of liquidity sweeps / rejection. It then adds three confirmations before marking a trade signal:
1. Wick Event
• Upper‑wick event (possible rejection from above)
• Lower‑wick event (possible rejection from below)
• Condition: wick length > body × Wick‑to‑Body Ratio
2. Context Filters
• Trend filter : closing price vs. SMA of lookbackBars
• Volume filter : current volume vs. average volume × volumeThreshold
3. Signal Hygiene
• Cooldown : prevents clustering; a minimum number of bars must pass before a new signal is allowed.
If a candle passes these checks:
• Buy Signal (triangle up): long lower wick + price above SMA + relative‑high volume + cooldown passed
• Sell Signal (triangle down): long upper wick + price below SMA + relative‑high volume + cooldown passed
The signal candle is also bar‑colored black for quick visual focus.
⸻
✳️ What the Dotted Lines Mean (including the green one)
On every signal bar the script draws two dotted horizontal levels, extended to the right:
• Open line of the signal candle
• Close line of the signal candle
• They use the signal color: green for Buy, red for Sell.
How to interpret (example: green = Buy signal):
• The green dotted close line represents the momentum validation level. If subsequent candles close above this line, it indicates follow‑through after the wick rejection (buyers defended into the close).
• The green dotted open line is a risk context / invalidation reference. If price falls back below it soon after the signal, the wick event may have failed or devolved into chop.
In your annotated chart: the candle initially looked constructive (“closing above could be positive momentum”), but later price failed and rotated down—hence a sell signal interpreted when an upper‑wick event occurred under down‑trend conditions.
⸻
⚙️ Inputs & What They Control
• Wick‑to‑Body Ratio (wickThreshold): how “extreme” a wick must be to count as a liquidity‑grab.
• Lookback Period (lookbackBars):
• SMA period for trend context
• Volume MA for relative‑volume check
• Volume Multiplier (volumeThreshold): strengthens/loosens volume confirmation.
• Cooldown Bars (cooldownBars): minimum spacing between consecutive signals.
• Enable Alerts (showAlerts): turns on alert conditions.
⸻
🔔 Alerts (exact titles)
• “SWA Buy Alert” — potential reversal / Buy signal detected
• “SWA Sell Alert” — potential reversal / Sell signal detected
⸻
📌 How to Use (practical guide)
1. Scan for the black‑colored signal candle and its dotted lines.
2. For Buy signals (green): Prefer continuation if price closes above the green close line within the next few bars. Manage risk using the open line or your own level.
3. For Sell signals (red): Prefer continuation if price closes below the red close line.
4. Avoid chasing during low‑volume / counter‑trend signals; the filters help, but structure (HTF trend, S/R, session context) still matters.
5. Use the cooldown to reduce noise on fast time frames.
⸻
✅ Why This Isn’t Just “Another Wick Indicator”
• The script does not flag every long‑wick; it requires trend alignment and relative volume to suggest participation.
• The two reference lines (open/close) provide post‑signal state tracking—a simple, visual framework to judge follow‑through vs. failure without additional tools.
• Cooldown logic discourages clustered, low‑quality repeats around the same zone.
⸻
⚠️ Notes & Limitations
• Works across markets/time frames, but wick behavior varies by instrument and session. Parameters may need adjustment.
• Signals are contextual, not guarantees. Consolidation and news spikes can invalidate wick reads.
• This indicator is not a strategy; it does not backtest performance on its own.
⸻
📄 Disclaimer
This tool is for educational purposes only and should be combined with personal analysis and risk management. Markets are uncertain; past behavior does not guarantee future results.

Candle Range Detector by TradeTech AnalysisCandle Range Detector by TradeTech Analysis
This advanced indicator identifies and visualizes price compression zones based on inside bar formations, then tracks how price behaves around those zones — offering valuable insights into liquidity sweeps, range expansions, and trap/mitigation behavior.
The script builds upon the foundational concept of range-based price action, commonly used by institutional traders, and adds automation, mitigation tracking, and sweep detection to map how price reacts around these critical ranges.
🔍 How It Works:
• Range Formation: A new range is detected when the current candle forms entirely within the high and low of the previous candle (i.e., an inside bar). This behavior often indicates price compression and potential breakout zones.
• Range Extension: Once a range is confirmed, the script projects upper and lower boundaries (using either a percentage-based multiplier or Fibonacci log extension), providing context for expected breakout zones.
• Mitigation Tracking: The script continuously monitors whether price breaks above or below the projected extensions, marking that range as mitigated — useful for confirming whether liquidity was absorbed.
• Sweep Detection: If price re-visits a mitigated zone and shows signs of a liquidity sweep (via wick + close behavior), the indicator triggers visual sweep labels and optional alerts.
🧠 Optional Visual Enhancements:
• Highlight range-forming candles with light blue background (toggle on/off)
• Midpoint dotted line for symmetry analysis
• Labels for “Range High” and “Range Low” for visual clarity
• Dynamic box drawing that adapts upon mitigation or continuation
⚙️ Customizable Features:
• Choose between Normal and Fibonacci-based detection modes
• Toggle visibility of range boxes, extension lines, and sweep markers
• Configure sweep alerts, mitigation window size, and visual transparency
⸻
🧪 Use Cases
• Identify consolidation zones before major price moves
• Confirm liquidity sweeps for entry/exit traps
• Visualize and test mitigation behavior of past zones
• Combine with Order Flow or Volume Profile tools to enhance context
⸻
⚠️ This is a fully original implementation that goes beyond classical inside-bar scanners by incorporating mitigation, extension projection, and liquidity sweeps — making it a powerful tool for intraday, swing, and even Smart Money-based trading setups.

Institutional Support/Resistance Locator🏛️ Institutional Support/Resistance Locator
Overview
The Institutional Support/Resistance Locator identifies high-probability demand and supply zones based on strong price rejection, large candle bodies, and elevated volume . These zones are commonly targeted or defended by institutional participants, helping traders anticipate potential reversal or continuation areas.
⸻
How It Works
The indicator uses a confluence of conditions to detect zones:
• Large Body Candles: Body size must exceed the moving average body size multiplied by a user-defined factor.
• High Volume: Volume must exceed the moving average volume by a configurable multiplier.
• Wick Rejection: Candles must show strong upper or lower wicks indicating aggressive rejection.
• If all criteria are met:
• Bullish candles form a Demand Zone.
• Bearish candles form a Supply Zone.
Each zone is plotted for a customizable number of future bars, representing areas where institutions may re-engage with the market.
⸻
Key Features
• ✅ Highlights institutional demand and supply areas dynamically
• ✅ Customizable sensitivity: body, volume, wick, padding, and zone extension
• ✅ Zones plotted as translucent regions with auto-expiry
• ✅ Works across all timeframes and markets
⸻
How to Use
• Trend Traders: Use demand zones for potential bounce entries in uptrends, and supply zones for pullback short entries in downtrends.
• Range Traders: Use zones as potential reversal points inside sideways market structures.
• Scalpers & Intraday Traders: Combine with volume or price action near zones for refined entries.
Always validate zone reactions with supporting indicators or price behavior.
⸻
Why This Combination?
The combination of wick rejection, volume confirmation, and large candle structure is designed to reflect footprints of smart money. Rather than relying on fixed pivots or subjective zones, this logic adapts to the current market context with statistically grounded conditions.
⸻
Why It’s Worth Using
This tool offers traders a structured way to interpret institutional activity on charts without relying on guesswork. By plotting potential high-impact areas, it helps improve reaction time.
⸻
Note :
• This script is open-source and non-commercial.
• No performance guarantees or unrealistic claims are made.
• It is intended for educational and analytical purposes only.

Sentiment Bias Gauge📌 Overview
The Sentiment Bias Gauge (SBG) is a unique overlay-style indicator that visually maps a sentiment value—such as market bullishness or bearishness—onto your price chart. It converts sentiment data (in this case, RSI-based) into a floating line that moves between defined price zones, allowing users to quickly understand the current market mood in the context of price.
⚙️ How It Works
• The indicator uses RSI (Relative Strength Index) as a proxy for market sentiment (0 to 100 scale).
• This sentiment value is then mapped to a vertical price range on your chart using a configurable zone (via top and bottom percent of chart range).
• The line floats up or down within the price chart, reflecting how bullish or bearish the sentiment is.
• It includes background shading to represent the sentiment level:
• 🔴 Red (Bearish): sentiment < 30
• 🟡 Yellow (Neutral): 30 ≤ sentiment ≤ 70
• 🟢 Green (Bullish): sentiment > 70
• A floating label shows the current sentiment score.
🌟 Key Features
• 📈 Overlay-Based Sentiment Line: Plots sentiment as a price-level line, giving intuitive spatial reference.
• 🔧 Configurable Range Placement: Adjust where the sentiment line appears within the chart’s high-low range.
• 🖌️ Color-Coded Background: Visually distinguish bullish, bearish, and neutral conditions.
• 🏷️ Real-Time Sentiment Label: Displays updated sentiment score on the most recent bar.
🧠 How to Use
• Use this indicator alongside your price action or technical strategy to gauge market mood.
• Combine with other sentiment indicators (e.g., fear/greed, delta volume, news sentiment).
• Especially helpful in sideways markets to identify potential shifts in bias before price reacts.
Why This Combination?
• RSI offers a reliable and intuitive proxy for market sentiment.
• Mapping the value directly onto the chart helps avoid constantly looking at a separate panel.
• The customizable chart range lets traders fit sentiment visuals within any market structure.
🎯 Why It’s Worth Using
• Makes sentiment visually accessible directly on the chart.
• Helps detect bullish/bearish bias shifts earlier than traditional indicators.
• A great tool for sentiment-aware discretionary trading or contextual overlays in algo strategies.

Time-Weighted Price Action IndicatorThe Time-Weighted Price Action Indicator is a simple yet effective tool designed to detect consolidation zones based on time duration and highlight potential reversal points using a contrarian breakout logic. Instead of following traditional breakout strategies, this indicator aims to capitalize on false breakouts and reversal entries.
How It Works
• The indicator identifies a price range (zone) using a configurable lookback period.
• If the price remains within this range for a specified number of bars (threshold), a consolidation zone is confirmed.
• Once a breakout or breakdown from this zone occurs, the indicator triggers a reversed signal — suggesting a potential reversal instead of a trend-following entry.
• Support and resistance levels are marked visually, and BUY/SELL labels are plotted when price re-enters the zone, indicating potential exhaustion or traps.
Key Features
• ✅ Time-based consolidation detection
• ✅ Contrarian signal logic (Buy at breakdowns, Sell at breakouts)
• ✅ Dynamic zone plotting with support/resistance visualization
• ✅ Auto-reset after each breakout for fresh zone detection
• ✅ Visual labels and alerts for BUY/SELL signals
How to Use
• Ideal for range-bound markets or identifying trap zones around support/resistance.
• Use in conjunction with volume, momentum, or trend filters to refine entries.
• Can complement mean reversion strategies or be used as a signal confirmation tool.
Why This Combination?
This approach blends time-based consolidation logic with a contrarian price action perspective, offering traders a different lens to analyze markets. Instead of blindly following breakouts, it highlights areas where price rejections and false breakouts often occur — common in algorithm-driven markets.
Why It’s Worth Using
This indicator helps you stay ahead of trap zones, identify reversal spots, and understand price behavior in consolidation zones — a critical edge, especially in sideways or choppy markets. It adds context to price movement, helping traders avoid common breakout failures.
Note:
• No performance guarantees or exaggerated claims.
• No solicitation or promotional language used.
• This is a free, open-source educational tool meant to aid price action understanding.

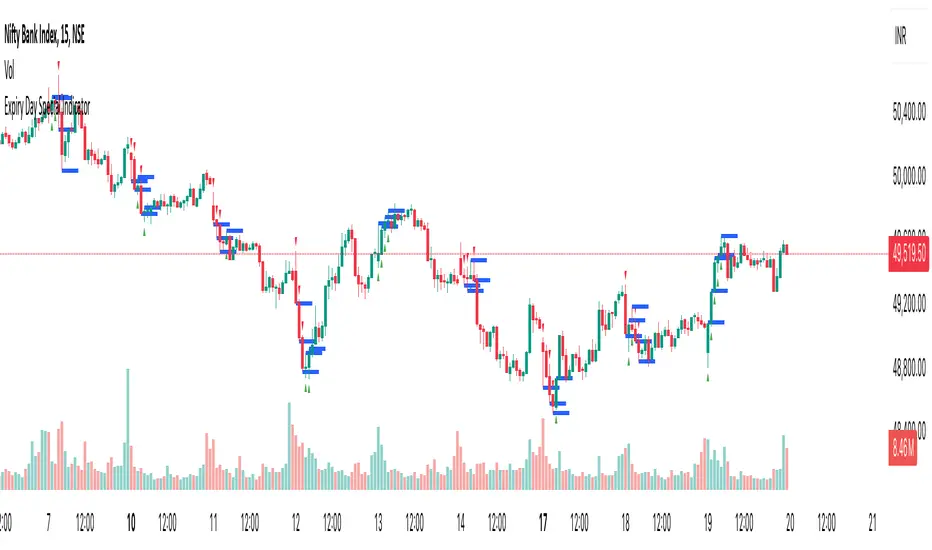
Expiry Day Special IndicatorExpiry Day Special Indicator
The Expiry Day Special Indicator is designed to detect catalytic price action patterns that commonly occur between 9:15 AM to 10:15 AM (IST) in the Nifty & Bank Nifty markets but not limited to these specific markets. While these patterns are particularly useful on expiry days, they are not limited to expiry trading alone. They can also be applied on other trading days when similar conditions arise, making them versatile for intraday traders.
How It Works
This indicator scans for bullish and bearish price action patterns within the first trading hour and plots potential buy and sell signals based on key market structures.
• Bearish Patterns: Identifies strong rejection zones and weakness in price action to signal potential short trades.
• Bullish Patterns: Recognizes reversal formations that indicate potential long trade opportunities.
• Time Filter: The setup is valid only between 9:15 AM - 10:15 AM (IST) to focus on high-impact market moves.
Why This Indicator?
1. Specialized for Nifty & Bank Nifty – Designed specifically for Indian markets.
2. Early Trend Identification – Helps traders capture moves early in the session.
3. Works Beyond Expiry Days – Although optimized for expiry trading, it can also detect similar patterns on regular days.
📌 Note: This indicator does not provide trading advice; always use proper risk management.
Cluster Reversal Zones📌 Cluster Reversal Zones – Smart Market Turning Point Detector
📌 Category : Public (Restricted/Closed-Source) Indicator
📌 Designed for : Traders looking for high-accuracy reversal zones based on price clustering & liquidity shifts.
🔍 Overview
The Cluster Reversal Zones Indicator is an advanced market reversal detection tool that helps traders identify key turning points using a combination of price clustering, order flow analysis, and liquidity tracking. Instead of relying on static support and resistance levels, this tool dynamically adjusts to live market conditions, ensuring traders get the most accurate reversal signals possible.
📊 Core Features:
✅ Real-Time Reversal Zone Mapping – Detects high-probability market turning points using price clustering & order flow imbalance.
✅ Liquidity-Based Support/Resistance Detection – Identifies strong rejection zones based on real-time liquidity shifts.
✅ Order Flow Sensitivity for Smart Filtering – Filters out weak reversals by detecting real market participation behind price movements.
✅ Momentum Divergence for Confirmation – Aligns reversal zones with momentum divergences to increase accuracy.
✅ Adaptive Risk Management System – Adjusts risk parameters dynamically based on volatility and trend state.
🔒 Justification for Mashup
The Cluster Reversal Zones Indicator contains custom-built methodologies that extend beyond traditional support/resistance indicators:
✔ Smart Price Clustering Algorithm: Instead of plotting fixed support/resistance lines, this system analyzes historical price clustering to detect active reversal areas.
✔ Order Flow Delta & Liquidity Shift Sensitivity: The tool tracks real-time order flow data, identifying price zones with the highest accumulation or distribution levels.
✔ Momentum-Based Reversal Validation: Unlike traditional indicators, this tool requires a momentum shift confirmation before validating a potential reversal.
✔ Adaptive Reversal Filtering Mechanism: Uses a combination of historical confluence detection + live market validation to improve accuracy.
🛠️ How to Use:
• Works well for reversal traders, scalpers, and swing traders seeking precise turning points.
• Best combined with VWAP, Market Profile, and Delta Volume indicators for confirmation.
• Suitable for Forex, Indices, Commodities, Crypto, and Stock markets.
🚨 Important Note:
For educational & analytical purposes only.

Candle Momentum ExhaustionCandle Momentum Exhaustion
The Candle Momentum Exhaustion indicator is designed to help traders spot potential turning points in a trend by identifying when the prevailing momentum may be “running on empty.” The indicator works by comparing the size of each candle’s body (the absolute difference between the open and close) to the average body size over a recent period. When a candle’s body exceeds a user‐defined multiple of this average, it is flagged as an “exhaustion” candle.
• A bullish exhaustion (shown with a red down–facing triangle above the bar) occurs when a very large bullish candle (close > open) is detected, suggesting that buyers may have pushed the price too far and the rally could be near its end.
• A bearish exhaustion (shown with a green up–facing triangle below the bar) occurs when a very large bearish candle (close < open) is detected, implying that selling pressure might be overdone.
These signals can alert you to a potential reversal or consolidation point. The script also includes alert conditions so that you can set up notifications whenever an exhaustion signal is generated.
How It Works
1. Average Candle Body:
The script computes a simple moving average (SMA) of the absolute candle bodies over a user-defined period (default is 14 bars).
2. Exhaustion Candidate:
A candle is flagged as an exhaustion candidate if its body size exceeds the average by more than the set multiplier (default is 2.0).
3. Signal Identification:
• If the exhaustion candle is bullish (close > open), it is marked with a red down–facing triangle above the bar.
• If it is bearish (close < open), it is marked with a green up–facing triangle below the bar.
4. Alerts:
The built-in alertcondition() calls allow you to set alerts (via TradingView’s alert system) so that you can be notified when an exhaustion event occurs.
Risk Disclaimer:
This indicator is provided for educational and informational purposes only and does not constitute financial, investment, or trading advice. Trading and investing involve significant risk, and you should not rely solely on this indicator when making any trading decisions. Past performance is not indicative of future results. Always perform your own due diligence and consult with a qualified financial advisor before making any financial decisions. The creator of this indicator shall not be held responsible for any losses incurred through its use.

Multi-Timeframe Confluence IndicatorThe Multi-Timeframe Confluence Indicator strategically combines multiple timeframes with technical tools like EMA and RSI to provide robust, high-probability trading signals. This combination is grounded in the principles of technical analysis and market behavior, tailored for traders across all styles—whether intraday, swing, or positional.
1. The Power of Multi-Timeframe Confluence
Markets are influenced by participants operating on different time horizons:
• Intraday traders act on short-term price fluctuations.
• Swing traders focus on intermediate trends lasting days or weeks.
• Position traders aim to capture multi-month or long-term trends.
By aligning signals from a higher timeframe (macro trend) with a lower timeframe (micro trend), the indicator ensures that short-term entries are in harmony with the broader market direction. This multi-timeframe approach significantly reduces false signals caused by temporary market noise or counter-trend moves.
Example: A bullish trend on the daily chart (higher timeframe) combined with a bullish RSI and EMA alignment on the 15-minute chart (lower timeframe) provides a stronger confirmation than relying on the 15-minute chart alone.
2. Why EMA and RSI Are Essential
Each element of the indicator serves a unique role in ensuring accuracy and reliability:
• EMA (Exponential Moving Average):
• A dynamic trend filter that adjusts quickly to price changes.
• On the higher timeframe, it establishes the overall trend direction (e.g., bullish or bearish).
• On the lower timeframe, it identifies precise entry/exit zones within the trend.
• RSI (Relative Strength Index):
• Adds a momentum-based perspective, confirming whether a trend is backed by strong buying or selling pressure.
• Ensures that signals occur in areas of strength (RSI > 55 for bullish signals, RSI < 45 for bearish signals), filtering out weak or uncertain price movements.
By combining EMA (trend) and RSI (momentum), the indicator delivers confluence-based validation, where both trend and momentum align, making signals more reliable.
3. Cooldown Period for Signal Optimization
Trading in choppy or sideways markets often leads to overtrading and false signals. The cooldown period ensures that once a signal is generated, subsequent signals are suppressed for a defined number of bars. This prevents traders from entering low-probability trades during indecisive market phases, improving overall signal quality.
Example: After a bullish confluence signal, the cooldown period prevents a bearish signal from being triggered prematurely if the market enters a temporary retracement.
4. Use Cases Across Trading Styles
This indicator caters to various trading styles, each benefiting from the confluence of timeframes and technical elements:
• Intraday Trading:
• Use a 1-hour chart as the higher timeframe and a 5-minute chart as the lower timeframe.
• Benefit: Align intraday entries with the hourly trend for higher win rates.
• Swing Trading:
• Use a daily chart as the higher timeframe and a 1-hour chart as the lower timeframe.
• Benefit: Capture multi-day moves while avoiding counter-trend entries.
• Scalping:
• Use a 30-minute chart as the higher timeframe and a 1-minute chart as the lower timeframe.
• Benefit: Enhance scalping efficiency by ensuring short-term trades align with broader intraday trends.
• Position Trading:
• Use a weekly chart as the higher timeframe and a daily chart as the lower timeframe.
• Benefit: Time long-term entries more precisely, maximizing profit potential.
5. Robustness Through Customization
The indicator allows traders to customize:
• Timeframes for higher and lower analysis.
• EMA lengths for trend filtering.
• RSI settings for momentum confirmation.
• Cooldown periods to adapt to market volatility.
This flexibility ensures that the indicator can be tailored to suit individual trading preferences, market conditions, and asset classes, making it a comprehensive tool for any trading strategy.
Why This Mashup Stands Out
The Multi-Timeframe Confluence Indicator is more than a sum of its parts. It leverages:
• EMA’s ability to identify trends, combined with RSI’s insight into momentum, ensuring each signal is well-supported.
• A multi-timeframe perspective that incorporates both macro and micro trends, filtering out noise and improving reliability.
• A cooldown mechanism that prevents overtrading, a common pitfall for traders in volatile markets.
This integration results in a powerful, adaptable indicator that provides actionable, high-confidence signals, reducing uncertainty and enhancing trading performance across all styles.

Dynamic Market Structure DetectorTitle: Dynamic Market Structure Detector – Real-Time BoS & ChoCH Signals
Short Description:
Identify market structure dynamically with real-time Break of Structure (BoS) and Change of Character (ChoCH) signals. Highlight untested support and resistance zones to improve trading precision.
Full Description:
The Dynamic Market Structure Detector is a powerful TradingView indicator designed for traders who want to automate the identification of key market structure levels. This indicator simplifies market analysis by dynamically tracking swing highs and lows, marking critical Break of Structure (BoS) and Change of Character (ChoCH) points, and highlighting untested support and resistance zones.
Key Features:
1. Real-Time Signals:
• Marks Break of Structure (BoS) and Change of Character (ChoCH) points as they occur.
• Automatically updates as the market evolves.
2. Dynamic Swing Highs and Lows:
• Tracks swing highs and lows based on user-defined sensitivity (Swing Length).
• Adjust swing length to tailor signals for intraday or swing trading.
3. Untested Zones Highlight:
• Visualize untested support and resistance zones dynamically.
• Opacity settings allow customization for better chart readability.
4. Customizable Inputs:
• Swing Length:
Adjust the sensitivity of BoS and ChoCH signals.
• Smaller Swing Length values (e.g., 3–5): Capture short-term market movements, ideal for intraday trading.
• Larger Swing Length values (e.g., 10–20): Focus on significant market structure changes for swing or positional trading.
Experiment with these values to find the best fit for your trading style.
• Untested Zone Opacity:
Control the visibility of highlighted support and resistance zones.
• Lower opacity values (e.g., 10–50): Make the zones more prominent, helpful for darker chart backgrounds.
• Higher opacity values (e.g., 70–90): Provide subtle highlights, better suited for lighter chart setups.
• A value of 100% renders the zones completely transparent (invisible).
Use this setting to customize the visual appearance of your chart while still retaining key zone information.
5. User-Friendly Visualization:
• Color-coded labels for BoS (Green) and ChoCH (Red).
• Highlight zones for untested areas using customizable colors (Support: Blue, Resistance: Orange).
Why Use This Indicator?
• Simplifies market structure analysis by automating key calculations.
• Helps traders identify potential trend reversals and continuation points.
• Reduces the need for manual charting, saving time and effort.
• Provides visual clarity on untested zones for better decision-making.
Recommended Usage:
• Intraday Traders: Use smaller Swing Length values (e.g., 3–5) to capture short-term market movements.
• Swing Traders: Opt for higher Swing Length values (e.g., 10–20) to focus on larger market structure changes.
• Monitor untested zones for potential price reactions, enhancing your trade entries and exits.
Notes :
This indicator is best suited for traders who prefer price action trading and market structure analysis. While the indicator provides reliable insights, it is recommended to use it in conjunction with other analysis tools for a holistic trading approach.
Credits:
Developed by TradeTech Analysis to empower traders with automated tools for smarter trading decisions.

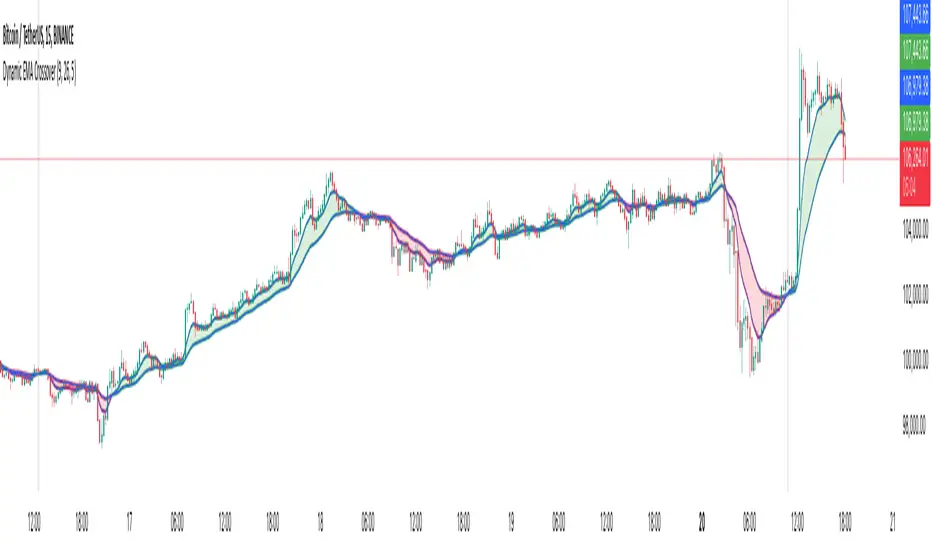
Dynamic EMA CrossoverThe Dynamic EMA Crossover indicator is designed to help traders identify trend transitions, visually understand market direction, and detect sideways consolidation zones. It simplifies decision-making by dynamically changing colors and highlighting areas of interest.
Key Features:
1. Dynamic EMA Crossovers:
• Uses two EMAs (default: 9 and 26 ) to identify bullish and bearish trends.
• EMAs and the area between them turn green during bullish trends and red during bearish trends for easy visualization.
2. Sideways Market Detection:
• Automatically detects periods of market consolidation when EMAs overlap for 10 consecutive candles and the price movement remains narrow.
• Sideways zones are highlighted with grey background, helping traders avoid false breakouts and trendless markets.
3. Customizable Inputs:
• Adjust the lengths of the two EMAs and the sensitivity of the overlap detection to match your trading style and market conditions.
How It Works:
• Trend Identification:
• When the shorter EMA crosses above the longer EMA, a bullish trend is indicated.
• When the shorter EMA crosses below the longer EMA, a bearish trend is indicated.
• The indicator dynamically adjusts the colors of the EMAs and fills the area between them for clear trend visibility.
• Sideways Market Detection:
• When the shorter EMA and longer EMA stay close (within a customizable sensitivity) for a fixed period (hardcoded to 10 candles), the indicator identifies a sideways market.
• This feature helps traders avoid entering trades during choppy or indecisive market conditions.
Who Is This For?
This indicator is ideal for:
• Trend traders looking for clear signals of trend direction.
• Swing traders who want to avoid trading in sideways markets.
• Scalpers who need quick and reliable visual cues for short-term market behavior.
Use Cases:
1. Bullish/Bearish Trends:
• Enter trades in the direction of the trend as the crossover occurs and colors change.
2. Sideways Zones:
• Avoid trades during periods of consolidation and wait for a clear breakout.
Mashup Logic:
This indicator combines:
1. EMA Crossovers:
• A tried-and-tested method for trend detection using two moving averages.
• Dynamic visual cues for bullish and bearish market phases.
2. Sideways Market Detection:
• Innovative logic to highlight sideways zones based on EMA overlap and price range analysis.
• Helps reduce noise and avoid trading during trendless periods.
3. Customization and Flexibility:
• Fully adjustable EMA lengths and overlap sensitivity to adapt to different markets and trading styles.