Uber VQ (Lite) - Volatility Quality Index [UTS]Name: Uber VQI (Lite) - Volatility Quality Index
Created: 2022/11/22
Copyright: © UberTradingSystems
Description:
The volatility quality index was first introduced by Thomas Stridsman in Technical Analysis of Stocks and Commodities magazine in the August 2002 edition.
This powerful indicator points out the difference between bad and good volatility in order to identify better trade opportunities in the market.
It is suggested to use this indicator as a confirmation signal together with the other indicators in your system.
Lite Version
Please note that this "Lite" version offers full functionality but is constrained to Euro / US-Dollar trading pairs only.
You can find it as "EURUSD" on many providers such as FXCM, Oanda, Capital.com, Currency.com etc.
If you like this indicator, consider checking out the original. More details under "Author's instructions" and "Signature" sections below.
General Usage
Stridsman suggested buying (or "to go long") when VQ has increased in the previous 10 bars and selling (or "to go short") when it has decreased in the previous 10 bars.
This indicator has been updated to reflect its modern iterations. One of the following signals are choosable trading signal generator:
VQ Sum
Short MA
Long MA
All three signal triggering conditions can selectively be drawn on the indicator for study and reference purposes.
In addition, generated buy and sell signals can be drawn on the indicator and are modifiable too.
Alerts
To allow alert notifications, generated signals are connected as selectable "Long Signal" and "Short Signal" to the indicator alerts.
The conditions can be found on the alert sections of the indicator.
In the menu right to the indicator name, press the three dots and select "Add alert on ...".
Under condition options select one of the following:
Long Signal
Short Signal
It is advised to select "Once per bar close" as alert execution option.
Moving Averages
To fine-tune the "Short MA" and "Long MA" calculation, 16 different Moving Averages are available to choose from:
ALMA (Arnaud Legoux Moving Average)
DEMA (Double Exponential Moving Average)
EMA (Exponential Moving Average)
FRAMA (Fractal Adaptive Moving Average)
HMA (Hull Moving Average)
JURIK (Jurik Moving Average)
KAMA (Kaufman Adaptive Moving Average)
Kijun (Kijun-sen / Tenkan-sen of Ichimoku)
LSMA (Least Square Moving Average)
RMA (Running Moving Average)
SMA (Simple Moving Average)
SuperSmoothed (Super Smoothed Moving Average)
TEMA (Triple Exponential Moving Average)
VWMA (Volume Weighted Moving Average)
WMA (Weighted Moving Average)
ZLEMA (Zero Lag Moving Average)
A freely determinable length allows for sensitivity adjustments that fit your own requirements.
Thomas
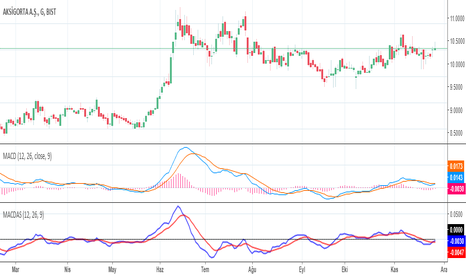
MACDASTHOMAS ASPRAY'S MACD by KIVANC @fr3762 on twitter
drive.google.com
This indicator is simply based on MACD HISTOGRAM'S 9 period EMA signal line
MACDAS = MACD HISTOGRAM= MACD - SIGNAL LINE of MACD
MACDAS SIGNAL LINE = 9 Period EMA of MACD
Note: Macd is originally calculated by using SMA but in this version both MACD and MACDAS and their signal lines are calculated by using EMA.
MACDAS provides earlier BUY / SELL signals than MACD.
TURKISH EXPLANATION:
Thomas Aspray'in bulduğu KIVANC @fr3762 tarafından yazılan versiyon
MACDnin Triggerı ile farkı (Histogram) ile bu farkın 9 günlük üssel hareketli ortalaması alınarak hesaplanmıştır
drive.google.com
Macd indikatörüne göre daha erken AL / SAT sinyalleri üretmektedir.
Kazançlı günlerde kullanmanız dileğiyle...
KıvanÇ

