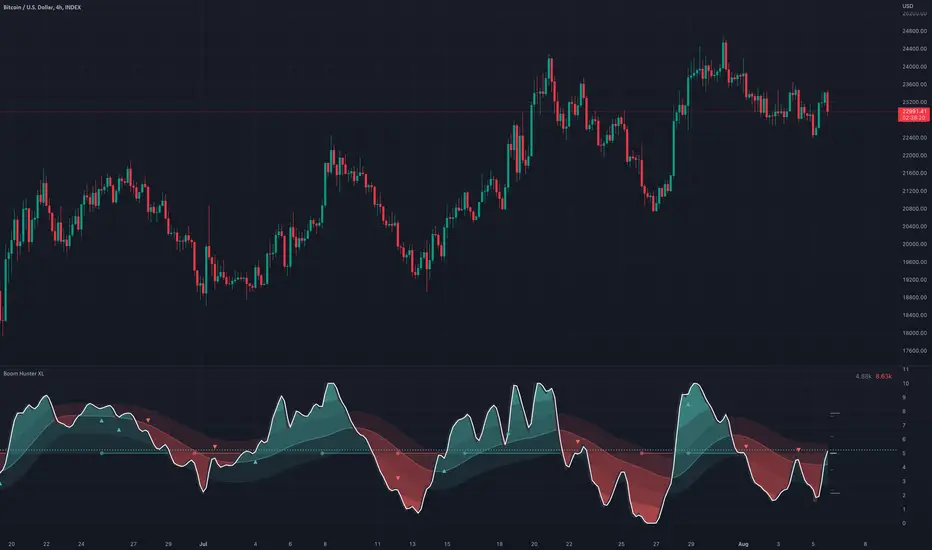
Boom Hunter XLBoom Hunter XL is a professional trading tool designed to expose perfect entries and incredible exits. This complete ground up rebuild of Boom Hunter Pro is an absolute essential for any professional trader or anyone serious about trading. Boom Hunter XL includes many upgrades to the Pro version such as volume pressure analysis, improved pressure dots, two new support and resistance lines and volume breakout detection. It also has options to display current volume and average volume it the top right corner.
A new and improved Volume Pressure Analysis exclusive to Boom Hunter XL can be turned on or off in the settings. This provides relative volume information highlighting anomalies and key movements. It also shows volume pressure. Sometimes when crossing a support or resistance line it takes a lot of volume to move price just a little. When price action crosses or bounces off a SR line it requires very little volume to move the price a lot. What this means is traders can visually see price action getting pulled in or pushed away from a SR line. The current bar shows live directional pressure. Volume pressure is used to confirm entries and continuations.
Red wave is the main support resistance line dictating short term trend direction. Enter trades after the oscillator crosses through or even better with pressure dots or volume pressure. If the oscillator is above the red wave it is an up trend and if it is below its a down trend.
The gray wave shows medium term support/resistance and general trend. This line is much harder to cross. Price action can easily bounce within this wave or get rejected.
The strongest SR lines are the top and bottom gray lines. The resistance line will bottom out under pressure and expose a low point. Likewise the support line will roof and expose a high point.
When there is extreme pressure the gray line will drag. This signal suggests that price action will will pullback and retest and push again. Avoid entering trades in these moments as the true bottom/top has not been exposed. Following price action along longer timeframe charts will help find the true low/high.
Tracking traditional patterns makes it easy to find the next breakout and direction.
Bear patterns
Bull patterns
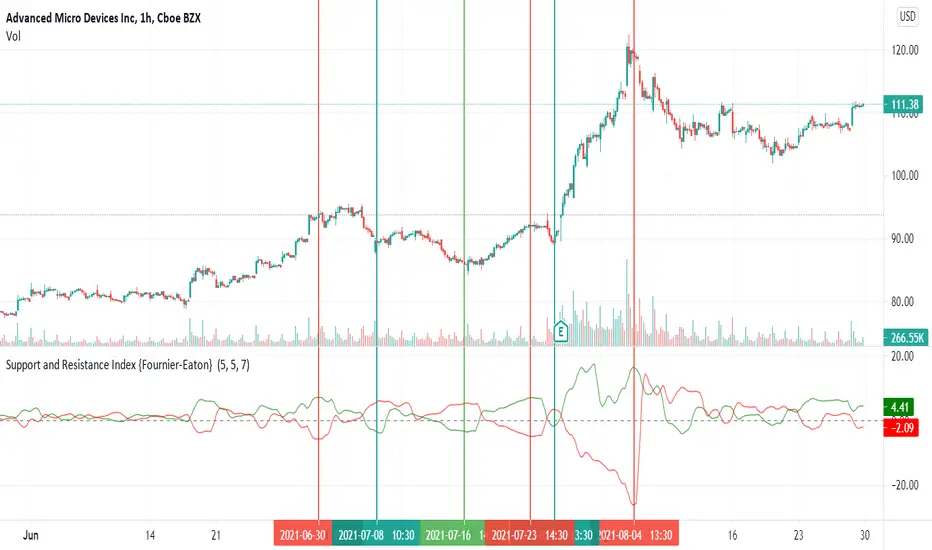
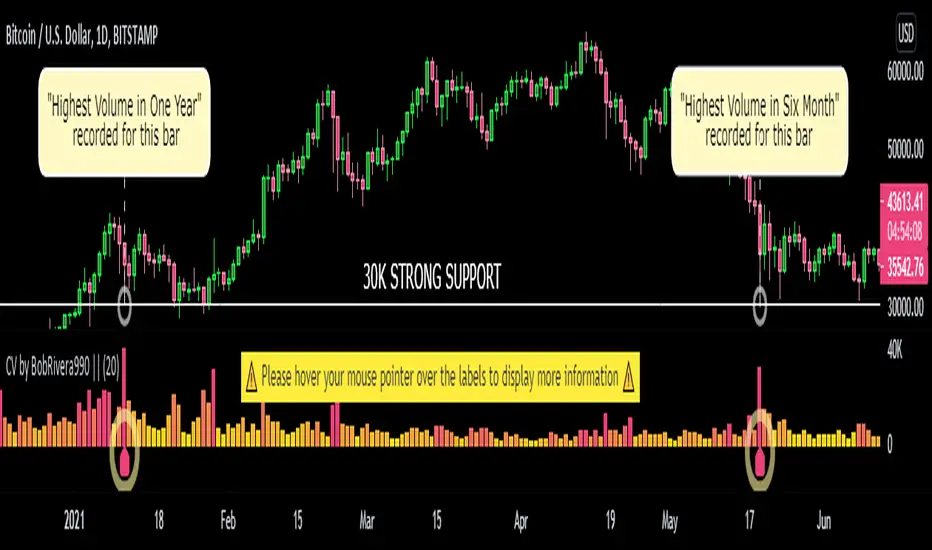
Volume breakouts
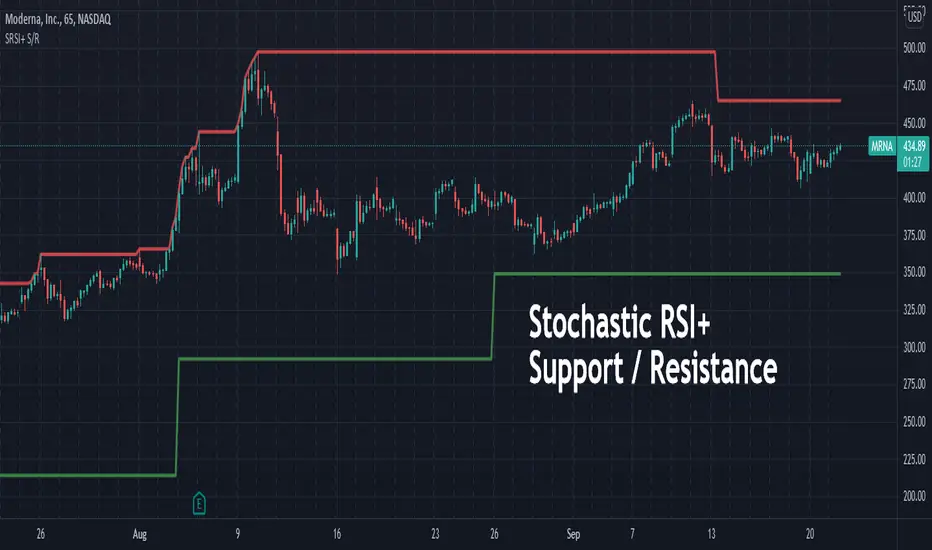
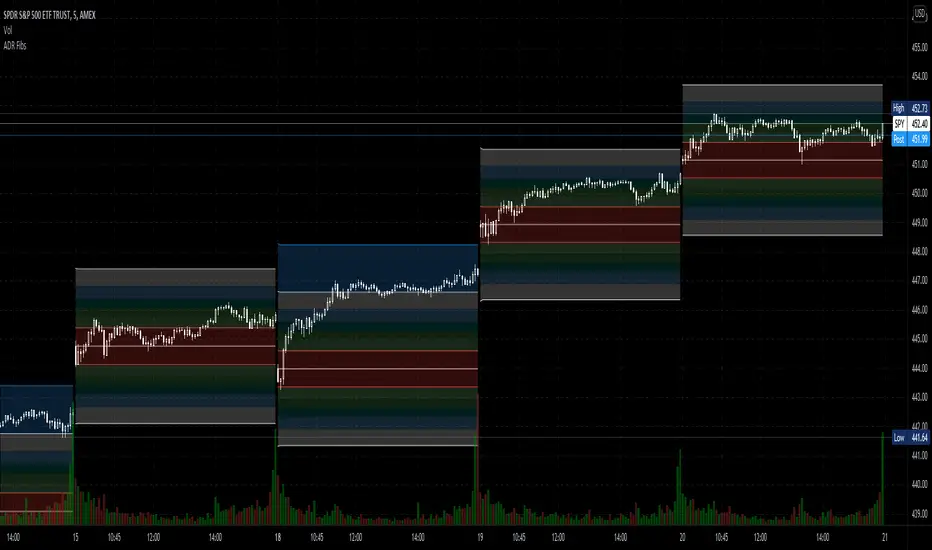
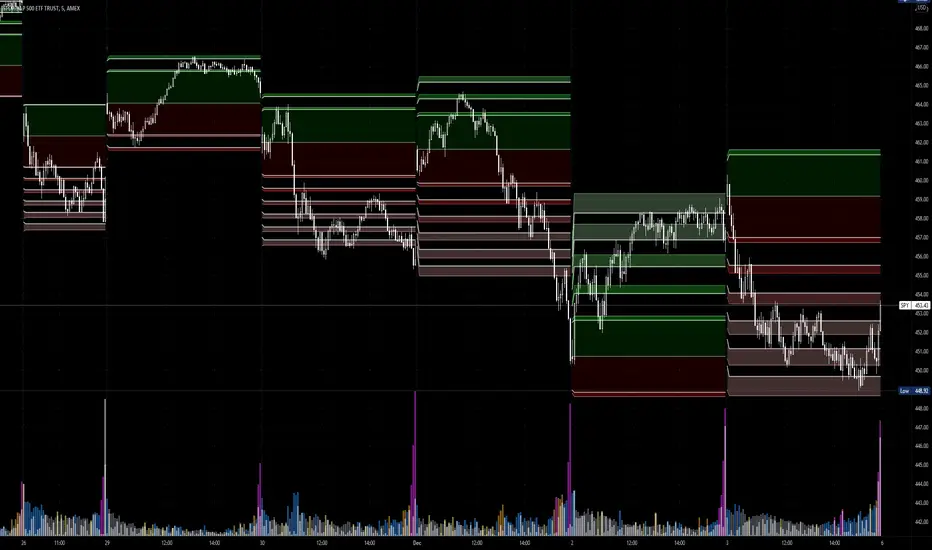
Drawing support and resistance lines
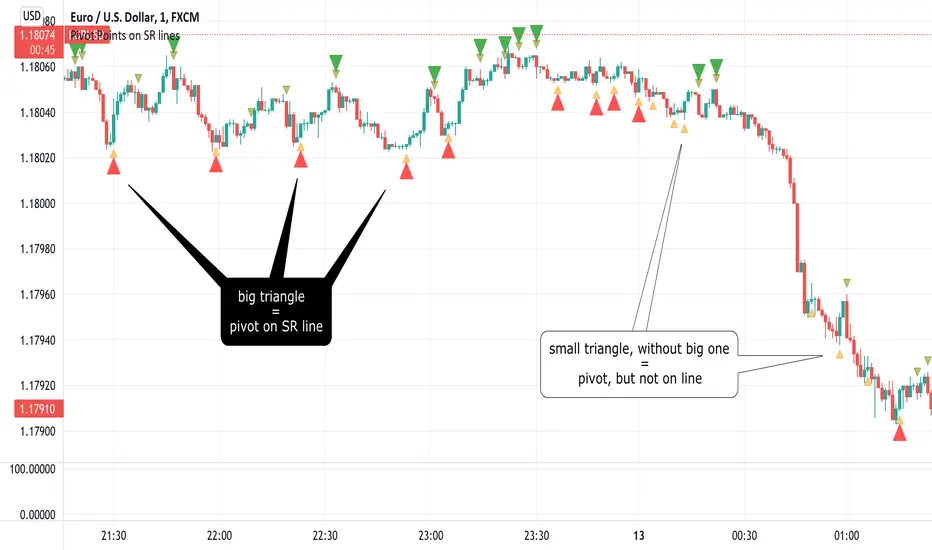
Example of some of the signals:
Indikator Pine Script®