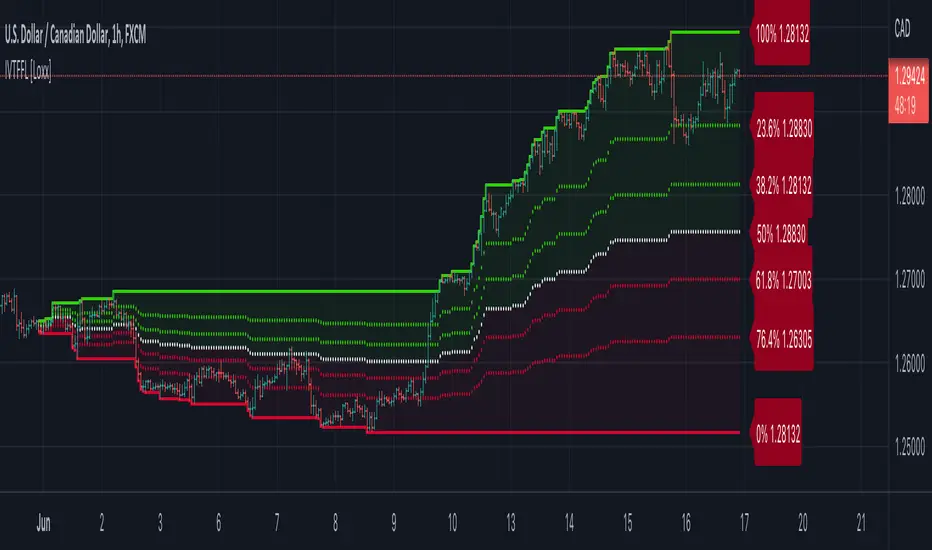
This script supports my previous post Empirical Suite It automatically plots Support and Resistance levels on the chart during periods of volatility squeeze. You have three plotting methods: From High to Low From Open to Close Linear Regression (experimental) The levels are color-coded: Red: weak, one-sided volatility squeeze Orange: typically strong,...
This is an experimental script that runs off of the IB The IB can give directional bias towards the trend and give S/R levels. I wanted something relevant to IB but for more frequent intraday trading, so this indicator runs on a 15 minute opening range of each trading day, establishing the IB, but where as the highs are set to 4H sessions, while the lows...
Version 1.0 of our TMA Bands is a visual of areas of interest. The purpose of this indicator is to determine where the price will likely bounce or reject. When an asset is ranging, it very well respects the neutral (middle) zone. The highest RR trade setups are when the price goes from one end of the bands to another. The bands included are of an ATR multiplier...
This script will show the "Fibonacci" Close levels for 9 inputs. Currently set from 8, 13, 21, ..., 377. These lines can then be used for Support and Resistances. Source and Inputs are adjustable.
This is part 11 of 11 in the system named Ninetales/Volt V2 you can find on Tradingview. It will plot local support and resistance in red and green, then override them with blue when they are active as support, and orange when they are active as resistance. It's just getting swing highs and plotting for the actual support/resists, the blue and orange come into...
Freedom of Movement Indicator --------------------------------------------------------- In “Evidence-Based Support & Resistance” article, author Melvin Dickover introduces two new indicators to help traders note support and resistance areas by identifying supply and demand pools. Here you can find the support-resistance technical indicator called "Freedom of...
Change your candle view to line or bar. This script uses the most common strategies for the following indicators. : RSI , Moving Averages, Stochastic , ADX , MACD , VWMA , Support and Resistance , Bollinger Bands , Ichimoku Cloud , Parabolic SAR , and Commodity Channel. It compares the default values defined by the user to the other values which are specified,...
This script can show mtf-clusters from higher time frames. Tenkan-sen, Kijun-sen, Senko-span A and Senko-span B are displayed in the current time frame from higher time frames (the range is from 1 minute to the monthly time frame). Sometimes these levels form clusters that act as strong levels of support and resistance.
It is a simple indicator, you can use it with all time frames. So the pink line present the last high potential area that price try to breakout , and to use it you must consider three main things : 1- price on your time frame above Ichimoku cloud. 2- RSI above 50. 3- MACD crossover. how to execute your order? when price break the pink line and close 1 minute candle .
This indicator is a huge upgrade to my original MTF MESA Plots are now extremely smooth and accurate on all timeframes ** Missing data points are automatically filled with the "best fit" This is a Trend indicator and should be used to trade "top-down" aka: Start with the Daily chart to confirm a trend Move to 4H 2H Etc... Use your favorite entry...
Hi Here is the 2ed edition of the AMA indicator. what you would know to know? AMA indicator based on support and resistance in a different way. Basically, you have the X line (black color) and when you see candles is over it, then you can go long, and when it's below it you may go short or just close your deal and wait for a better chance to re-enter...
This study tries to highlight support and resistances as they are defined by TradingLatino TradingView user His definition is based on volume peaks on the official TradingView Volume Profile indicator that seem rather big on size. As a bonus it also serves as a rather simple volume profile indicator. As you can see it only show last blocks volume profile. It's...
Hello everyone, today I'd like to share a script, which enables you to use external logic to plot levels on your chart. How does it work? The concept is based on two scripts. One script, which uses an external input as a trigger to print a new level and one script that calculates an output, which will be fetched. Sounds complicated? It really is not! Let's...
Based on resistance/support and bollinger band fluctuations this indicator also has filter with x bars after RSI overbought/oversell zones from settings. Indicator has alerts for LONG(BUY)/SHORT(SELL) signals with green/red squares/triangles. You can setup alerts to use different types of entries. There are two types of entries and signals: early (usually before...
This is a very powerful indicator and I'm really happy to show you how it works. It shows Higher Highs(HH),Higher Lows(HL),Lower Highs(LH),and Lower Lows (LL), the supports and the resistance. Lets start with the HH, HL, LH and LL. This points helps a lot who can not identify them yet. They help to identify up trends having HH and HL in sequence, and when the...
This script is based on the approach of filtering signals by checking higher timeframes. So basically setting higher numbers in "Strength Of Levels" option, will make the indicator check for support and/or resistance levels in timeframes higher than the current. Unfortunately, I was forced to still use inefficient built-in functions pivothigh() and pivotlow(). I...
Our Auto Adjustable Support & Resistance indicator draws support and resistance lines that can help you estimate where a ticker or financial asset can range, reach or break. The support lines are in lime color while the resistance lines are in red. The colors will automatically change depending on where the candle is. So for example, if the candle is above the...