LDO Support and Resistance with Trend LinesUnderstanding the Indicator on Your Chart
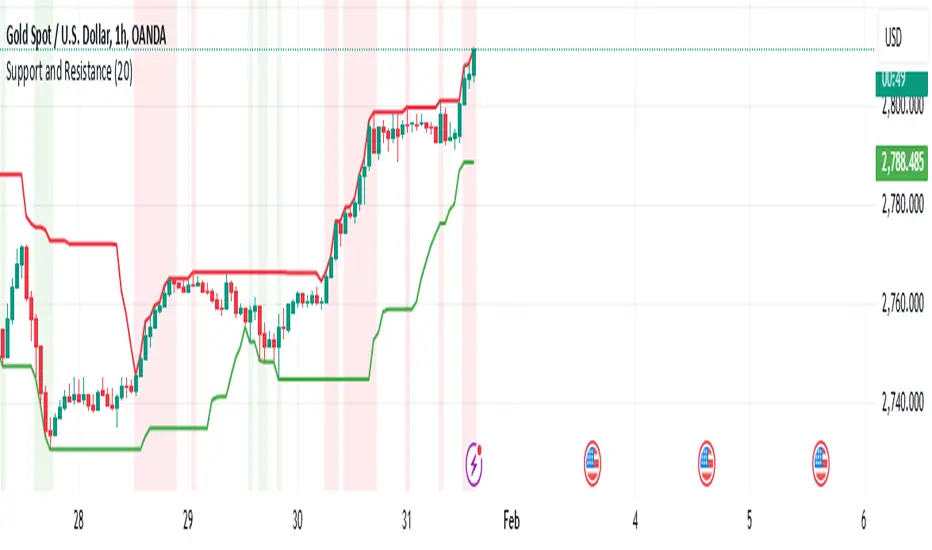
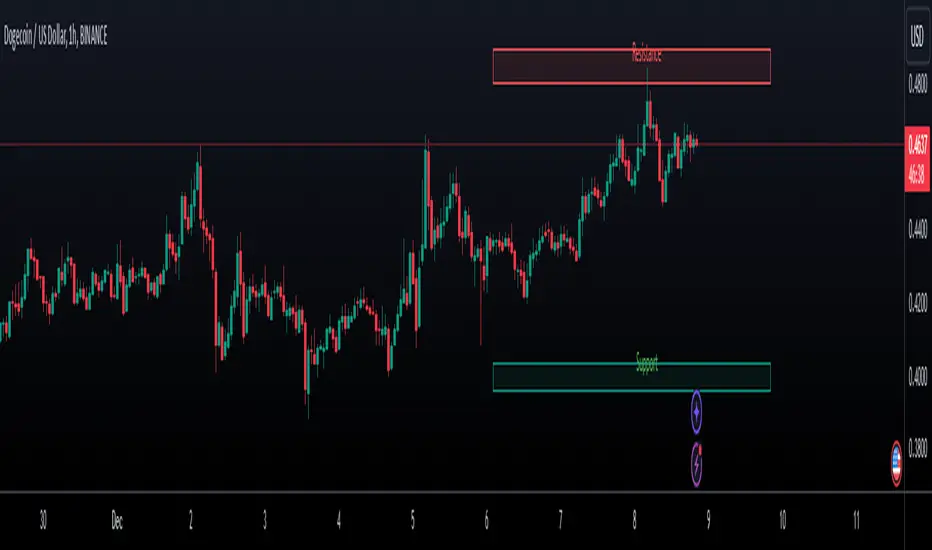
Support Lines (Green): These horizontal lines represent price levels where LDO is likely to find buying interest, preventing further declines. They turn a semi-transparent green when the price is above them and blue when below.
Resistance Lines (Blue): These horizontal lines indicate price levels where selling pressure may halt upward movements. They turn a semi-transparent blue when the price is below them and green when above.
Trend Lines (Blue for Resistance, Green for Support): Diagonal lines show the overall trend direction. Blue trend lines indicate resistance (price may struggle to rise above), and green trend lines indicate support (price may find a floor).
Pivots: Small triangles appear above or below candles to mark pivot highs (resistance) and pivot lows (support), helping you identify key turning points.
Customizing the Indicator
You can tweak the indicator’s behavior through the settings panel. Here’s what each input does:
Show Trend Lines? (Default: True)
Enables or disables the display of trend lines on the chart. Set to false to hide trend lines if you only want support/resistance levels.
Choose Higher Time Frame
Select a higher timeframe (e.g., 1H, 4H, 1D) to display support and resistance levels from that timeframe on your current chart (e.g., 5M or 15M).
Pivot Length Settings (Current and Higher Timeframe):
Pivot Length Left Hand Side (Current/HTF): Adjusts how many bars to the left the indicator looks to identify pivot lows (default: 15 for current, 20 for HTF).
Pivot Length Right Hand Side (Current/HTF): Adjusts how many bars to the right the indicator looks to identify pivot highs (default: 10 for current, 15 for HTF).
Increase these values for fewer, more significant pivots; decrease for more frequent pivots.
Pivot Sources (Trend 1 and Trend 2 Pivots):
Select the price source (e.g., low, high) for calculating pivot lows and highs. Default is low for pivot lows and high for pivot highs.
Line Width Settings:
Lower Time Frame Line Width (Default: 5): Sets the thickness of support/resistance lines on the current timeframe.
Higher Time Frame Line Width (Default: 18): Sets the thickness of support/resistance lines on the higher timeframe.
Show Support & Resistance? (Default: True)
Enables or disables the display of horizontal support and resistance lines. Set to false to hide them if you only want trend lines.
Alert Settings (Under “Alerts” Group):
Enable Trend Line Alerts? (Default: True): Turns alerts on or off for trend line hits.
Alert on Resistance Trend Lines? (Default: True): Enables alerts when the price hits resistance trend lines.
Alert on Support Trend Lines? (Default: True): Enables alerts when the price hits support trend lines.
Alert Message: Customize the alert message format (default: “Price hit trend line at {0}”, where {0} is replaced by the price).
Setting Up Alerts
Enable Alerts in the Indicator:
In the indicator settings, ensure “Enable Trend Line Alerts?” is set to true, and choose whether to alert on resistance or support trend lines.
Create a TradingView Alert:
Click the “Alerts” button (bell icon) at the top of the chart.
Select “Create Alert” and choose this indicator from the “Condition” dropdown.
Set the alert frequency (e.g., once per bar, only once), notification method (e.g., email, popup), and save the alert.
Test the Alerts:
Indikator Pine Script®