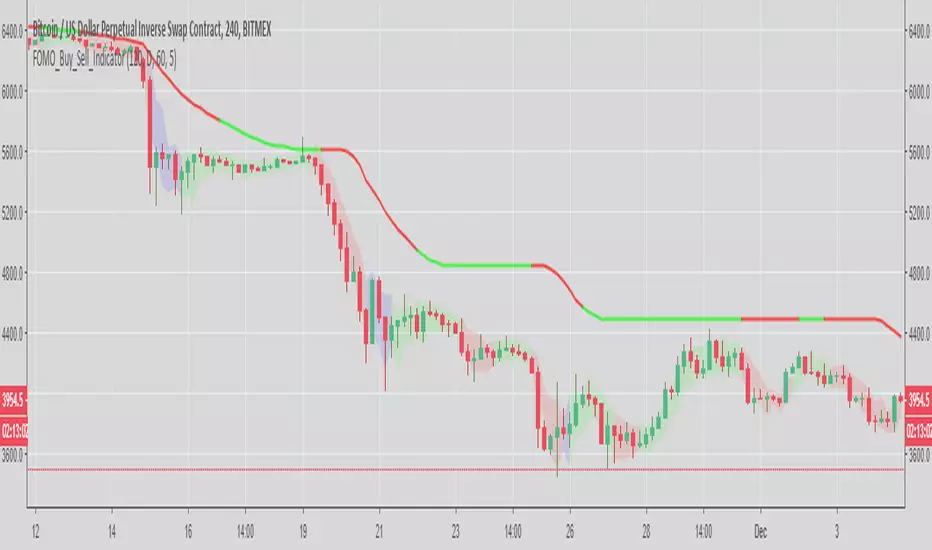
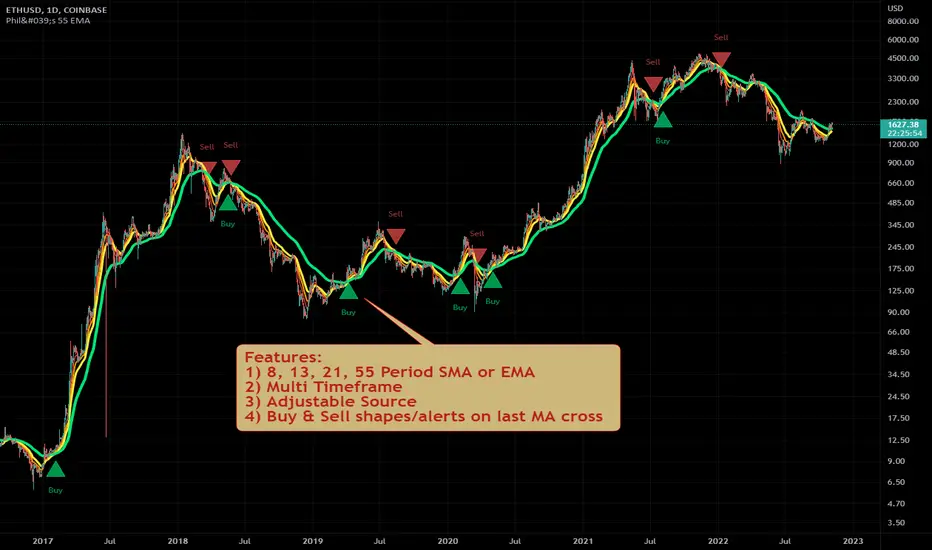
Attention: If you would to use this indicator on the ES, you should have intraday data 60min in your account. Smart money index (SMI) or smart money flow index is a technical analysis indicator demonstrating investors sentiment. The index was invented and popularized by money manager Don Hays. The indicator is based on intra-day price patterns. The main...
Percent difference between price and MA Strategy WARNING: - This script to change bars colors.
Hi Alerts for Strategy Put alerts on Bar closed
This histogram displays price or % change from previous bar. WARNING: - This script to change bars colors.
An automated strategy utilizing Autoview and Bitmex on the 5m. Use at your own risk. I take no responsibility lost currency using this. Link to strategy:
The related article is copyrighted material from Stocks & Commodities. Strategy by HPotter. WARNING: - This script to change bars colors.
This script shows a high and low period value. SelectPeriod - Day or Week or Month and etc. LookBackPeriods - Shift levels 0 - current period, 1 - previous and etc. WARNING: - This script to change bars colors
Hello All, Here is a scirpt of ChrisMoody modified with the alerts of purchases and sales. I just have a problem with automation. At the bottom of my script my alerts "Buy1" and "Sell2" give alerts constantly and I wish to have a single alert before the order is completed. Before "Sell1" or Buy2 ". I found the function "barstate.isfirst" that could possibly...
This script shows a high and low period value. Width - width of lines SelectPeriod - Day or Week or Month and etc. LookBack - Shift levels 0 - current period, 1 - previous and etc. WARNING: - This script to change bars colors.
I don't trade much with trend lines, but I was bored so made this hopefully someone will make use of it or program a strategy with it or something like that. It finds the highs and lows, works out the distance in time and price, then uses that to calculate the angle of the trend which can be used to pain the trend line. If you have any questions on how to...
The name ‘Floor-Trader Pivot,’ came from the fact that Pivot points can be calculated quickly, on the fly using price data from the previous day as an input. Although time-frames of less than a day can be used, Pivots are commonly plotted on the Daily Chart; using price data from the previous day’s trading activity. WARNING: - This script to change...
The FVE is a pure volume indicator. Unlike most of the other indicators (except OBV), price change doesn?t come into the equation for the FVE (price is not multiplied by volume), but is only used to determine whether money is flowing in or out of the stock. This is contrary to the current trend in the design of modern money flow indicators. The author...
Version 1.0 Background I'm happy to release my latest and most complex indicator, 'Omni Trader', this was programmed for but absolutely not limited to margin trading (BTC & ETH) and over the course of the indicator testing has yielded great results. Furthermore, the word omni translated to 'all' or 'of all things' which is exactly what this indicator is about,...
Automatic Fibonacci retracement entry, stop loss and extension target level as apart of a customisable strategy. Automatic plots of 23.6% 38.2%, 50%, 61.8%, 65%, 78.6% and -23.6, -61.8% and -100% levels. Customisable Fib Length - Time period over which max and min pivots are chosen. Customisable Offsetfib - Offsets the pivots and sell zone as your entry...
This is one of the techniques described by William Blau in his book "Momentum, Direction and Divergence" (1995). If you like to learn more, we advise you to read this book. His book focuses on three key aspects of trading: momentum, direction and divergence. Blau, who was an electrical engineer before becoming a trader, thoroughly examines the...
When bitcoin is in an uptrend, a very profitable strategy is to buy GBTC when premium to NAV is low, and sell when it reaches extremes. This can be far more profitable than buying bitcoin itself.