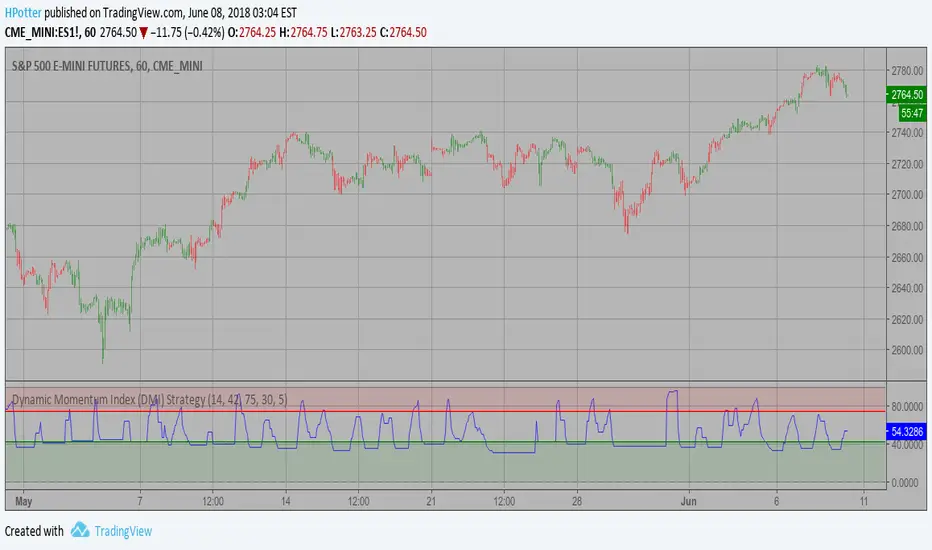
Best Oscillator for trade cryptocurrency - color bar - Very easy to use - Highest profit ------------------- eth/btc zrx/btc
Best Oscillator for trade cryptocurrency - Very easy to use - Highest profit
Best Indicator for trade cryptocurrency - Very easy to use - Highest profit
This is the only Quantitative type indicator I can find on TradingView (which means it uses automated back testing to determine probability in a mathematical way), although there could be some I just haven't seen them. This indicator back-tests ALL of the data, calculates the length of all past trends, and does a statistical analysis of trend changes at...
The Market Facilitation Index is an indicator that relates price range to volume and measures the efficency of price movement. Use the indicator to determine if the market is trending. If the Market Facilitation Index increased, then the market is facilitating trade and is more efficient, implying that the market is trending. If the Market Facilitation...
Advanced Algo made for 1 minute to 1 hour charts. However, it is effective on all time frames
Release Notes: Put the Closing price for previous candle. the price should be in the purple band. Put orders limit short in the red lines, and put long limit orders in the green lines. once the first order is fulfilled, cancel the counterparty, and only wait to take profits. ((((This strategy is intended for Bitmex, with a leverage of 10x minimum)))) The...
The Keltner Channel, a classic indicator of technical analysis developed by Chester Keltner in 1960. The indicator is a bit like Bollinger Bands and Envelopes. WARNING: - This script to change bars colors.
The RoadRunner is also a very complex Algorithm which was designed to locate ideal entries. The RoadRunner is unique because it was built with far less protection from false signals. The benefit of this is that you will get more signals overall which can allow for some excellent signals that my other algorithms would have ignored due to a higher risk component. ...
HOW TO USE Step 1 : Adjust the Trend Parameter to the most profitable number. Step 2 : Create Automatic Alerts for Buy (L) and Sell (S) signals. BONUS : Trend horizontal Line: Use this line to avoid risky trades. Get This Indicator Today! Purchase at blockchainfiesta.com SAMPLE USE CASES BTCUSD 1 D BTCUSD 4 h ETHUSD 1 D ETH/BTC 1 D...
The idea for this started here: www.tradingview.com with the user @dime This should only be used on SPX or SPY (though you could use it on other things for correlation I suppose) given that the instrument used to create this calculation is derived from the S&P 500 (thank you VIX). There's a lot of moving parts here though, so allow me to explain... First: The...
Simply input the vales of the high, low and closing price of the previous period to calculate the Woodie pivot point and the associated resistance and support levels for the present period. WARNING: - This script to change bars colors.
Making money is simple when you wield untold power -=Simplicity=- God Complex is a non-repaint, set-and-forget indicator for identifying optimum times to enter and exit the market, with both longs and shorts. Applicable to any asset-type, market, candle type and timeframe, God Complex is a quintessential tool for both new and veteran traders. With only...
The Volatility function measures the market volatility by plotting a smoothed average of the True Range. It returns an average of the TrueRange over a specific number of bars, giving higher weight to the TrueRange of the most recent bar. WARNING: - This script to change bars colors.
MBO indicator is the third component of TFS trading system. This indicator was developed by Bryan Strain and Mark Whitley. The idea of MBO is similar to moving average convergence/divergence (MACD) indicator. It is calculated by subtracting the 200-day moving average from the 25-day moving average. WARNING: - This script to change bars colors.
Script with alert condition to use with Market Sniper Strategy. Can be used to trade manually or automatically using API/AutoView Extension. Market Sniper is a multi-timeframe strategy based on trend analysis created to operate on leverage market. Code is still in beta-testing, please leave a comment if you want a free trial when final release will be available.
This study plots the TEMA1 indicator. TEMA1 ia s triple MA (Moving Average), and is calculated as 3*MA - (3*MA(MA)) + (MA(MA(MA))) WARNING: - This script to change bars colors.
Hi folks! Here a script uses the moving average cloud. A sma (50, aqua) and a sma (200, olive) are plotted on the cart. When both sma go up the cloud is green. When both sma go down the cloud is red. When sma (200, olive) goes down and sma (50, aqua) goes up the cloud is orange. When sma (200, olive) goes up and sma (50, aqua) goes down the cloud is lime. There...