My VWAP Reversal + Pivot Points StandardThis indicator, with the addition of a standard VWAP indicator to the 5m chart, helps the operator when using a closing candle Price to initiate a VWAP Reversal strategy.
The strategy involves Price gapping up, look for a Close below the 1st 5m candle Low; else look for a Close above the 1st 5m candle High. On a break of VWAP, take the trade in the opposite direction of the gap, hence the VWAP Reversal. Not my own strat, credit to T3 Newsbeat, publicly posted on YouTube.
The Pivot Points Standard in the Pine 4 user manual, was the base source code, and leaving it here will allow me to remove the PP indicator I was using.
Strategy!

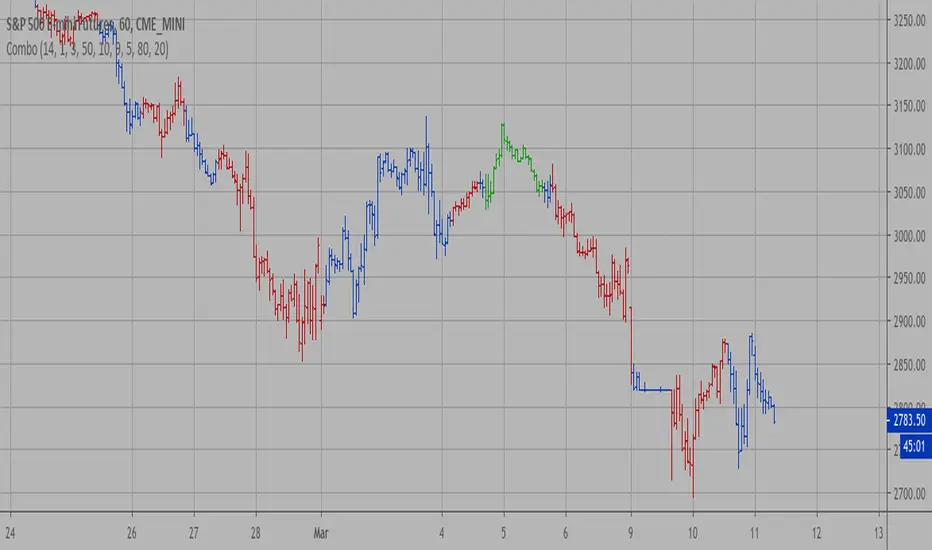
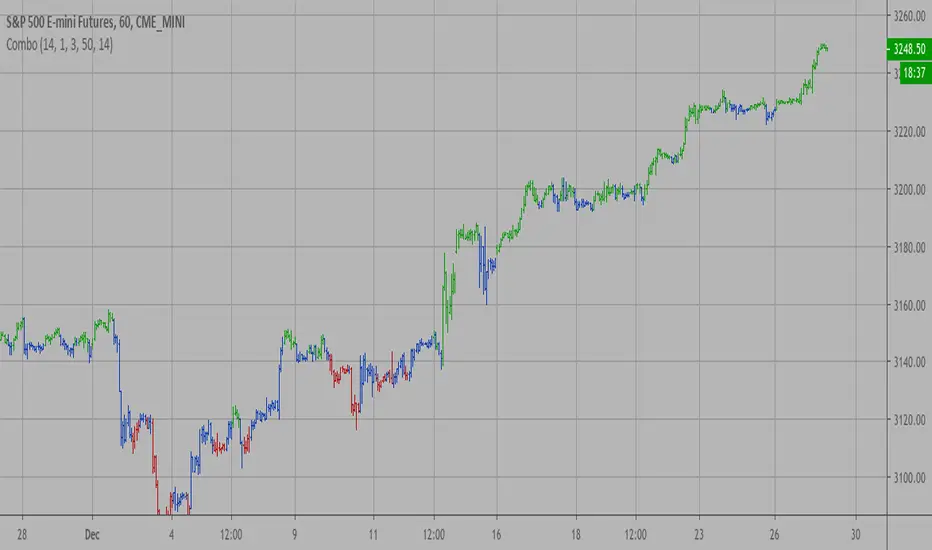
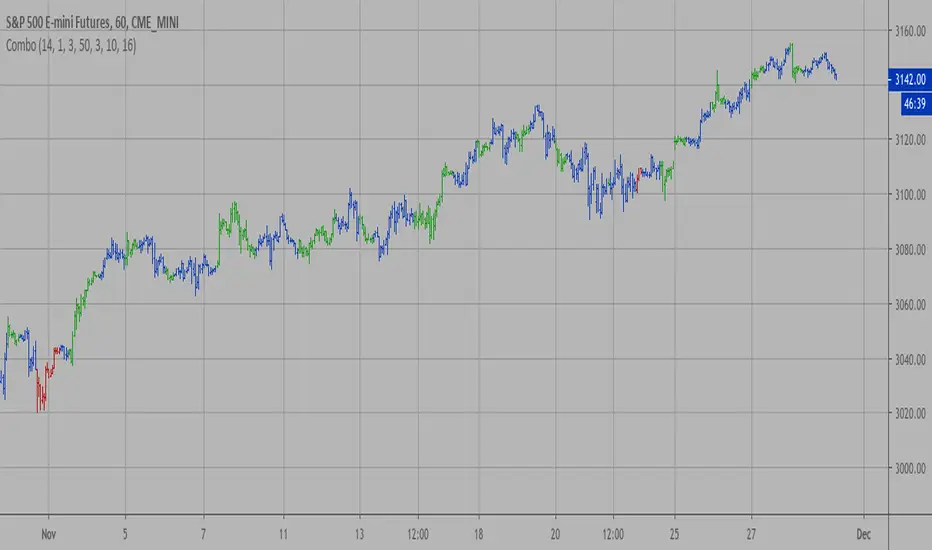
Combo Strategy 123 Reversal & Dynamic Momentum Index This is combo strategies for get a cumulative signal.
First strategy
This System was created from the Book "How I Tripled My Money In The
Futures Market" by Ulf Jensen, Page 183. This is reverse type of strategies.
The strategy buys at market, if close price is higher than the previous close
during 2 days and the meaning of 9-days Stochastic Slow Oscillator is lower than 50.
The strategy sells at market, if close price is lower than the previous close price
during 2 days and the meaning of 9-days Stochastic Fast Oscillator is higher than 50.
Second strategy
This indicator plots Dynamic Momentum Index indicator. The Dynamic Momentum
Index (DMI) was developed by Tushar Chande and Stanley Kroll. The indicator
is covered in detail in their book The New Technical Trader.
The DMI is identical to Welles Wilder`s Relative Strength Index except the
number of periods is variable rather than fixed. The variability of the time
periods used in the DMI is controlled by the recent volatility of prices.
The more volatile the prices, the more sensitive the DMI is to price changes.
In other words, the DMI will use more time periods during quiet markets, and
less during active markets. The maximum time periods the DMI can reach is 30
and the minimum is 3. This calculation method is similar to the Variable
Moving Average, also developed by Tushar Chande.
The advantage of using a variable length time period when calculating the RSI
is that it overcomes the negative effects of smoothing, which often obscure short-term moves.
The volatility index used in controlling the time periods in the DMI is based
on a calculation using a five period standard deviation and a ten period average
of the standard deviation.
WARNING:
- For purpose educate only
- This script to change bars colors.

Combo Strategy 123 Reversal & DSS Bressert This is combo strategies for get a cumulative signal.
First strategy
This System was created from the Book "How I Tripled My Money In The
Futures Market" by Ulf Jensen, Page 183. This is reverse type of strategies.
The strategy buys at market, if close price is higher than the previous close
during 2 days and the meaning of 9-days Stochastic Slow Oscillator is lower than 50.
The strategy sells at market, if close price is lower than the previous close price
during 2 days and the meaning of 9-days Stochastic Fast Oscillator is higher than 50.
Second strategy
Double Smoothed Stochastics (DSS) is designed by William Blaw.
It attempts to combine moving average methods with oscillator principles.
WARNING:
- For purpose educate only
- This script to change bars colors.
Combo Strategy 123 Reversal & Donchian Channel WidthThis is combo strategies for get a cumulative signal.
First strategy
This System was created from the Book "How I Tripled My Money In The
Futures Market" by Ulf Jensen, Page 183. This is reverse type of strategies.
The strategy buys at market, if close price is higher than the previous close
during 2 days and the meaning of 9-days Stochastic Slow Oscillator is lower than 50.
The strategy sells at market, if close price is lower than the previous close price
during 2 days and the meaning of 9-days Stochastic Fast Oscillator is higher than 50.
Second strategy
The Donchian Channel was developed by Richard Donchian and it could be compared
to the Bollinger Bands. When it comes to volatility analysis, the Donchian Channel
Width was created in the same way as the Bollinger Bandwidth technical indicator was.
As was mentioned above the Donchian Channel Width is used in technical analysis to measure
volatility. Volatility is one of the most important parameters in technical analysis.
A price trend is not just about a price change. It is also about volume traded during this
price change and volatility of a this price change. When a technical analyst focuses his/her
attention solely on price analysis by ignoring volume and volatility, he/she only sees a part
of a complete picture only. This could lead to a situation when a trader may miss something and
lose money. Lets take a look at a simple example how volatility may help a trader:
Most of the price based technical indicators are lagging indicators.
When price moves on low volatility, it takes time for a price trend to change its direction and
it could be ok to have some lag in an indicator.
When price moves on high volatility, a price trend changes its direction faster and stronger.
An indicator's lag acceptable under low volatility could be financially suicidal now - Buy/Sell signals could be generated when it is already too late.
Another use of volatility - very popular one - it is to adapt a stop loss strategy to it:
Smaller stop-loss recommended in low volatility periods. If it is not done, a stop-loss could
be generated when it is too late.
Bigger stop-loss recommended in high volatility periods. If it is not done, a stop-loss could
be triggered too often and you may miss good trades.
WARNING:
- For purpose educate only
- This script to change bars colors.

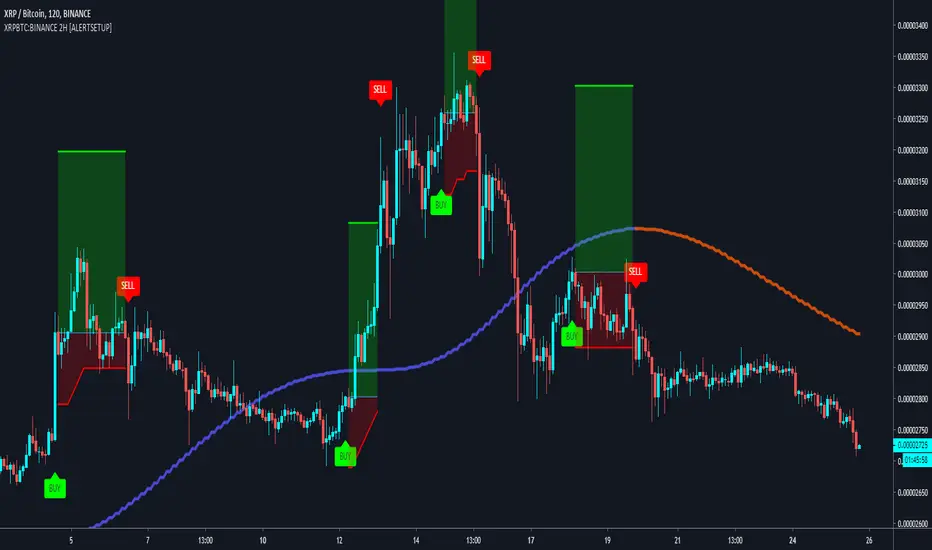
Buy & Sell XRPBTC:BINANCE 2H Trading BotBuy & Sell Alert system for BINANCE:TRXBTC
Goal is to Beat Buy & Hold on the 2H (see backtest below)
Built upon the Supertrend, ADX and Tilson T3 indicators.
A trailing Stop loss in integrated to the script, as well as a Take profit system.
To get the indicator, please use the link below, thanks!
GapGap
I've seen many trade decisions based on the CME Bitcoin Futures gap, so this indicator will let you know if that strategy is good or not, so use it as another confirmation 👍🏻.
- Shows when a gap is created, when it is filled and if not filled if a new gap is created.
- You can also use another security as a reference.
- Multi Timeframe , by default it will search the daily gaps.

Combo Strategy 123 Reversal & CMOaDisparity Index This is combo strategies for get a cumulative signal.
First strategy
This System was created from the Book "How I Tripled My Money In The
Futures Market" by Ulf Jensen, Page 183. This is reverse type of strategies.
The strategy buys at market, if close price is higher than the previous close
during 2 days and the meaning of 9-days Stochastic Slow Oscillator is lower than 50.
The strategy sells at market, if close price is lower than the previous close price
during 2 days and the meaning of 9-days Stochastic Fast Oscillator is higher than 50.
Second strategy
The related CMO Disparity Index article is copyrighted material from Stocks & Commodities Dec 2009
My strategy modification.
WARNING:
- For purpose educate only
- This script to change bars colors.
Combo Strategy 123 Reversal & DiNapoli Detrended Oscillator This is combo strategies for get a cumulative signal.
First strategy
This System was created from the Book "How I Tripled My Money In The
Futures Market" by Ulf Jensen, Page 183. This is reverse type of strategies.
The strategy buys at market, if close price is higher than the previous close
during 2 days and the meaning of 9-days Stochastic Slow Oscillator is lower than 50.
The strategy sells at market, if close price is lower than the previous close price
during 2 days and the meaning of 9-days Stochastic Fast Oscillator is higher than 50.
Second strategy
DiNapoli Detrended Oscillator Strategy
WARNING:
- For purpose educate only
- This script to change bars colors.

Best Volatility Calculator (Multi Instruments)Hello traders
A bit of context
Definition: Volatility is defined as the close of current candle - close of the previous N candle
This is an alternative version of my Best Volatility Calculator
The other version is displayed on a panel below. This one overlays on the chart using the "overlay=true" setting
This indicator shows the average volatility, of last N Periods, for the selected time frames and for 2 selected instruments.
You can select up to 2 timeframes with this version
Presented as Currency, Pip, percentage labels in a panel below.
Will calculate in real-time only for the current instrument on the chart.
The indicator is coded to not be repainting
Example
In the indicator screenshot, I used a lookback period of 1.
That compares the current candle close versus the previous one for the daily and weekly timeframe
Showing how the results look like using FOREX instruments (where using the PIPS labels make more sense than with cryptocurrency assets)
Best regards
Dave

Best Volatility CalculatorHello traders,
This indicator shows the average volatility, of last N Periods, for the selected time frames.
You can select up to 2 timeframes with this version
Volatility is defined as the close of current candle - close of the previous N candle
Presented as Currency, Pip, percentage labels in a panel below.
Will calculate in real-time only for the current instrument on the chart.
The indicator is coded to not be repainting
Example
In the indicator screenshot, I used a lookback period of 1.
That compares the current candle close versus the previous one for the daily and weekly timeframe
Showing how the results are calculated for the weekly calculations
Enjoy :)
Best regards
Dave

Price Action ChannelsHere are the brand new Price Action Channels.
As time passes and the portfolio grows not only in volume but in assets managed, I have found out that what's needed from technical analysis can't occupy so much time in decision making. Why? I hope you take into consideration other critical variables that affect the market, such as fundamentals, market sentiment, news, the world economy, and so on. Thus, I want to make obvious TA is not supposed to give you miracle formulas. In my investments, technicals count for about 33% of my decision formula.
Now about the indicator.
I'm a big fan of simplicity, and the fact is, everything is numbers and their universal rules.
So the approach we take is entirely following rules of statistics, taking into consideration the maximum amount of data to quantify and qualify moves(changes in price towards a single direction).
Once those moves are defined, we measure their average size, which is the average price range in one direction.
After that, we qualify them by using frequencies and figuring out how often each move happens, let's say:
Asset X, 10% of the times when it moves upwards it's +1%
Asset X, 14% of the times when it moves upwards it's +1,1%
Asset X, 21% of the times when it moves upwards it's +1.3%
Asset X, 25% of the times when it moves upwards it's +1.5%
Asset X, 15% of the times when it moves upwards it's +1.6%
Asset X, 10% of the times when it moves upwards it's +1,7%
Asset X, 5% of the times when it moves upwards it's +2%
With that data, we establish the size of the range and the most reasonable boundaries and thresholds.
This is meant for channels. We consider there are 3 market conditions: Channels(Trending), Sideways, Spikes(abnormal price changes).
So if you try to apply this indicator for huge movements, like news related pumps and such it won't work as it's supposed, since our approach here is to define what's "normal", and such spikes are anomalies.
Sideway assets are doable but not advisable.
We plot all the numbers in a panel, so it's easily readable while trading, and you can fully control where it appears on your screen.
The indicator counts with following features in the Panel:
Channel Sampling Size: Short-term, Mid-term, Long-term
Risk Exposure: Minimum, Low, Modest, Medium, Moderate, High, Maximum
Filtered Price Action
Trading Assist
X & Y Panel Position
Study Strong.

Adaptive Price Zone Strategy The adaptive price zone (APZ) is a volatility-based technical indicator that helps investors
identify possible market turning points, which can be especially useful in a sideways-moving
market. It was created by technical analyst Lee Leibfarth in the article “Identify the
Turning Point: Trading With An Adaptive Price Zone,” which appeared in the September 2006 issue
of the journal Technical Analysis of Stocks and Commodities.
This indicator attempts to signal significant price movements by using a set of bands based on
short-term, double-smoothed exponential moving averages that lag only slightly behind price changes.
It can help short-term investors and day traders profit in volatile markets by signaling price
reversal points, which can indicate potentially lucrative times to buy or sell. The APZ can be
implemented as part of an automated trading system and can be applied to the charts of all tradeable assets.
Green color is long.
Red color is short.
WARNING:
- For purpose educate only
- This script to change bars colors.

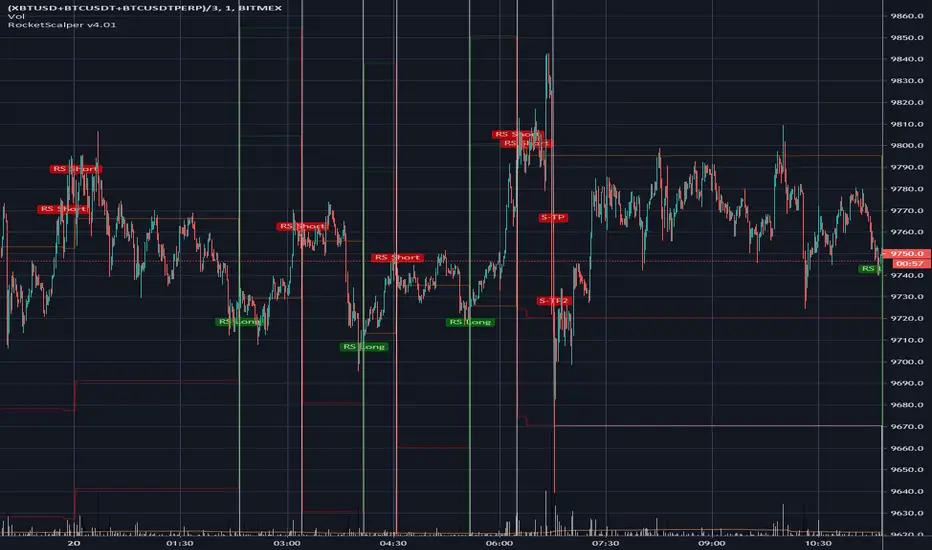
RocketScalper Long/Short IndicatorAbout the Rocketscalper Indicator
Was initially made by Rocket, PM, Hav0c, LiteralMonkey and PrimetimeBart.
It's our most used and advanced long/short indicator script so far, with over 450 users
Was first published in December 12, 2018.
It had 3 iterations, this is the 4th.
It has been continuously updated throughout the past year and as long as the market doesn't shift completely, it'll stay updated and giving good outputs.
It works by merging 3 oscillators and then checking the market balance between sells and buys to give you the final output.
Main notes about the 4th iteration:
RSI and Moving Averages back into the filtering conditions (for a while we removed it due to signal spam or trying to make a holy grail and i think we took steps back by doing that so they're back in)
Wavetrend settings closer to neutral
Loosened conditions on Godmode
Price Oscillator Changes
Added TakeProfit and StopLoss conditions editable for users
Turned the scalper more neutral with a slight long bias for the upcoming trend
Has several outputs on the chart that you can activate/deactivate
Long / Short Signals
Self Explanatory - It suggests you should long or short the asset.
Show Price Oscillator signals
It'll output long/short signals based on the Price Oscillator.
Show Stop/Support/Resistance warning
A warning label will pop-up when the trade is going against you. It's good to use as alerts, other than that, I wouldn't read much into it.
Plot Stop/Support/Resistance levels
It'll plot resistance and support horizontal lines in case you need guidance in your stops
Use background for Highlighting
It changes the background to red/green (or a color of your choosing) when its about to output a signal.
You also have, on the inputs tab, text inputs that you can edit such as:
Price Gain for Take Profit 1 and 2
Horizontal line (If you usually get at out at positive 50 points, put 50 in here and a line will plot once you get there) - Good for alerts.
Initial Stop Loss Percentage
Amount of $ Away from entry to Move SL After TP1
Trailing Stop Loss
Should I use it on all timeframes and all pairs?
You can, if you look at the historical outputs and they are good. However, I use it mostly on XBTUSD BTCUSDT ETHUSD XAUUSD and OILUS on LTF and HTF.
For altcoins, I would suggest only looking at 4h candlesticks and above.
For access, please DM us or visit the link below in our Signature.
Combo Strategy 123 Detrended Price Oscillator This is combo strategies for get a cumulative signal.
First strategy
This System was created from the Book "How I Tripled My Money In The
Futures Market" by Ulf Jensen, Page 183. This is reverse type of strategies.
The strategy buys at market, if close price is higher than the previous close
during 2 days and the meaning of 9-days Stochastic Slow Oscillator is lower than 50.
The strategy sells at market, if close price is lower than the previous close price
during 2 days and the meaning of 9-days Stochastic Fast Oscillator is higher than 50.
Second strategy
The Detrend Price Osc indicator is similar to a moving average,
in that it filters out trends in prices to more easily identify
cycles. The indicator is an attempt to define cycles in a trend
by drawing a moving average as a horizontal straight line and
placing prices along the line according to their relation to a
moving average. It provides a means of identifying underlying
cycles not apparent when the moving average is viewed within a
price chart. Cycles of a longer duration than the Length (number
of bars used to calculate the Detrend Price Osc) are effectively
filtered or removed by the oscillator.
WARNING:
- For purpose educate only
- This script to change bars colors.
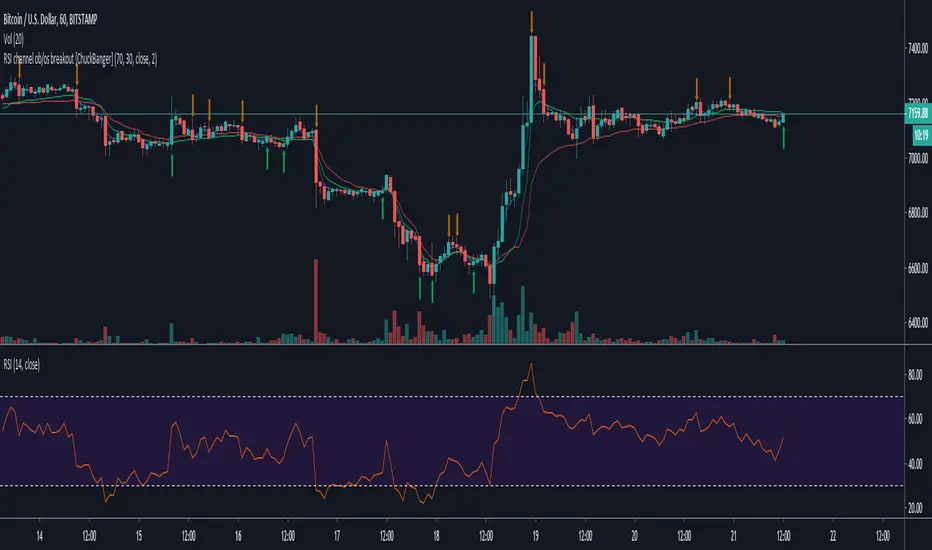
RSI channel ob/os breakout [ChuckBanger]This is a breakout signal script based on reverse engineering of RSI. It shows a channel of overbought and oversold readings that the trader can sett in settings. When low crosses under lower line it shows bullish signal and when high is crossing upper line it shows a bearish signal. The script also has wilder's moving average as filter instead of high/low.
Good luck traders!
TradewithPuneet: Pro-PatternsThe Pro-Patterns strategy is designed to trade classic chart patterns. At present, it identifies the Ascending Triangle patterns and Weekly Inside Bars patterns and takes Long or Short entries, as the case may be.
Ascending Triangle patterns:
- The strategy identifies ascending triangle patterns ranging from 40 to 120 days.
- BUY signals are generated on the breakout of the horizontal resistance line. No SHORT signal is generated on the breakdown of the rising trend line.
- The importance is given to higher lows, instead of attempting to make a perfectly straight rising trend line. Hence, the drawing of the rising trend line is skipped.
- The strategy gives BUY signals on continuation as well as reversal patterns.
- Users can choose exit rules either on the breakdown of a certain number of days or based on ATR.
- The Ascending triangle patterns can be seen on Daily timeframes only.
Weekly Inside Bars
- The strategy identifies inside bars on weekly charts with three candles. This means, that Weekly Inside Bars pattern is said to be formed when the current week's candle is inside the previous week and the previous week's candle is inside the week prior to it.
- A BUY or SHORT signal is generated next week on breakout or breakdown of high or low of third week’s candle.
- The importance is given to a decrease in volume on second & third weeks’ candles.
- The strategy gives BUY or SHORT signals on continuation as well as reversal patterns. However, users can choose to see trading signals on continuation patterns only.
- Users can choose exit rule on breakdown or breakout of a certain number of weeks in case of BUY & SHORT signals respectively.
- The Weekly Inside Bars patterns can be seen on Weekly timeframes only.
The strategy guides you the price level at which to BUY / SHORT and EXIT. It is intended for short to medium-term traders. It is important for the security to close beyond the trigger point for the signal to remain in force.

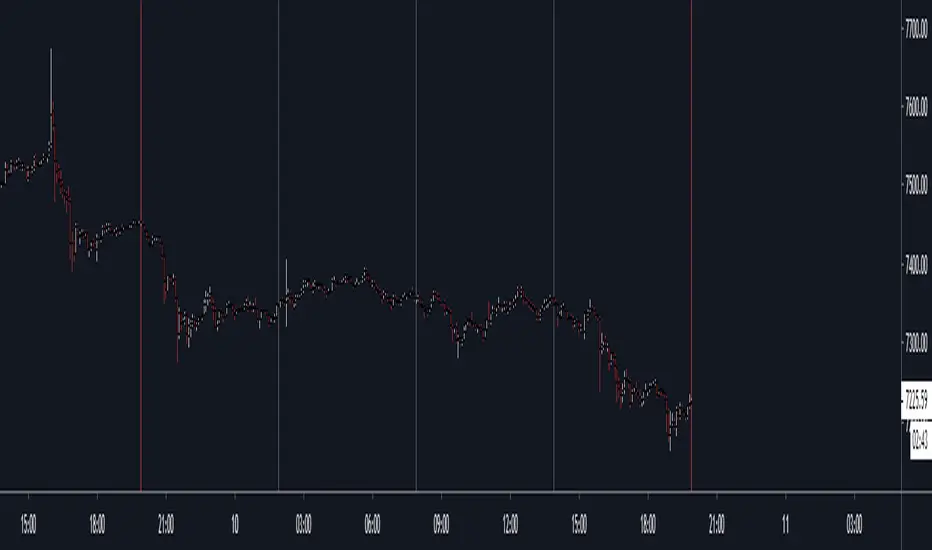
HXRO Bot Backtest Time HighlightThis script allows you to highlight the HXROBot backtest interval with the possibility of fragmenting the view to better identify the key areas of your strategy
Jurik Moving Average Crossover Strategy [ChuckBanger]The classic moving average crossover strategy does not work well in markets that, instead of trending, tend to frequently reverse within a trading range. The lag between the actual time the market has reversed direction and when the moving average is signalling a trade, the trend is already over and the market is about to go against your position. In this environment, a more appropriate trading strategy is suggested here using an JMA Keltner Channel.
The idea is to create a channel based of support and resistance. When the market breaks out of the channel, and fails to maintain momentum. It is likely the price will fall back toward the center of the channel. This tendency can be exploited in the following manner.
In the chart above, The aqua and maroon (center line) and the blue lines are part of a channel. The middle line is a slow running JMA of the closing prices, with Length = 30 and phase = 0. The upper blue band is constructed by adding 1.5 times of 30-bar ATR (average true range) to the center JMA line and the lower blue band by deducting the same amount. There is a grey line running through the data- That is a fast running JMA with length = 5 and phase = 100 representing the price.
The red dots indicate that the the price is going back in the channel and the market is retracting from a failed upward breakout, and the green dots mark when price is retracting from a failed downward breakout. These are places where one might want to enter the trade. The orange dots indicate where price crosses the center line, a reasonable place to take profit from or even exit the trade.
The center line also shows the up or down movements if the setting is ticked. This feature is useful to use when exit a trade. For example, you enter a long position on a green dot signal and the color is maroon. You can wait for 3-5 candles (depending of markets). And if the color doesn’t change it can be an indication that the price is going lower. Here it is possible to switch to a short possible or the opposite apply if you enter on a red dot.
The parameter use in this study is for demonstrating purposes only. This is to show how you can use JMA. Do not trade with real money without thoroughly test the strategy. And always use stop-losses.

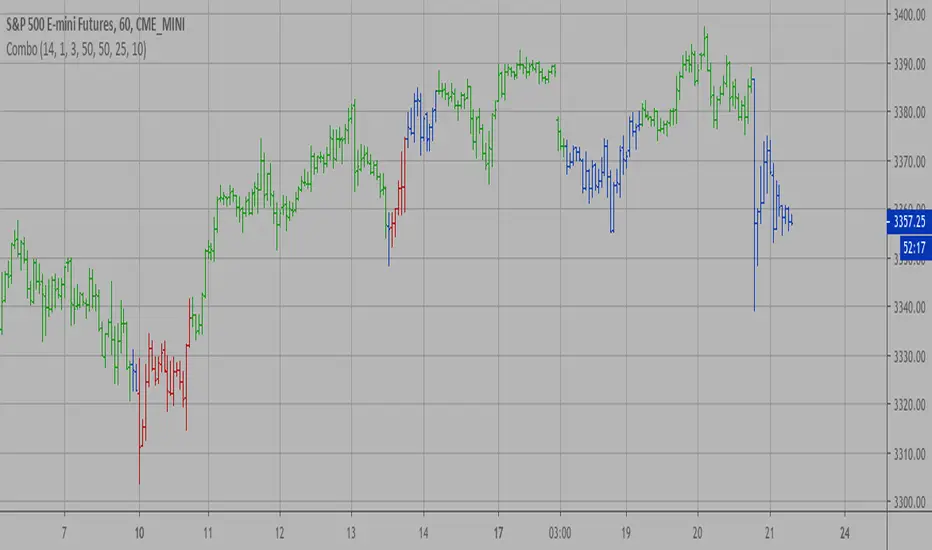
Combo Backtest 123 Reversal & D_Three Ten Osc This is combo strategies for get a cumulative signal.
First strategy
This System was created from the Book "How I Tripled My Money In The
Futures Market" by Ulf Jensen, Page 183. This is reverse type of strategies.
The strategy buys at market, if close price is higher than the previous close
during 2 days and the meaning of 9-days Stochastic Slow Oscillator is lower than 50.
The strategy sells at market, if close price is lower than the previous close price
during 2 days and the meaning of 9-days Stochastic Fast Oscillator is higher than 50.
Second strategy
TradeStation does not allow the user to make a Multi Data Chart with
a Tick Bar Chart and any other type a chart. This indicator allows the
user to plot a daily 3-10 Oscillator on a Tick Bar Chart or any intraday interval.
Walter Bressert's 3-10 Oscillator is a detrending oscillator derived
from subtracting a 10 day moving average from a 3 day moving average.
The second plot is an 16 day simple moving average of the 3-10 Oscillator.
The 16 period moving average is the slow line and the 3/10 oscillator is
the fast line.
For more information on the 3-10 Oscillator see Walter Bressert's book
"The Power of Oscillator/Cycle Combinations"
WARNING:
- For purpose educate only
- This script to change bars colors.
Altsignals-Running EquityThis is a backtested for the running equity for our Altsignals Indicator PRO+ and SLIM+.
It shows you the performance of each trade, shows you periodical equity, resets the equity after each period to 0, shows histograms after each trade.
This is an easy visual tool following Gainzys style to see how the algorithm performed previously and which settings might be the most or more profitable ones in the near future.
The source of calculation to choose a value between one and close.
Added to show LONG ONLY and SHORT ONLY Equity for LONG ONLY or SHORT ONLY strategies.
Best regards, Altsignals

Cyatophilum BITCOIN Daily IndicatorFree indicator
To get it, add it to your favorites using the button below, then you will find it on your chart in the "favorites scripts" tab
I wanted to have a tool that would quickly show me an overview of the Bitcoin chart each day, and receive alerts when something was happening, so I made this indicator.
Optimized for Bitcoin / USD on the daily timeframe, this indicator uses many technical tools such as a double Donchian channel, momentum, volume, RSI, divergences and moving averages.
HOW TO USE
Signals - You can create Automated Alerts corresponding to the graphic labels on chart.
BUY: Most bullish signal. Go long or buy bitcoin if you haven't already.
⚠️ REVERSAL: The bear trend might be over soon. Prepare some stable coins on your exchange to make sure you are ready to trade.
⚠️ RISE: Very bullish signal meaning a lot of people are buying. At this point you should just follow the sheep herd and buy.
⚠️ DROP: A drop is very likely to happen. Take your profits even though the rally can continue. Most of the time the price will drop significantly.
SELL: Most bearish signal. Go short or sell bitcoin.
Note: Use 'Once per bar close' option when creating alerts to get the exact same signals as on the chart, but only at candle close. Otherwise use 'Oncer per bar' to get them as soon as possible but the graphic-signal can disappear (unvalidated) at candle close.
Parameters
"Show 3 EMAs": Show a 50, 100 and 200 EMA. Usefull for golden/death cross.
"Channel_Length" Length in bars for the double Donchian Channel. Default is 30.
Any feedback is welcome!
To get access to my private strategies, use the link below

Combo Strategy 123 Reversal & Cueing Off Sup/Res Levels This is combo strategies for get a cumulative signal.
First strategy
This System was created from the Book "How I Tripled My Money In The
Futures Market" by Ulf Jensen, Page 183. This is reverse type of strategies.
The strategy buys at market, if close price is higher than the previous close
during 2 days and the meaning of 9-days Stochastic Slow Oscillator is lower than 50.
The strategy sells at market, if close price is lower than the previous close price
during 2 days and the meaning of 9-days Stochastic Fast Oscillator is higher than 50.
Second strategy
Cueing Off Support And Resistance Levels, by Thom Hartle
modified by HPotter for trade signals.
The related article is copyrighted material from Stocks & Commodities.
WARNING:
- For purpose educate only
- This script to change bars colors.
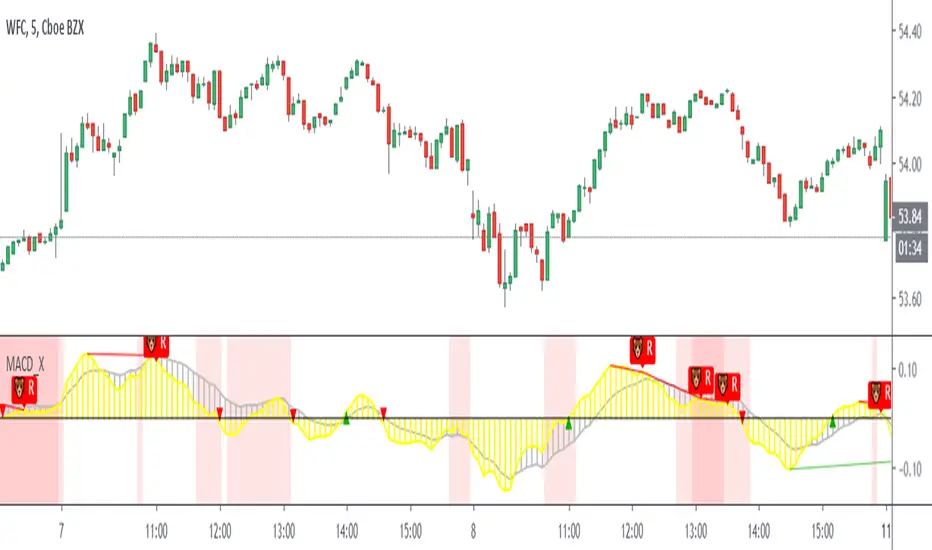
Double MACD Buy and SellIndicator for strategy that was used in a Forex competition and was a winner. Use double MACD with custom settings, search video on YouTube:
Learn Five Powerful MACD Trading Strategies
Add some tools to analyze the market context a little more:
- Detector of regular and hidden divergences.
- Atlas Zone (detects consolidation that is about to generate a movement)
- Choppines zone configurable (detects if the market is stable or not)
Visualization of entries in trend and counter-trend according to the rules described in the video.
Buy and sell alerts.
Note: I do not recommend using only this indicator as an investment strategy, it is another tool that must be complemented with a market study by the trader.