Zendog LONG DCA Trigger RSI+StochRSIThis is a script that generates a BUY signal by combining RSI and Stochastic RSI into the same script and that can easily be integrated into an external Backtester like the one I published.
The script uses default values for RSI and Stochastic RSI oversold conditions.
They should be adjusted for specific assets and timeframes so they better match the current trend. Please beware you might overfit settings to match a short timeframe trend (like a few days or hours). If this is the case once the trend changes the signals will not be accurate.
The purpose of this script is to provide some pine code that can be used to further combine multiple indicators into a LONG Deal Start signal.
Integration with the Zendog Backtster:
- add the backtester on the chart
- add this script on the chart
- in the Zendog backtester Deal start type select "External indicator"
- in the Zendog backtester Indicator source and value select "Zendog LONG DCA Trigger RSI+StochRSI: SIGNAL"
Stochastic RSI (STOCH RSI)

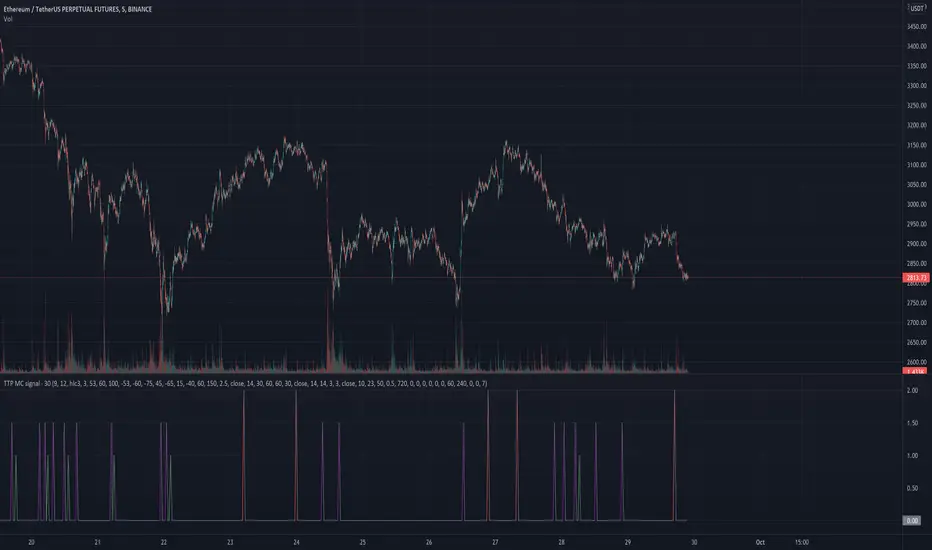
TTP MC signalThis signal is based on Market Cipher.
It triggers a 1 for a buy the divergence signal which is less frequent and more conservative.
It triggers a 1.5 for the normal signal which is more frequent and more risky.
It triggers a 2 for a sell signal which is also using a divergence.
You can use this values to backtest.
It contains alerts for each of the separated signals.
Multi timeframe Stochastic RSI Screener by noop42Here is a custom x4 timeframes Stochastic RSI screener to add on your charts.
Options
Repaint mode : if enabled: values are updated in live, if disabled: values are updated once the concerned candle is closed
Default parameters
Timeframes: 1, 5, 15, 60
Repaint mode: enabled
Notes
Use the lowest timeframe configured on the screener to get real values
A classic x3 multi-timeframe Stochastic RSI indicator is also available

MTF StochRSI indicator by noop42Here is a custom x3 timeframes Stochastic RSI indicator.
Main Features (can be disabled)
Average mode : for each timeframe, a single line corresponding to the average value between K and D is printed
Repaint mode : if enabled: values are updated in live, if disabled: values are updated once the concerned candle is closed
Default parameters
Timeframes: 1, 5, 15
Mode : Average value
Repaint mode: enabled

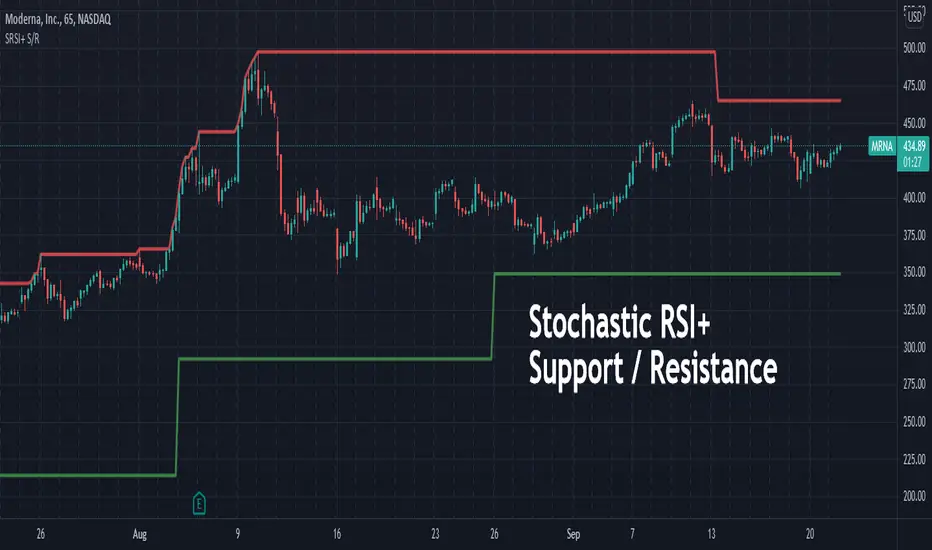
Stochastic RSI+ Support/Resistance (beta)This indicator uses Stochastic RSI+ as a means to determine overbought and oversold conditions which subsequently define recent support and resistance levels.
CashTrap Oscilator |HFX|CashTrap oscillator, this oscillator occupies the RSI oscillator and the Stochastic.
When the oscillator turns green, look for purchases.
When the oscillator turns red, look for sales.
For best results, use in conjunction with the CashTrap indicator.

Bollinger Bands + RSI Strategy by CMNisalCan be Used on Any timeframe.
Based on Bollinger Bands and RSI ( Relative Strength Index )
Used for Testing below Trade Setups on 3Commas.
Bollinger Bands
BB-20-2-LB
BB-20-1-LB
Relative Strength Index
RSI-7 <70
RSI-7 <30
Added Short Entry Switch
Added RSI Skipping Option
Price Should cross the Band and Close the candle Above/Below the band

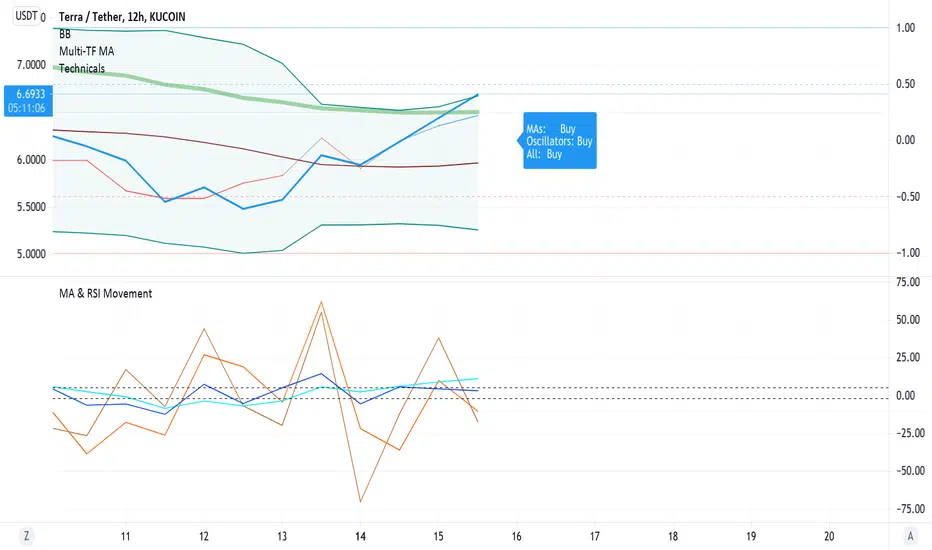
Multi-timeframe MAs + Stoch RSI SignalsHello traders,
I welcome you to my first published script on TradingView: “Multi-timeframe Moving Averages + Stochastic RSI”.
The script is based on a simple formula: Buy signals are generated when a fast moving average is above a slower moving average (uptrend) and the Stochastic RSI K line is crossing above the oversold level (entry).
Sell signals are generated when a fast moving average is below a slower moving average (downtrend) and the Stochastic RSI K line is crossing below the overbought level (entry).
This indicator works best in strong trends!
**Please note the above example has repainting turned on which may produce unrealistic results when viewing historical data. See below for more information regarding this and how you can turn it off.**
The user has the following inputs:
- Option to change the Stochastic RSI settings, including the oversold and overbought levels.
- Option to enter any value for both the Fast Moving Average and the Slow Moving Average.
- Option to change between EMA or SMA for each moving average.
- Multiple time frames to choose from, as well as the ability to selectively turn off individual time frames (both plots and alerts).
(Default time frames are 1 hour, 4 hour, and Daily. You can have a 4th time frame by changing your current time frame to something lower than the other 3 time frames)
- Turn on/off repainting: If repainting is turned on you will get an alert and buy/sell signal on chart immediately when condition is met, however the signal may disappear from chart if the condition reverses during the same candle.
If repainting is turned off, the indicator will wait for the candle to close before issuing the alert and painting the signal on chart.
For higher time frames, the indicator will wait for the candle in the higher time frame to close before issuing a signal if repaint is turned off. Default is set to Repaint on, so please be aware of this if you do not want repainting.
How to use alerts:
- Before you do anything, make sure your current time frame is the lowest time frame you’d like alerts on, as you will still receive alerts for the higher time frames you selected in settings.
- Once you have all the settings changed to how you like, save your chart first. Then right click on any of the indicator’s buy/sell signals on the chart and click “Add Alert on MAs + Stoch RSI”.
- Make sure “Any alert() function call” is selected under the Condition.
- You can delete or change the text in “Alert name” if you want as the alert message is already built into the indicator, and it will tell you in the alert message which asset and time frame to buy or sell.
Other things to note:
- The indicator will not display the buy/sell signals of lower time frames when you are on a higher time frame. This was done purposely to reduce clutter on the chart when you switch to higher time frames.
- While the alert message will tell you which time frame a signal was generated, the plots on the chart will instead show “Buy/Sell TF1, or TF2, or TF3”.
If the signal is from the current time frame that the alert was created on, then it will simply show “Buy” or “Sell”.
Hope you guys enjoy using this one, please drop a like if you found it useful. If anyone wants to modify my script in any way, please just credit me for the original work when you publish the script. Good luck!

JCipher Stochastic RSI Crossover AlertsCustom indicator to plot the stochastic RSI and print a highlighting bar to indicate when the fast signal curve crosses the slower one from underneath (crossover), to indicate a bullish trend change.
The Chartless TraderThe Chartless Trader
The chartless trader is a trade management system designed to remove the randomness from the market. It is loosely based on the martingales betting system, but takes advantage of position sizing, minimum profit targets, dollar cost averaging, and trailing take profit.
The chart can be traded with or without a signal. There is a built in signal based on SB Master Chart's Buy the Dip algorithm.
The configurable settings include:
Account Value
Starting Account Value - This is the value of the account when you start using this system.
Current Cash - This is the amount of cash you have available to trade. This setting needs to be updated each time a trade is made.
TP/TTP Algo Settings
Take Profit % - This setting is otherwise known as minimum profit target. This algo will not advise you to sell or increase your trailing stop until this minimum profit target is met.
Trailing Stop % - This is the trailing stop. The default setting is 75%. As a basic example, if the stock is up 10%, the trailing stop would be set to 7.5% (10% * 75%). The algo may override and advise an alternative trailing stop should an overbought condition be detected.
DCA/BTD Algo
DCA/BTD Algo Time Frame - Default is 120 (2hrs). This algo looks for oversold periods on the 2h chart by default.
DCA % - The default for this setting is 5%. This is a trigger for the BTD Algo. The BTD algo will start looking for trades when the stock is 5% below your cost basis. This is to help you average down making it easier to turn a profit when the stock starts making gains.
Position #
The Chartless Trader supports a maximum of 20 symbols. This is a limitation of the security() function as a maximum of 40 calls are allowed and the script calls the security() function twice per symbol.
S# QTY - The number of open positions of the symbol. This has to be manually updated by the user after each buy/sell of the stock.
S# CB - This is the cost basis of the stock. Your broker should give you this after each buy/sell and it has to be updated here on the chart after each buy/sell.
S# TTP - The script will advise you to increase your Trailing Take Profit in your broker when its necessary. This should be updated manually after you update your order in your broker. This should be configured manually in your broker as a Stop Order.
Now that I have covered the configurable options, its important to understand the basis of this system. The martingales betting system is a system that seeks to double its position size each time you enter a losing trade. Eventually when you make a winning trade, it will be enough to cover the previous losses and net you one winning position.
Bet 1, lose 1, down 1.
Bet 2, lose 2, down 3.
Bet 4, lose 4, down 7.
Bet 8, lost 8, down 15.
Bet 16, win 16, up 1.
So the theory goes, if you have deep enough pockets, its a 100% win rate. Such a system is flawed and proven to cause an account to blow up given enough time. You can search Google/YouTube for others that have back tested the martingales system with stocks.
I advise that "The Chartless Trading" system be traded with a similar system, but instead of doubling your position, you simply increase your position size by 1%.
Bet 1%, lose 1%, down 1%
Bet 1%, lose 1%, down 2%
Bet 1%, lose 1%, down 3%.
In such a manner, your risk of ruin is significantly reduced. Lets say you lose 10 times in a row betting on a stock. You now have 10% of your account value in this particular stock. Because you only invested at times where you were more than 5% down and when an oversold position occurred, because of dollar cost averaging and buying during oversold periods, you may only be down 2-3% on your invested value. Eventually when the stock turns positive, you will have met your minimum profit target and the script will alert you to set a trailing stop. You log into your broker, set a stop loss and wait for it to either trigger or inform you to increase it again. Once the trailing stop is triggered, you deleverage the position by closing it and starting a single new position in either the same stock or a different one and the cycle repeats.
The key is to follow the stock down, follow it back up, and not back down. We repeat this cycle with many positions in many stocks to minimize risk and compound our balance sheet.
This is " The Chartless Trader ".
1920x1080p Monitor Required if using all 20 symbols.
The more symbols loaded, the longer the initial processing to load the table. Please be patient.

SB Master Chart v5 (Public)SB Master Chart v5 is the latest progression of the SB Master Chart series of charts.
The original SB Master Chart and its successors was designed to be a visual aid for the savvy investor. The original concept was designed to provide valuable information so decisions could be made at a glance with utmost confidence.
As the chart progressed through versions, it has slowly shifted the responsibility of decision making from the trader to the indicator. In this version of the script, we have updated the backend decision code. The script has 3 distinct personalities coded to compliment each other, as well as keep the others in check..
The first personality is the buy algorithm. The buy personality is based on two conditions. The first algorithm first determines a trend, then it waits for a confirmation. The personality is comprised of the following indicators.
EMA 7
EMA 14
MACD
Stochastic
RSI
By default, the first personality has its visual settings disabled. Its still working, its just not displayed on the chart. It can be enabled in the settings. The background colors designate trend and confirmation.
The second personality is stubborn and its committed to making a profit. Its a hard line in the sand that configurable by you the user. Its the take profit/trailing take profit setting. It will not let other personalities sell for less than these configured values. The visual component of personality two is represented by black dots. This serves to showcase its minimum profit target when opening a trade and a trailing stop loss when the price exceeds the minimum profit target.
The third personality is the guy that does the dirty work that nobody wants to admit they do. This personality is based on the original SB Master Chart algorithm. This personality takes over when the first personality is unable to turn a profit. This personality goes to work finding appropriate places to dollar cost average. There are two settings that affect this personality.
DCA %
Risk Multiplier (use extreme caution, this could cause a margin call if used inappropriately).
DCA percent setting restricts this algorithm from buying when the price has not fallen below this threshold.
Risk Multiplier instructs this algorithm how much positions/qty to buy when it buys. At 2x, the algorithm will buy enough shares to double its current position, at 3x the algorithm will buy enough shares to triple its current position.
The visual representations of the third personality are that of red, orange, yellow and green. Red means overbought. When an orange appears just prior to a red, that orange means overbought with volume. Green means oversold and an orange preceding a green is an oversold with volume. Both the red and green represent an possible trend reversal and that's the signal to buy when its green.
This personality is comprised of the following indicators:
RSI
Stochastic
MACD
Bollinger
Volume
The code also features 3 modes. Altering the mode setting changes the way the personalities work together (or do not work together).
Normal
Aggressive
Buy the Dip
Mode Normal works exactly like described above. Each personality has its own duty and they do not interfere with each others work.
Aggressive mode adjusts the dynamic and both the first personality and the third personality share an equal part in opening starter positions.
Buy the Dip mode prevents personality one from buying. Since personality one only buys uptrends, you will never see it buying a dip. This mode puts personality 3 in the spotlight. All position are typically opened during a fast/quick market decline. Personality three is still bound by the rules of personality 2, but its responsible for buying and dollar cost averaging.
I have also included labels for every buy/sell. A green label is the script making its first purchase, yellow is points where it decided to dollar cost average and the red is where it chose to deleverage by closing out all its positions. Nothing prevents the algorithm from buying immediately after a sell, this is by design because we do not want to miss out on an uptrend, but we also do not want to be caught with too much leverage.
Also included vital statistics on the top right of the chart.
Open Positions
Cost Basis
Current Gain/Loss
Minimum Profit Target
Trailing Stop Loss
Total Trades to Date
Maximum Positions/Qty to Date
In the bottom right of the chart, I have the user configurable settings. This is important so a user can at a glance see the settings of the chart without having to open the options menu.
Together, all three personalities form a COMPLETE trading system. The system tracks purchase quantity, cost basis from the first buy, adjust with each new buy and calculates the running profit from the begining of the date set in the settings if it were to have bought and sold at every signal. The public version of the script requires the trader to use the script in real time watching for buy and sell opportunities. The private subscription version of the script has custom alerts that can be configured to alert the user on when to buy and sell and also gives the user appropriate trailing stop loss settings to automate the trading process.
I want to name the personalities at some point in time for the novelty factor, but I wanted to release the script as soon as possible for others to enjoy, so they are nameless at this point. If you have suggestions, please contact me with your suggestion. I will credit the person with the best personality with a free subscription to the private version of this indicator.
As always, understand the risks of trading and trade responsibly. Nothing in this script can predict the future. Past results do not guarantee future performance

Fractal Fire Zones/Wave RiderMulti timeframe confluence reader: This indicator plots fractals on any specific timeframe selected, multi time frame ema cross that changes color with the trend, multi timeframe 200ema and a calculation that shows potential turning points with a multi timeframe stochastic oscillator confluence. The fire zones are preferred in a ranging market or for potential scalps while the ema trend is designed to keep you with the main trend in any given session. The accumulation/distribution candles can be used to gauge pull backs for re entry or exits based on time or multiple confirmations.

Triple Stochastic RSITriple Stochastic RSI
As the name suggests, this indicator is a combination of three stochastic RSI indicators on three different time frames.
It will flash green when all three stochastics are in the lower range specified in the settings (signaling a possible bottom) and will flash red when all three stochastics are in the upper range(signaling a possible top). The bottom and top thresholds are user-configurable, as well as the timeframes for each stochastic and the standard stochastic settings.
Use this indicator on the lowest timeframe specified in the settings or you may get unexpected results.

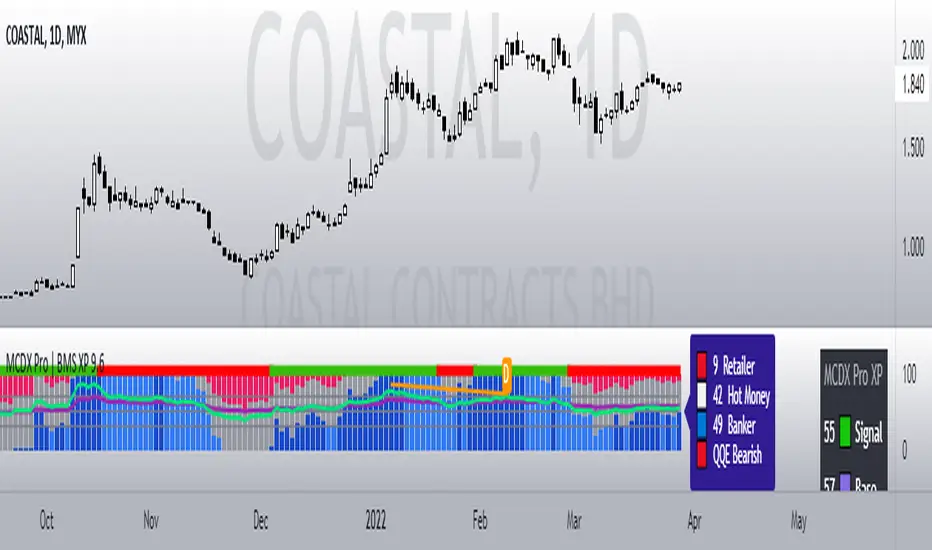
MCDX Pro+ | BMSPublished 10 June 2021
MCDX Pro+ | BMS
Bull Momentum System Pro
Use this indicators with other BMS indicators.
(Smart Power / MC Pro++ / SMI Pro+)
How to use:
This indicator detects Banker volume.
Green Bars = Retailer ( Bearish / Downtrend)
Gray Bars = Hot Money (Sideways / FIFO)
Red Bars = Banker Smart Money ( Bullish Uptrend)
Pink Bars = Weak Banker (Pullback / Unloading / Technical Rebound)
Blue line = FIFO entry
- Blue line is a fast signal to enter when there is no banker yet.
- Good for BTST / FIFO trade.
- If Blue Line is up too strong a fast pullback may happen
- Yellow line = Bearish (pullback)
- Blue line up together with Red bars means strong bullish.
Overbought / Oversold symbol:
Orange Circle = Overbought / Possible very strong bull
Blue Circle = Oversold / Possible bottom catch / Rebound
Banker levels and Rocket symbol:
Level 0% = No Banker show 0 Rocket
Level 25% = Banker step-in show 1 Rocket
Level 50% = Banker build position show 2 Rocket
Level 75% = Banker takes control show 3 Rocket
Level 100% = Banker overbought show 4 Rocket
Best entry when position is Oversold and Red Banker step-in
and build-up position more than 50% level.
Take profit when Overbought, Pink Bars (banker unloading) and
Blue line turns Yellow line.
MTF Wave Stochastic RSI [Cryptoheat]MTF Wave Stochastic RSI is a multiple time frame Stochastic RSI, based on 3 different timeframes, layered on top of each other. This is a very useful tool when used to confirm and identify Elliott Waves and sub-waves at once.
Each of the three curves is based on a different time frame. While the blue (K2) curve is the current time frame, the gray (K1) is of a faster time frame which is roughly around a third of the time and the green (K3) is of a slower time frame, roughly around 3 times the current time frame. The gray and green curves are based on specific settings that were back-tested and proved more efficient.
Reasoning behind this indicator is that although the normal Stochastic RSI can show divergences more sensitively and faster than the normal RSI indicator, it cannot do so while showing a larger duration backwards in an accurate way for comparisons. It can also not show wave structures and substructures, but rather a top or bottom reversal regardless of the wave structure hierarchy and wave strength. However when several time frames are combined in one indicator, they can reveal much more information about the chart as they can show larger durations next to smaller ones. Therefore they can be used as a confirmation and helper tool to identify Waves and Sub-waves.
This can be done, by looking first at the green curve (slowest RSI) and identifying full moves. A full move is a move from being oversold to overbought and back to being oversold again. A move can be the opposite as well. By identifying the beginning and end of a move of the larger time frame stochastic RSI this can help you see the two waves in each move. One wave up and one wave down. The peak of that wave can be seen either at the highest point of the in-between peak of the green curve or by one of the smaller time frame stochastic RSI tops when the green one is diverging. A look at the price action and application of Elliott Wave knowledge is mandatory, as this indicator is mainly a confirmation tool.
By back-testing it you can see that the larger time frame Stochastic RSI can show you full impulse and corrective waves most of the times, while the lower time frame stochastic RSI should be viewed as potential sub-waves of that main wave structure. Also noticeable are the divergences that can be seen often on the larger time frame Stochastic RSI..
Please note that this tool is not recommended to be used alone as like many indicators, this is a confirmation tool that can help in identifying rather than predicting…
Also for best results Elliot Wave knowledge is recommended…
I prefer to use this indicator along with a normal Stochastic RSI on top of it so I can always see which of the three curves is of the current time frame, making it easier to understand the chart. I also prefer using the normal RSI and MACD with it…

Barholle eMA and RSI Movement TestThis is a test that offers insight into whether and asset is heading into bullish or bearish territory.
This indicator/test offers insight into the Exponential Moving Average's velocity and acceleration as well as the Stochastic RSI's velocity, acceleration and jerk. Included is a 'Stochastic Difference' and 'Stochastic Growth' indicators (commented out) that measure the difference between K and D in the Stoch RSI as well as the rate of it's change. This test is all about crossovers - the best leading indicator is a downward cross of the eMA velocity over the eMA acceleration, indicating a drop in price in the current or next bar.
The lines or importance have been set to -2 and 5, but these should be adjusted to suit your preferences. These numbers were chosen in order to try and create some kind of threshold after which action might be suggested. Backtesting is highly recommended so you can see how the test does and does not work. It is super powerful, but it is not omniscient - its an RSI and eMA derivative, past success does not necessarily dictate future success.
Please look at the code for several more plots you can use of derivatives and other ideas explore but commented out for greater legibility of the graph. Commenting and commenting (or uncommenting all and just disabling some in the settings) and comparing the graphs and crossovers is a useful exercise. To that end, one last concept - the MARSI - a combined moving averages and RSI measurement - was abandoned because it didn't appear to indicate anything of use, however you may find crossovers or patterns with it comparing it to other graphs, so it was left in but commented.
Please take a look at the comments and all the math and indicators 'left on the cutting room floor' in the script. Maybe you'll find a gem in the redux version of this script.
Outreach regarding the script, patterns noticed and full-on stealing of the script are all permitted. Many elements of this script were nabbed from other scripts - thank you to a community of coders who put it all out there.
Stochastic RSI - DurbtradeDurbtrade Stoch RSI -
1) Stoch RSI
A) The K line can be customized to change color based on vertical direction.
B) The space between K line and D line can be filled with a color depending on whether K line is above or below the D line.
C) There are color-coded, cross-over and cross-under background fills, to signal when the K line crosses the D line.
D) K line is drawn in front of D line (D line is drawn behind K line).
E) Default values : K = 3, D = 4, RSI Length = 14, Stoch Length = 14
2) Horizontal Lines
A) Horizontal lines can be drawn automatically, so you don't have to draw them, and they don't extend past the current bar.
B) There are 11 customizable horizontal lines,
and each line is set to non-customizable increments (zero, 10, 20, 30, 40, fifty, 60, 70, 80, 90, hundred).
C) The 11 lines are divided into 2 groups:
a) 4 PAIRS of lines WITH fill options (10/90, 20/80, 30/70, 40/60... 8 lines total), and
b) 3 INDIVIDUAL lines WITHOUT fill options (zero, fifty, hundred).
D) The 4 fills give you the option to fill the space between each pair with a customizable color and opacity,
regardless of whether the lines themselves are drawn or not.
(all default values are what I feel work best for this indicator...
and initially, only the zero, fifty, and hundred lines are drawn automatically .
You may add the other lines if you choose to, by adjusting the opacity to your liking).
3) Conclusion
A) As with my previous indicators, this one maximizes information, color, discernment, clarity, and customization.
B) It is optimized for your ability to be able to easily customize the indicator according to your preferences...
for use on your own personal television, laptop, or cellular phone screen setup... and on all chart zoom levels and layouts.
C) Please feel free to comment your thoughts, critiques, or suggestions. They are all helpful!
D) Check out my previous pine script indicators if you like this one. They work really well together.
E) I hope that you find this script useful.
F) Enjoy!
//Durbtrade

Stochastic MomentumThis RSI indicator uses the difference between the K and D values in the Stochastic RSI indicator. Using the same layered lengths of 12, 24, 48 and 96 intervals that the Avg Stoch RSI indicator, this offers a rate of change momentum measurement. Crossovers are at zero, this indicator gives a clearer indicator of market momentum.

Avg Stoch-RSIThis is a Stochastic RSI measurement that averages four different RSI lengths in order to catch short length as well as longer length trends. The lengths are intentionally chosen to give you periods between 1 to 4 days on the 1hr and proportionally further back by increased period.

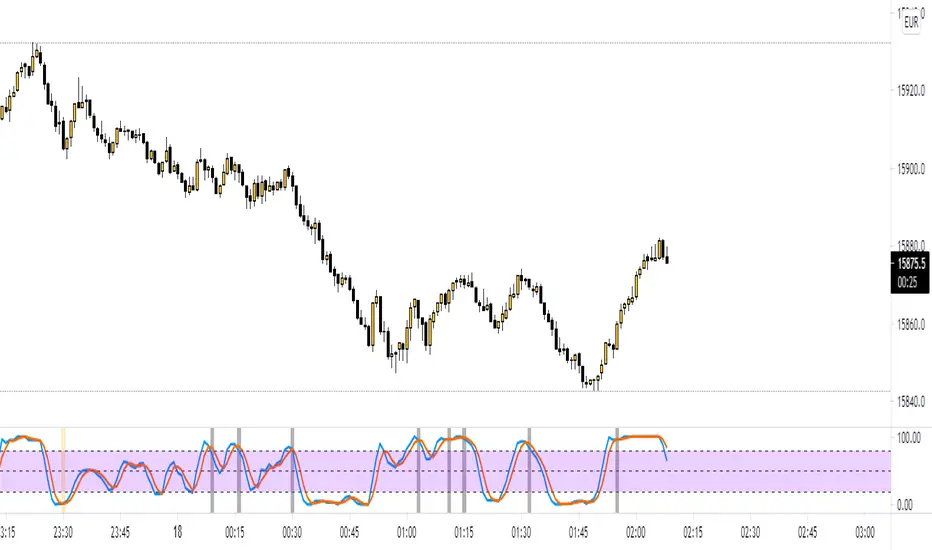
Stochastic RSI w/ Crossover Alerts (by WJ)NOTE:
// STOCH RSI CODE TAKEN FROM DEFAULT INDICATOR
// I HAVE ONLY MADE SOME ADJUSTMENTS FOR VISUAL AID
// I MADE THIS FOR MY OWN USE BUT HAVE DECIDED TO PUBLISH AND SHARE IN CASE ANYBODY WANTS TO USE IT
This is the normal default built-in Stochastic RSI indicator which I have added some stuff for visual aid:
Added middle line (50)
Stoch RSI background turns green when K line crosses D line UPWARDS, K line is below the 50 level, and price is above 200 EMA
Stoch RSI background turns red when K line crosses D line DOWNWARDS, K line is above the 50 level, and price is below 200 EMA
Alert notification on the crossover candle with background colour change conditions met
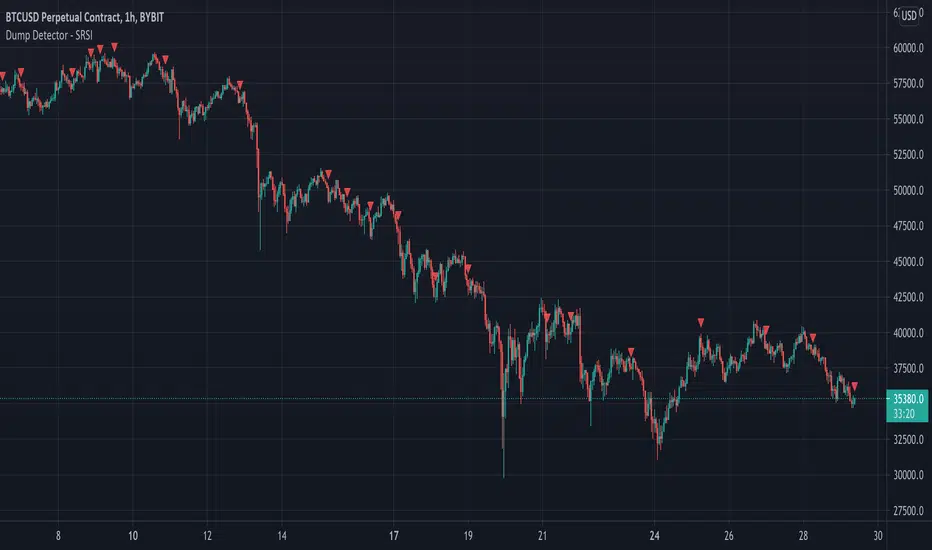
Dump Detector - Stochastic RSIDump Detecter uses Stochastic RSI to detect dumps/downtrends. Can be used as an exit trigger for long bots or an entry trigger for short bots. Change settings to lower timeframe for scalping. Pump signals can be turned on with tickbox.
Default Settings are not the usual Stochastic RSI setup and have been tuned to bitcoin 3hr chart:
Timeframe = 3hrs
smoothK = 3
smoothD = 3
lengthRSI = 6
lengthStoch = 27
src = close
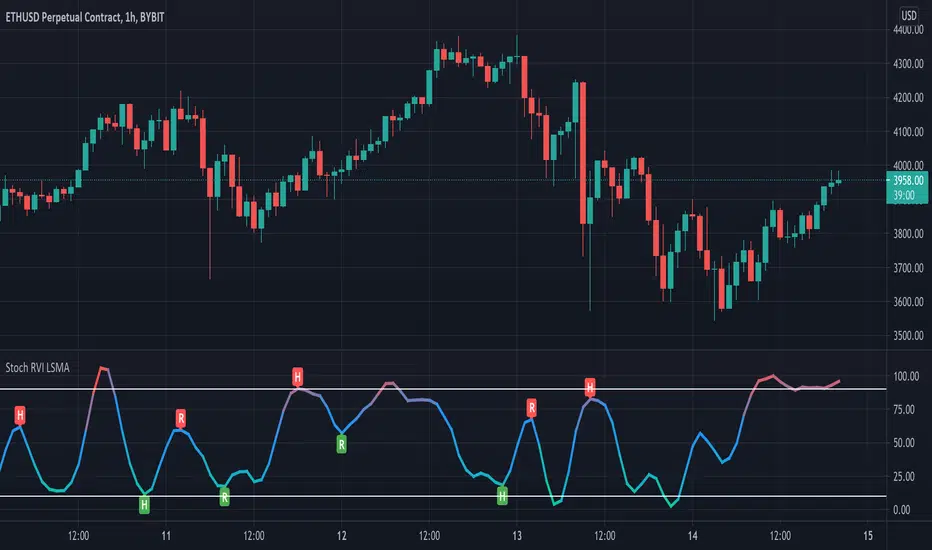
StochasticLSMAIntroducing the worlds first StochasticLSMA. A powerful Stochastic that shows trends and highlights market tops/bottoms. This may be the ultimate tool in locating tops and bottoms on any timeframe.
How to tune the settings:
Depending on what chart you use and what timeframe you are on it may be necessary to dial in the settings to correctly locate the tops and bottoms you wish to trade. Here are some settings to try:
32 < Finds longer term Tops and bottoms.
21 < Great for longer term tops and bottoms on hourly and daily charts.
19 < If 21 is not accurate enough.
17 < If 19 is not accurate enough.
13 <Great setting for short to mid range tops and bottoms and lower timeframes. (default)
11
9
6 < Excellent for finding shorter term tops and bottoms on all timeframes.
*Changing the “Stochastic Price” setting to “hl3” or “low” can help hone in on lows and highs.*
It can be very useful to to use 2 StochasticLSMA indicators with different settings. Here we have two examples how to use multiple indicators on the ETHUSD Daily chart. One set on 13 and the other on 6. A trader can enter on the 6 length indicator and exit on the 13. It also shows how it has the potential to filter out “bad entries” by matching the bottoms.
Example of different length settings.
Alerts:
Overbought: K line crosses over overbought line (Red Dot)
Oversold: K line crosses under oversold line (Green Dot)
Buy Signal: K line is under oversold line and trends up (Green Up Arrow)
Sell Signal: K line is over oversold line and trends down (Red Down Arrow)
Last Chance Sell Signal: As K line leaves overbought line (Yellow Dot)
Last Chance Buy Signal: As K line leaves oversold line (Yellow Dot)
Example of alert signals and trigger enabled in settings
