RSI + STOCH RSI - Marx_CapitalSimple RSI + STOCH RSI indicator in one pane. In addition to the standard 30/70 and 20/80 RSI levels you have three adjustable levels (eg. 0, 50, 100) to indicate STOCH RSI overbought/oversold scenarios.
Stochastic RSI (STOCH RSI)

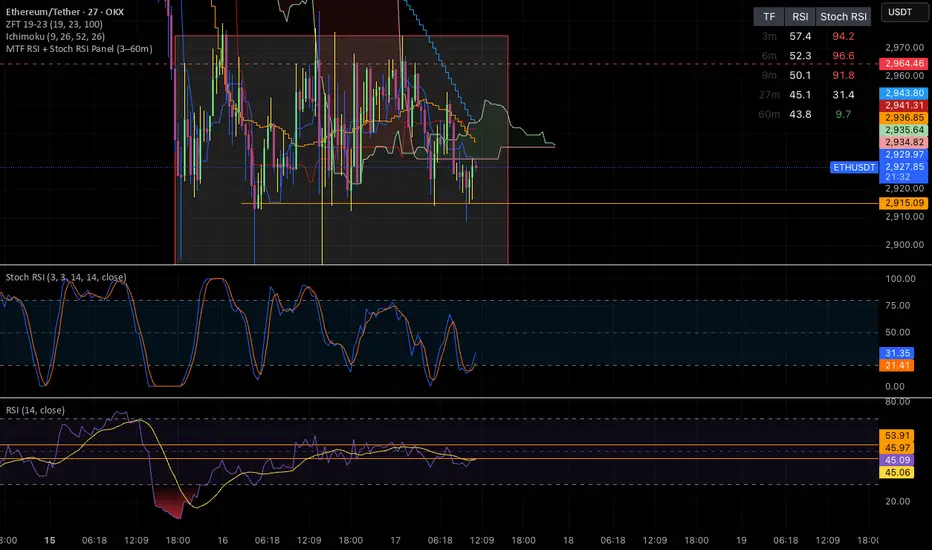
MTF RSI + Stoch RSI Panel RogmanThis script shows RSI and Stoch RSI values to assist with timing scalps
[SM-021] Gaussian Trend System [Optimized]This script is a comprehensive trend-following strategy centered around a Gaussian Channel. It is designed to capture significant market movements while filtering out noise during consolidation phases. This version (v2) introduces code optimizations using Pine Script v6 Arrays and a new Intraday Time Control feature.
1. Core Methodology & Math
The foundation of this strategy is the Gaussian Filter, originally conceptualized by @DonovanWall.
Gaussian Poles: Unlike standard moving averages (SMA/EMA), this filter uses "poles" (referencing signal processing logic) to reduce lag while maintaining smoothness.
Array Optimization: In this specific iteration, the f_pole function has been refactored to utilize Pine Script Arrays. This improves calculation efficiency and rendering speed compared to recursive variable calls, especially when calculating deep historical data.
Channel Logic: The strategy calculates a "Filtered True Range" to create High and Low bands around the main Gaussian line.
Long Entry: Price closes above the High Band.
Short Entry: Price closes below the Low Band.
2. Signal Filtering (Confluence)
To reduce false signals common in trend-following systems, the strategy employs a "confluence" approach using three additional layers:
Baseline Filter: A 200-period (customizable) EMA or SMA acts as a regime filter. Longs are only taken above the baseline; Shorts only below.
ADX Filter (Volatility): The Average Directional Index (ADX) is used to measure trend strength. If the ADX is below a user-defined threshold (default: 20), the market is considered "choppy," and new entries are blocked.
Momentum Check: A Stochastic RSI check ensures that momentum aligns with the breakout direction.
3. NEW: Intraday Session Filter
Per user requests, a time-based filter has been added to restrict trading activity to specific market sessions (e.g., the New York Open).
How it works: Users can toggle a checkbox to enable/disable the filter.
Configuration: You can define a specific time range (Default: 09:30 - 16:00) and a specific Timezone (Default: New York).
Logic: The strategy longCondition and shortCondition now check if the current bar's timestamp falls within this window. If outside the window, no new entries are generated, though existing trades are managed normally.
4. Risk Management
The strategy relies on volatility-based exits rather than fixed percentage stops:
ATR Stop Loss: A multiple of the Average True Range (ATR) is calculated at the moment of entry to set a dynamic Stop Loss.
ATR Take Profit: An optional Reward-to-Risk (RR) ratio can be set to place a Take Profit target relative to the Stop Loss distance.
Band Exit: If the trend reverses and price crosses the opposite band, the trade is closed immediately to prevent large drawdowns.
Credits & Attribution
Original Gaussian Logic: Developed by @DonovanWalll. This script utilizes his mathematical formula for the pole filters.
Strategy Wrapper & Array Refactor: Developed by @sebamarghella.
Community Request: The Intraday Session Filter was added to assist traders focusing on specific liquidity windows.
Disclaimer: This strategy is for educational purposes. Past performance is not indicative of future results. Please use the settings menu to adjust the Session Time and Risk parameters to fit your specific asset class.

NeoChartLabs Stochastic RSIOne of our Favorite Indicators - The NeoChart Labs Stochastic RSI
Slowed down and smoothed out to hide the jerky movements of the crypto market.
StochRSI measures where the current RSI value sits relative to its recent high and low range. This provides more frequent signals and is designed to address the issue of the standard RSI remaining at extreme levels for too long. Best when used with 80 / 20
Setup Keltner BandS MMS + RSI SIGNALS
📊 Keltner Bands with RSI Confirmation – TradingView Script
Introduction
This script combines Keltner Channel logic with Relative Strength Index (RSI) confirmation to provide traders with visual signals and alerts for potential reversals. It is designed for scalping and short-term trading strategies, where precision and quick decision-making are essential.
🔧 How It Works
• Keltner Bands (ATR-based):
• Two sets of bands are plotted around a moving average:
• Band 3 (ATR × 3) – more sensitive, suitable for aggressive entries.
• Band 5 (ATR × 5) – wider, used as a filter or confirmation zone.
• Signals are generated when the price crosses back inside the bands from outside.
• RSI Confirmation:
• RSI is calculated with a customizable period (default: 14).
• Overbought and oversold levels (default: 70/30) are used to filter signals.
• A bearish reversal is confirmed only if RSI is above the overbought level.
• A bullish reversal is confirmed only if RSI is below the oversold level.
📌 Functions and Features
• Visual Signals:
• Triangles plotted above/below candles for Keltner-only signals.
• Additional colored triangles for Keltner + RSI confirmed signals.
• Alerts:
• Configurable alerts for both Keltner-only and RSI-confirmed conditions.
• Messages include the type of reversal and the band level.
• Customizable Parameters:
• Moving average length.
• ATR multipliers (3 and 5).
• RSI length and thresholds.
• Colors for band fills and signals.
🎯 Usage
1. Apply the script to your chart in TradingView.
2. Adjust parameters to fit your trading style (scalping, intraday, swing).
3. Watch for signals:
• Red/green/orange/teal triangles → Keltner-only reversals.
• Maroon/lime/purple/blue triangles → RSI-confirmed reversals.
4. Set alerts to receive notifications when conditions are met.
5. Use RSI confirmation to filter out false signals and increase accuracy.
✅ Benefits
• Clear visualization of reversal zones.
• Dual-layer confirmation (Keltner + RSI).
• Flexible for different timeframes and trading styles.
• Ready-to-use alerts for automation or manual trading.

MTF Stoch RSI + RSI Signalsthis script will provide Buy and sell signals considering RSI and price action

Ehlers Dominant Cycle Stochastic RSIEhlers Enhanced Cycle Stochastic RSI
OVERVIEW
The Ehlers Enhanced Cycle Stochastic RSI is a momentum oscillator that automatically adjusts its lookback periods based on the dominant market cycle. Unlike traditional Stochastic RSI which uses fixed periods, this indicator detects the current cycle length and scales its calculations—making it responsive in fast markets and stable in slow ones.
The indicator combines John Ehlers' digital signal processing research with the classic Stochastic RSI indicator, then adds a confirmation system to ensure cycle measurements are reliable.
THE THEORY
Traditional oscillators use fixed lookback periods (ie, 14-bar RSI). This creates a fundamental problem: markets don't move in fixed cycles. A 14-period RSI might capture the rhythm perfectly during one market phase, then completely miss it when conditions change.
Ehlers' research demonstrated that price data contains measurable cyclical components. If you can detect the dominant cycle length, you can tune your indicators to match it—like tuning a radio to the right frequency.
This indicator takes that concept further by using three independent cycle detection methods and only trusting the measurement when they agree:
Hilbert Transform — A mathematical technique from signal processing that extracts cycle period from the phase relationship between price and its derivative. It is fast but can be noisy.
Autocorrelation Periodogram — Measures how similar the price series is to lagged versions of itself. The lag with highest correlation reveals the dominant cycle. More stable than Hilbert, but slightly slower to adapt.
Goertzel Algorithm (DFT) — A frequency-domain approach that calculates spectral power at each candidate period. Identifies which frequencies contain the most energy.
When all three methods converge on similar period estimates, confidence is high. When they disagree, the market may be in a non-cyclical or in transition.
HOW IT CHANGES THE STOCHASTIC RSI
Standard Stochastic RSI:
1. Calculate RSI with fixed period (14 bars)
2. Apply Stochastic formula over fixed period (14 bars)
3. Smooth with fixed periods
Ehlers Enhanced Cycle Stochastic RSI:
1. Detect dominant cycle using three methods
2. Confirm cycle measurement (methods must agree)
3. Calculate RSI with period scaled to the detected cycle
4. Apply Stochastic formula with cycle-scaled lookback
5. Smooth adaptively
The result: when the market is cycling quickly (say, 15-bar cycles), the indicator uses shorter periods and responds faster. When the market stretches into longer cycles (such as 40-bar cycles), it automatically extends its lookback to avoid whipsaws.
The Period Multipliers let you fine-tune this relationship:
• 1.0 = Use the full detected cycle (smoother, fewer signals)
• 0.5 = Use half the cycle (more responsive, catches turns earlier)
INTERPRETATION
Reading the Oscillator:
• K Line (Blue) — The main signal line. Moves between 0 and 100.
• D Line (Orange) — Smoothed version of K. Use for confirmation.
• Above 80 — Overbought. Momentum stretched to upside.
• Below 20 — Oversold. Momentum stretched to downside.
• Crossovers — K crossing above D suggests bullish momentum shift; K crossing below D suggests bearish.
Spectral Dilation (optional):
When enabled, applies a bandpass filter before cycle detection. This isolates the frequency band of interest and reduces noise. Useful for:
• Very noisy instruments
• Lower timeframes
• When confidence stays persistently low

AJFFRSI+QQEROC Uses Jurik RSI for smooth, responsive momentum measurement
Incorporates QQE features for trend strength and dynamic trailing stop signals
Designed for clearer, more reliable overbought/oversold and reversal signals on TradingView
Suitable for intraday, swing, and longer-term analysis
Not a financial advice. DYOR

Stochastic BTC OptimizedEnhanced Stochastic for Bitcoin (BTC) – Optimized for Daily Timeframe
This enhanced Stochastic oscillator is specifically fine-tuned for BTC/USD on the 1D timeframe, leveraging historical data from Bitstamp (2011–2025) to minimize false signals and maximize reliability in Bitcoin's volatile swings.
Unlike the classic Stochastic (14, 3, 3), this version uses optimized parameters:
- K Period = 21 – smoother reaction, better suited for BTC’s macro cycles
- D Period = 3, Smooth K = 3 – reduces noise while preserving responsiveness
- Overbought = 85, Oversold = 15 – accounts for BTC’s tendency to trend strongly within extreme zones without immediate reversal
✅ Smart Signal Logic:
Buy/sell signals appear only when %K crosses %D inside the oversold (≤15) or overbought (≥85) zones, and only the first signal is shown to avoid whipsaws.
Visual Enhancements:
- Thick lines when %K/%D are in overbought/oversold zones
- Green/red background highlights on valid signals
- Optional up/down arrows for clear entry visualization
- Customizable colors, line widths, and transparency
🔒 No alerts included – clean, focused on price action and momentum.
💡 Pro Tip: For even higher accuracy, use this indicator in combination with a long-term trend filter (e.g., EMA 200). The oscillator excels in ranging or retracement phases but should not be used alone in strong parabolic moves.
Based on Mozilla Public License v2.0 – feel free to use, modify, and share. Perfect for swing traders and long-term Bitcoin analysts seeking high-probability reversal zones.
перевод на русский
Улучшенный Stochastic для Bitcoin (BTC) — оптимизирован для дневного таймфрейма
Этот улучшенный осциллятор Stochastic специально настроен под BTC/USD на дневном графике, с учётом исторических данных Bitstamp (2011–2025), чтобы минимизировать ложные сигналы и повысить надёжность в условиях высокой волатильности биткоина.
В отличие от классического Stochastic (14, 3, 3), эта версия использует оптимизированные параметры:
- Период K = 21 — более плавная реакция, лучше соответствует макроциклам BTC
- Период D = 3, Сглаживание K = 3 — снижает шум, сохраняя отзывчивость
- Уровень перекупленности = 85, перепроданности = 15 — учитывает склонность BTC к сильным трендам в экстремальных зонах без немедленного разворота
✅ Интеллектуальная логика сигналов:
Покупка/продажа отображается только при пересечении %K и %D внутри зоны перепроданности (≤15) или перекупленности (≥85), и только первый сигнал фиксируется, чтобы избежать «хлыстов».
Улучшенная визуализация:
- Жирные линии, когда %K/%D находятся в экстремальных зонах
- Зелёный/красный фон при появлении сигналов
- Опциональные стрелки для чёткого отображения точек входа
- Настройка цветов, толщины линий и прозрачности
🔒 Без алертов — чистый инструмент, сфокусированный на цене и импульсе.
💡 Совет профессионала: для ещё большей точности используйте этот индикатор вместе с трендовым фильтром (например, EMA 200). Осциллятор лучше всего работает в фазах консолидации или отката, но не стоит применять его в одиночку во время сильных параболических движений.
На основе Mozilla Public License v2.0 — свободно используйте, модифицируйте и делитесь. Идеален для свинг-трейдеров и аналитиков Bitcoin, ищущих зоны с высокой вероятностью разворота.

Stochastic Hash Strat [Hash Capital Research]# Stochastic Hash Strategy by Hash Capital Research
## 🎯 What Is This Strategy?
The **Stochastic Slow Strategy** is a momentum-based trading system that identifies oversold and overbought market conditions to capture mean-reversion opportunities. Think of it as a "buy low, sell high" approach with smart mathematical filters that remove emotion from your trading decisions.
Unlike fast-moving indicators that generate excessive noise, this strategy uses **smoothed stochastic oscillators** to identify only the highest-probability setups when momentum truly shifts.
---
## 💡 Why This Strategy Works
Most traders fail because they:
- **Chase prices** after big moves (buying high, selling low)
- **Overtrade** in choppy, directionless markets
- **Exit too early** or hold losses too long
This strategy solves all three problems:
1. **Entry Discipline**: Only trades when the stochastic oscillator crosses in extreme zones (oversold for longs, overbought for shorts)
2. **Cooldown Filter**: Prevents revenge trading by forcing a waiting period after each trade
3. **Fixed Risk/Reward**: Pre-defined stop-loss and take-profit levels ensure consistent risk management
**The Math Behind It**: The stochastic oscillator measures where the current price sits relative to its recent high-low range. When it's below 25, the market is oversold (time to buy). When above 70, it's overbought (time to sell). The crossover with its moving average confirms momentum is shifting.
---
## 📊 Best Markets & Timeframes
### ⭐ OPTIMAL PERFORMANCE:
**Crude Oil (WTI) - 12H Timeframe**
- **Why it works**: Oil markets have predictable volatility patterns and respect technical levels
**AAVE/USD - 4H to 12H Timeframe**
- **Why it works**: DeFi tokens exhibit strong momentum cycles with clear extremes
### ✅ Also Works Well On:
- **BTC/USD** (12H, Daily) - Lower frequency but high win rate
- **ETH/USD** (8H, 12H) - Balanced volatility and liquidity
- **Gold (XAU/USD)** (Daily) - Classic mean-reversion asset
- **EUR/USD** (4H, 8H) - Lower volatility, requires patience
### ❌ Avoid Using On:
- Timeframes below 4H (too much noise)
- Low-liquidity altcoins (wide spreads kill performance)
- Strongly trending markets without pullbacks (Bitcoin in 2021)
- News-driven instruments during major events
---
## 🎛️ Understanding The Settings
### Core Stochastic Parameters
**Stochastic Length (Default: 16)**
- Controls the lookback period for price comparison
- Lower = faster reactions, more signals (10-14 for volatile markets)
- Higher = smoother signals, fewer trades (16-21 for stable markets)
- **Pro tip**: Use 10 for crypto 4H, 16 for commodities 12H
**Overbought Level (Default: 70)**
- Threshold for short entries
- Lower values (65-70) = more trades, earlier entries
- Higher values (75-80) = fewer but higher-conviction trades
- **Sweet spot**: 70 works for most assets
**Oversold Level (Default: 25)**
- Threshold for long entries
- Higher values (25-30) = more trades, earlier entries
- Lower values (15-20) = fewer but stronger bounce setups
- **Sweet spot**: 20-25 depending on market conditions
**Smooth K & Smooth D (Default: 7 & 3)**
- Additional smoothing to filter out whipsaws
- K=7 makes the indicator slower and more reliable
- D=3 is the signal line that confirms the trend
- **Don't change these unless you know what you're doing**
---
### Risk Management
**Stop Loss % (Default: 2.2%)**
- Automatically exits losing trades
- Should be 1.5x to 2x your average market volatility
- Too tight = death by a thousand cuts
- Too wide = uncontrolled losses
- **Calibration**: Check ATR indicator and set SL slightly above it
**Take Profit % (Default: 7%)**
- Automatically exits winning trades
- Should be 2.5x to 3x your stop loss (reward-to-risk ratio)
- This default gives 7% / 2.2% = 3.18:1 R:R
- **The golden rule**: Never have R:R below 2:1
---
### Trade Filters
**Bar Cooldown Filter (Default: ON, 3 bars)**
- **What it does**: Forces you to wait X bars after closing a trade before entering a new one
- **Why it matters**: Prevents emotional revenge trading and overtrading in choppy markets
- **Settings guide**:
- 3 bars = Standard (good for most cases)
- 5-7 bars = Conservative (oil, slow-moving assets)
- 1-2 bars = Aggressive (only for experienced traders)
**Exit on Opposite Extreme (Default: ON)**
- Closes your long when stochastic hits overbought (and vice versa)
- Acts as an early profit-taking mechanism
- **Leave this ON** unless you're testing other exit strategies
**Divergence Filter (Default: OFF)**
- Looks for price/momentum divergences for additional confirmation
- **When to enable**: Trending markets where you want fewer but higher-quality trades
- **Keep OFF for**: Mean-reverting markets (oil, forex, most of the time)
---
## 🚀 Quick Start Guide
### Step 1: Set Up in TradingView
1. Open TradingView and navigate to your chart
2. Click "Pine Editor" at the bottom
3. Copy and paste the strategy code
4. Click "Add to Chart"
5. The strategy will appear in a separate pane below your price chart
### Step 2: Choose Your Market
**If you're trading Crude Oil:**
- Timeframe: 12H
- Keep all default settings
- Watch for signals during London/NY overlap (8am-11am EST)
**If you're trading AAVE or crypto:**
- Timeframe: 4H or 12H
- Consider these adjustments:
- Stochastic Length: 10-14 (faster)
- Oversold: 20 (more aggressive)
- Take Profit: 8-10% (higher targets)
### Step 3: Wait for Your First Signal
**LONG Entry** (Green circle appears):
- Stochastic crosses up below oversold level (25)
- Price likely near recent lows
- System places limit order at take profit and stop loss
**SHORT Entry** (Red circle appears):
- Stochastic crosses down above overbought level (70)
- Price likely near recent highs
- System places limit order at take profit and stop loss
**EXIT** (Orange circle):
- Position closes either at stop, target, or opposite extreme
- Cooldown period begins
### Step 4: Let It Run
The biggest mistake? **Interfering with the system.**
- Don't close trades early because you're scared
- Don't skip signals because you "have a feeling"
- Don't increase position size after a big win
- Don't revenge trade after a loss
**Follow the system or don't use it at all.**
---
### Important Risks:
1. **Drawdown Pain**: You WILL experience losing streaks of 5-7 trades. This is mathematically normal.
2. **Whipsaw Markets**: Choppy, range-bound conditions can trigger multiple small losses.
3. **Gap Risk**: Overnight gaps can cause your actual fill to be worse than the stop loss.
4. **Slippage**: Real execution prices differ from backtested prices (factor in 0.1-0.2% slippage).
---
## 🔧 Optimization Guide
### When to Adjust Settings:
**Market Volatility Increased?**
- Widen stop loss by 0.5-1%
- Increase take profit proportionally
- Consider increasing cooldown to 5-7 bars
**Getting Too Few Signals?**
- Decrease stochastic length to 10-12
- Increase oversold to 30, decrease overbought to 65
- Reduce cooldown to 2 bars
**Getting Too Many Losses?**
- Increase stochastic length to 18-21 (slower, smoother)
- Enable divergence filter
- Increase cooldown to 5+ bars
- Verify you're on the right timeframe
### A/B Testing Method:
1. **Run default settings for 50 trades** on your chosen market
2. Document: Win rate, profit factor, max drawdown, emotional tolerance
3. **Change ONE variable** (e.g., oversold from 25 to 20)
4. Run another 50 trades
5. Compare results
6. Keep the better version
**Never change multiple settings at once** or you won't know what worked.
---
## 📚 Educational Resources
### Key Concepts to Learn:
**Stochastic Oscillator**
- Developed by George Lane in the 1950s
- Measures momentum by comparing closing price to price range
- Formula: %K = (Close - Low) / (High - Low) × 100
- Similar to RSI but more sensitive to price movements
**Mean Reversion vs. Trend Following**
- This is a **mean reversion** strategy (price returns to average)
- Works best in ranging markets with defined support/resistance
- Fails in strong trending markets (2017 Bitcoin, 2020 Tech stocks)
- Complement with trend filters for better results
**Risk:Reward Ratio**
- The cornerstone of profitable trading
- Winning 40% of trades with 3:1 R:R = profitable
- Winning 60% of trades with 1:1 R:R = breakeven (after fees)
- **This strategy aims for 45% win rate with 2.5-3:1 R:R**
### Recommended Reading:
- *"Trading Systems and Methods"* by Perry Kaufman (Chapter on Oscillators)
- *"Mean Reversion Trading Systems"* by Howard Bandy
- *"The New Trading for a Living"* by Dr. Alexander Elder
---
## 🛠️ Troubleshooting
### "I'm not seeing any signals!"
**Check:**
- Is your timeframe 4H or higher?
- Is the stochastic actually reaching extreme levels (check if your asset is stuck in middle range)?
- Is cooldown still active from a previous trade?
- Are you on a low-liquidity pair?
**Solution**: Switch to a more volatile asset or lower the overbought/oversold thresholds.
---
### "The strategy keeps losing money!"
**Check:**
- What's your win rate? (Below 35% is concerning)
- What's your profit factor? (Below 0.8 means serious issues)
- Are you trading during major news events?
- Is the market in a strong trend?
**Solution**:
1. Verify you're using recommended markets/timeframes
2. Increase cooldown period to avoid choppy markets
3. Reduce position size to 5% while you diagnose
4. Consider switching to daily timeframe for less noise
---
### "My stop losses keep getting hit!"
**Check:**
- Is your stop loss tighter than the average ATR?
- Are you trading during high-volatility sessions?
- Is slippage eating into your buffer?
**Solution**:
1. Calculate the 14-period ATR
2. Set stop loss to 1.5x the ATR value
3. Avoid trading right after market open or major news
4. Factor in 0.2% slippage for crypto, 0.1% for oil
---
## 💪 Pro Tips from the Trenches
### Psychological Discipline
**The Three Deadly Sins:**
1. **Skipping signals** - "This one doesn't feel right"
2. **Early exits** - "I'll just take profit here to be safe"
3. **Revenge trading** - "I need to make back that loss NOW"
**The Solution:** Treat your strategy like a business system. Would McDonald's skip making fries because the cashier "doesn't feel like it today"? No. Systems work because of consistency.
---
### Position Management
**Scaling In/Out** (Advanced)
- Enter 50% position at signal
- Add 50% if stochastic reaches 10 (oversold) or 90 (overbought)
- Exit 50% at 1.5x take profit, let the rest run
**This is NOT for beginners.** Master the basic system first.
---
### Market Awareness
**Oil Traders:**
- OPEC meetings = volatility spikes (avoid or widen stops)
- US inventory reports (Wed 10:30am EST) = avoid trading 2 hours before/after
- Summer driving season = different patterns than winter
**Crypto Traders:**
- Monday-Tuesday = typically lower volatility (fewer signals)
- Thursday-Sunday = higher volatility (more signals)
- Avoid trading during exchange maintenance windows
---
## ⚖️ Legal Disclaimer
This trading strategy is provided for **educational purposes only**.
- Past performance does not guarantee future results
- Trading involves substantial risk of loss
- Only trade with capital you can afford to lose
- No one associated with this strategy is a licensed financial advisor
- You are solely responsible for your trading decisions
**By using this strategy, you acknowledge that you understand and accept these risks.**
---
## 🙏 Acknowledgments
Strategy development inspired by:
- George Lane's original Stochastic Oscillator work
- Modern quantitative trading research
- Community feedback from hundreds of backtests
Built with ❤️ for retail traders who want systematic, disciplined approaches to the markets.
---
**Good luck, stay disciplined, and trade the system, not your emotions.**

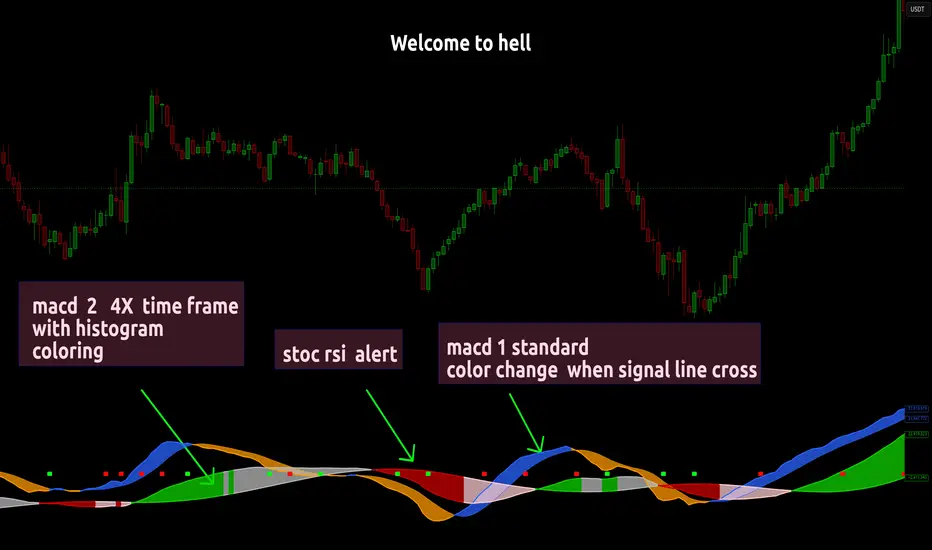
Dual MACD With Pilot Background + + Stoch RSI Alert HELL 2macd 1 chart time macd 2 4x chart time with over bought and over sold stoc rsi alerts
SMI Color Red/Green📌 TradingView Description – SMI Red/Green Momentum Line
🔥 Stochastics Momentum Index (SMI) – Dynamic Red/Green Version
This indicator is an enhanced and modernized version of the Stochastic Momentum Index (SMI), designed to deliver a more visual, intuitive, and responsive view of trend momentum.
It includes:
✔️ Smoothed SMI
✔️ Dynamic Red/Green momentum coloring
✔️ Signal EMA line
✔️ Overbought/Oversold zones with shading
🎨 Dynamic Red/Green SMI Line
The main SMI line automatically changes color based on momentum direction:
Green → Bullish momentum (SMI rising)
Red → Bearish momentum (SMI falling)
This provides instant visual feedback and highlights early momentum changes even before traditional signal-line crossovers.
📉 Indicator Structure
1️⃣ Smoothed SMI
The SMI is calculated using the price’s position inside its range and then smoothed with an SMA to reduce noise.
2️⃣ EMA Signal Line
A customizable EMA acts as a signal line, providing:
Clear bullish/bearish crossovers
Trend confirmation
Cleaner entry/exit signals
3️⃣ Overbought / Oversold Zones
Extreme levels are highlighted using color-filled zones:
Red Zone (Overbought) → potential bearish reversal
Green Zone (Oversold) → potential bullish reversal
Levels are fully adjustable.
💡 How to Use It
The indicator works exceptionally well across all timeframes.
The most powerful signals are:
✔️ SMI crossing above/below the EMA
SMI crosses above EMA → bullish signal
SMI crosses below EMA → bearish signal
✔️ Leaving Overbought/Oversold zones
SMI exits the oversold zone → potential long setup
SMI exits the overbought zone → potential short setup
✔️ Color shifts (momentum direction)
Red → Green : early bullish momentum
Green → Red : early bearish momentum
Perfect for scalping, day trading, and swing trading.
🚀 Why This Version Is Better
Extremely visual momentum reading
Noise reduction through smoothing
Instantly readable color-coded trend
Strong OB/OS zone visualization
Works on any market and timeframe
Great in combination with RSI, MACD, HMA, ALMA, and trend filters
If you'd like, I can also write:
🔹 a SEO-optimized title,
🔹 recommended TradingView tags,
🔹 or a shorter promotional description.

MACD FROM HELLthis is a double macd with 2 time frames macd 1 is chart macd 4 is 4X meaning the 1hr becomes the 4hr and it uses the histogram coloring for added detail ,, on top of that it has stochastic rsi Alerts set to trigger when k line goes above 99.9 or below 0.01 and exits ,, alert triggers on exit
Range Oscillator Strategy + Stoch Confirm🔹 Short summary
This is a free, educational long-only strategy built on top of the public “Range Oscillator” by Zeiierman (used under CC BY-NC-SA 4.0), combined with a Stochastic timing filter, an EMA-based exit filter and an optional risk-management layer (SL/TP and R-multiple exits). It is NOT financial advice and it is NOT a magic money machine. It’s a structured framework to study how range-expansion + momentum + trend slope can be combined into one rule-based system, often with intentionally RARE trades.
────────────────────────
0. Legal / risk disclaimer
────────────────────────
• This script is FREE and public. I do not charge any fee for it.
• It is for EDUCATIONAL PURPOSES ONLY.
• It is NOT financial advice and does NOT guarantee profits.
• Backtest results can be very different from live results.
• Markets change over time; past performance is NOT indicative of future performance.
• You are fully responsible for your own trades and risk.
Please DO NOT use this script with money you cannot afford to lose. Always start in a demo / paper trading environment and make sure you understand what the logic does before you risk any capital.
────────────────────────
1. About default settings and risk (very important)
────────────────────────
The script is configured with the following defaults in the `strategy()` declaration:
• `initial_capital = 10000`
→ This is only an EXAMPLE account size.
• `default_qty_type = strategy.percent_of_equity`
• `default_qty_value = 100`
→ This means 100% of equity per trade in the default properties.
→ This is AGGRESSIVE and should be treated as a STRESS TEST of the logic, not as a realistic way to trade.
TradingView’s House Rules recommend risking only a small part of equity per trade (often 1–2%, max 5–10% in most cases). To align with these recommendations and to get more realistic backtest results, I STRONGLY RECOMMEND you to:
1. Open **Strategy Settings → Properties**.
2. Set:
• Order size: **Percent of equity**
• Order size (percent): e.g. **1–2%** per trade
3. Make sure **commission** and **slippage** match your own broker conditions.
• By default this script uses `commission_value = 0.1` (0.1%) and `slippage = 3`, which are reasonable example values for many crypto markets.
If you choose to run the strategy with 100% of equity per trade, please treat it ONLY as a stress-test of the logic. It is NOT a sustainable risk model for live trading.
────────────────────────
2. What this strategy tries to do (conceptual overview)
────────────────────────
This is a LONG-ONLY strategy designed to explore the combination of:
1. **Range Oscillator (Zeiierman-based)**
- Measures how far price has moved away from an adaptive mean.
- Uses an ATR-based range to normalize deviation.
- High positive oscillator values indicate strong price expansion away from the mean in a bullish direction.
2. **Stochastic as a timing filter**
- A classic Stochastic (%K and %D) is used.
- The logic requires %K to be below a user-defined level and then crossing above %D.
- This is intended to catch moments when momentum turns up again, rather than chasing every extreme.
3. **EMA Exit Filter (trend slope)**
- An EMA with configurable length (default 70) is calculated.
- The slope of the EMA is monitored: when the slope turns negative while in a long position, and the filter is enabled, it triggers an exit condition.
- This acts as a trend-protection exit: if the medium-term trend starts to weaken, the strategy exits even if the oscillator has not yet fully reverted.
4. **Optional risk-management layer**
- Percentage-based Stop Loss and Take Profit (SL/TP).
- Risk/Reward (R-multiple) exit based on the distance from entry to SL.
- Implemented as OCO orders that work *on top* of the logical exits.
The goal is not to create a “holy grail” system but to serve as a transparent, configurable framework for studying how these concepts behave together on different markets and timeframes.
────────────────────────
3. Components and how they work together
────────────────────────
(1) Range Oscillator (based on “Range Oscillator (Zeiierman)”)
• The script computes a weighted mean price and then measures how far price deviates from that mean.
• Deviation is normalized by an ATR-based range and expressed as an oscillator.
• When the oscillator is above the **entry threshold** (default 100), it signals a strong move away from the mean in the bullish direction.
• When it later drops below the **exit threshold** (default 30), it can trigger an exit (if enabled).
(2) Stochastic confirmation
• Classic Stochastic (%K and %D) is calculated.
• An entry requires:
- %K to be below a user-defined “Cross Level”, and
- then %K to cross above %D.
• This is a momentum confirmation: the strategy tries to enter when momentum turns up from a pullback rather than at any random point.
(3) EMA Exit Filter
• The EMA length is configurable via `emaLength` (default 70).
• The script monitors the EMA slope: it computes the relative change between the current EMA and the previous EMA.
• If the slope turns negative while the strategy holds a long position and the filter is enabled, it triggers an exit condition.
• This is meant to help protect profits or cut losses when the medium-term trend starts to roll over, even if the oscillator conditions are not (yet) signalling exit.
(4) Risk management (optional)
• Stop Loss (SL) and Take Profit (TP):
- Defined as percentages relative to average entry price.
- Both are disabled by default, but you can enable them in the Inputs.
• Risk/Reward Exit:
- Uses the distance from entry to SL to project a profit target at a configurable R-multiple.
- Also optional and disabled by default.
These exits are implemented as `strategy.exit()` OCO orders and can close trades independently of oscillator/EMA conditions if hit first.
────────────────────────
4. Entry & Exit logic (high level)
────────────────────────
A) Time filter
• You can choose a **Start Year** in the Inputs.
• Only candles between the selected start date and 31 Dec 2069 are used for backtesting (`timeCondition`).
• This prevents accidental use of tiny cherry-picked windows and makes tests more honest.
B) Entry condition (long-only)
A long entry is allowed when ALL the following are true:
1. `timeCondition` is true (inside the backtest window).
2. If `useOscEntry` is true:
- Range Oscillator value must be above `entryLevel`.
3. If `useStochEntry` is true:
- Stochastic condition (`stochCondition`) must be true:
- %K < `crossLevel`, then %K crosses above %D.
If these filters agree, the strategy calls `strategy.entry("Long", strategy.long)`.
C) Exit condition (logical exits)
A position can be closed when:
1. `timeCondition` is true AND a long position is open, AND
2. At least one of the following is true:
- If `useOscExit` is true: Oscillator is below `exitLevel`.
- If `useMagicExit` (EMA Exit Filter) is true: EMA slope is negative (`isDown = true`).
In that case, `strategy.close("Long")` is called.
D) Risk-management exits
While a position is open:
• If SL or TP is enabled:
- `strategy.exit("Long Risk", ...)` places an OCO stop/limit order based on the SL/TP percentages.
• If Risk/Reward exit is enabled:
- `strategy.exit("RR Exit", ...)` places an OCO order using a projected R-multiple (`rrMult`) of the SL distance.
These risk-based exits can trigger before the logical oscillator/EMA exits if price hits those levels.
────────────────────────
5. Recommended backtest configuration (to avoid misleading results)
────────────────────────
To align with TradingView House Rules and avoid misleading backtests:
1. **Initial capital**
- 10 000 (or any value you personally want to work with).
2. **Order size**
- Type: **Percent of equity**
- Size: **1–2%** per trade is a reasonable starting point.
- Avoid risking more than 5–10% per trade if you want results that could be sustainable in practice.
3. **Commission & slippage**
- Commission: around 0.1% if that matches your broker.
- Slippage: a few ticks (e.g. 3) to account for real fills.
4. **Timeframe & markets**
- Volatile symbols (e.g. crypto like BTCUSDT, or major indices).
- Timeframes: 1H / 4H / **1D (Daily)** are typical starting points.
- I strongly recommend trying the strategy on **different timeframes**, for example 1D, to see how the behaviour changes between intraday and higher timeframes.
5. **No “caution warning”**
- Make sure your chosen symbol + timeframe + settings do not trigger TradingView’s caution messages.
- If you see warnings (e.g. “too few trades”), adjust timeframe/symbol or the backtest period.
────────────────────────
5a. About low trade count and rare signals
────────────────────────
This strategy is intentionally designed to trade RARELY:
• It is **long-only**.
• It uses strict filters (Range Oscillator threshold + Stochastic confirmation + optional EMA Exit Filter).
• On higher timeframes (especially **1D / Daily**) this can result in a **low total number of trades**, sometimes WELL BELOW 100 trades over the whole backtest.
TradingView’s House Rules mention 100+ trades as a guideline for more robust statistics. In this specific case:
• The **low trade count is a conscious design choice**, not an attempt to cherry-pick a tiny, ultra-profitable window.
• The goal is to study a **small number of high-conviction long entries** on higher timeframes, not to generate frequent intraday signals.
• Because of the low trade count, results should NOT be interpreted as statistically strong or “proven” – they are only one sample of how this logic would have behaved on past data.
Please keep this in mind when you look at the equity curve and performance metrics. A beautiful curve with only a handful of trades is still just a small sample.
────────────────────────
6. How to use this strategy (step-by-step)
────────────────────────
1. Add the script to your chart.
2. Open the **Inputs** tab:
- Set the backtest start year.
- Decide whether to use Oscillator-based entry/exit, Stochastic confirmation, and EMA Exit Filter.
- Optionally enable SL, TP, and Risk/Reward exits.
3. Open the **Properties** tab:
- Set a realistic account size if you want.
- Set order size to a realistic % of equity (e.g. 1–2%).
- Confirm that commission and slippage are realistic for your broker.
4. Run the backtest:
- Look at Net Profit, Max Drawdown, number of trades, and equity curve.
- Remember that a low trade count means the statistics are not very strong.
5. Experiment:
- Tweak thresholds (`entryLevel`, `exitLevel`), Stochastic settings, EMA length, and risk params.
- See how the metrics and trade frequency change.
6. Forward-test:
- Before using any idea in live trading, forward-test on a demo account and observe behaviour in real time.
────────────────────────
7. Originality and usefulness (why this is more than a mashup)
────────────────────────
This script is not intended to be a random visual mashup of indicators. It is designed as a coherent, testable strategy with clear roles for each component:
• Range Oscillator:
- Handles mean vs. range-expansion states via an adaptive, ATR-normalized metric.
• Stochastic:
- Acts as a timing filter to avoid entering purely on extremes and instead waits for momentum to turn.
• EMA Exit Filter:
- Trend-slope-based safety net to exit when the medium-term direction changes against the position.
• Risk module:
- Provides practical, rule-based exits: SL, TP, and R-multiple exit, which are useful for structuring risk even if you modify the core logic.
It aims to give traders a ready-made **framework to study and modify**, not a black box or “signals” product.
────────────────────────
8. Limitations and good practices
────────────────────────
• No single strategy works on all markets or in all regimes.
• This script is long-only; it does not short the market.
• Performance can degrade when market structure changes.
• Overfitting (curve fitting) is a real risk if you endlessly tweak parameters to maximise historical profit.
Good practices:
- Test on multiple symbols and timeframes.
- Focus on stability and drawdown, not only on how high the profit line goes.
- View this as a learning tool and a basis for your own research.
────────────────────────
9. Licensing and credits
────────────────────────
• Core oscillator idea & base code:
- “Range Oscillator (Zeiierman)”
- © Zeiierman, licensed under CC BY-NC-SA 4.0.
• Strategy logic, Stochastic confirmation, EMA Exit Filter, and risk-management layer:
- Modifications by jokiniemi.
Please respect both the original license and TradingView House Rules if you fork or republish any part of this script.
────────────────────────
10. No payments / no vendor pitch
────────────────────────
• This script is completely FREE to use on TradingView.
• There is no paid subscription, no external payment link, and no private signals group attached to it.
• If you have questions, please use TradingView’s comment system or private messages instead of expecting financial advice.
Use this script as a tool to learn, experiment, and build your own understanding of markets.
────────────────────────
11. Example backtest settings used in screenshots
────────────────────────
To avoid any confusion about how the results shown in screenshots were produced, here is one concrete example configuration:
• Symbol: BTCUSDT (or similar major BTC pair)
• Timeframe: 1D (Daily)
• Backtest period: from 2018 to the most recent data
• Initial capital: 10 000
• Order size type: Percent of equity
• Order size: 2% per trade
• Commission: 0.1%
• Slippage: 3 ticks
• Risk settings: Stop Loss and Take Profit disabled by default, Risk/Reward exit disabled by default
• Filters: Range Oscillator entry/exit enabled, Stochastic confirmation enabled, EMA Exit Filter enabled
If you change any of these settings (symbol, timeframe, risk per trade, commission, slippage, filters, etc.), your results will look different. Please always adapt the configuration to your own risk tolerance, market, and trading style.

Stochastic RSI - WT Confluence Signal Detectors (TraderDemircan)Description
What This Indicator Does:
This indicator combines two powerful momentum oscillators—WaveTrend and Stochastic RSI—to identify high-probability trading signals through confluence. Instead of relying on a single indicator that may generate false signals, this tool only triggers buy/sell alerts when both oscillators simultaneously confirm extreme market conditions and trend reversals. This confluence approach significantly reduces noise and helps traders focus on the most reliable setups.
Key Features:
Dual-Oscillator Confluence: Generates signals only when both WaveTrend crossovers and Stochastic RSI extreme levels align
Normalized Scale Display: Both oscillators are plotted on a unified -100 to +100 scale for easy visual comparison
Visual Signal Confirmation: Clear intersection points marked with colored circles, plus optional candle coloring at crossover moments
Customizable Thresholds: Adjust overbought/oversold levels for both oscillators to match your trading style and asset volatility
Clean Visual Presentation: Optional area fill showing WaveTrend momentum difference, making divergences easier to spot
How It Works:
The indicator operates on a confluence principle where multiple conditions must align:
For BUY Signals (Green):
WaveTrend 1 crosses above WaveTrend 2 (bullish crossover)
WaveTrend is in oversold territory (below -53 or -60)
Stochastic RSI K-line is below 20 (oversold)
For SELL Signals (Red):
WaveTrend 1 crosses below WaveTrend 2 (bearish crossover)
WaveTrend is in overbought territory (above 53 or 60)
Stochastic RSI K-line is above 80 (overbought)
WaveTrend Component:
Uses the hlc3 price (average of high, low, close) to calculate a channel index that identifies market momentum waves. The two WaveTrend lines (WT1 and WT2) act similarly to MACD, where crossovers indicate momentum shifts. The oscillator ranges from approximately -100 to +100, with extreme values suggesting potential reversals.
Stochastic RSI Component:
Applies stochastic calculations to RSI values rather than raw price, creating a more sensitive momentum indicator. Values above 80 indicate overbought conditions (potential selling opportunity), while values below 20 indicate oversold conditions (potential buying opportunity). The indicator includes both K-line (faster) and D-line (slower, smoothed) for additional confirmation.
Normalization Technology:
To enable direct visual comparison, the Stochastic RSI (normally 0-100 scale) is normalized to match WaveTrend's -100 to +100 scale. This allows traders to see both oscillators' movements in relation to the same reference levels, making divergences and convergences more apparent.
How to Use:
For Trend Traders:
Wait for confluence signals in the direction of the larger trend
Use buy signals in uptrends as entry points during pullbacks
Use sell signals in downtrends as entry points during bounces
For Reversal Traders:
Focus on confluence signals at major support/resistance levels
Look for divergences between price and oscillators before confluence signals
Consider stronger signals when both oscillators reach extreme levels (WT beyond ±60, Stoch beyond 20/80)
For Scalpers:
Lower the WaveTrend Channel Length (default 10) to 5-7 for more frequent signals
Tighten overbought/oversold thresholds slightly (e.g., WT: ±50, Stoch: 30/70)
Use on lower timeframes (5m, 15m) with strict stop losses
Settings Guide:
WaveTrend Parameters:
Channel Length (10): Controls sensitivity. Lower = more signals but more noise. Higher = fewer but more reliable signals
Average Length (21): Smoothing period for WT2. Higher values reduce whipsaws
Overbought Levels (60/53): Two-tier system. Breaching 60 indicates strong overbought, 53 is moderate
Oversold Levels (-60/-53): Mirror of overbought levels for downside extremes
Stochastic RSI Parameters:
K-Smooth (3): Smoothing for the K-line. Higher = smoother but delayed
D-Smooth (3): Additional smoothing for the D-line signal
RSI Period (14): Standard RSI calculation period
Stoch Period (14): Stochastic calculation lookback
Oversold (20) / Overbought (80): Classic thresholds for extreme conditions
Visual Options:
Show WT Difference Area: Displays the momentum difference between WT1 and WT2 as a blue shaded area
Show WT Intersection Points: Marks crossover points with colored circles (red for bearish, green for bullish)
Color Candles at Intersection: Changes candle colors at crossover moments (blue for bearish, yellow for bullish)
Show Stoch Over Signals: Displays when Stochastic RSI breaches extreme levels
What Makes This Original:
While WaveTrend and Stochastic RSI are established indicators, this script's originality lies in:
Confluence Logic: The specific combination requiring simultaneous confirmation from both oscillators in extreme zones, not just simple crossovers
Normalization Approach: Displaying both oscillators on the same -100 to +100 scale for direct visual comparison, which is not standard
Multi-Tier Overbought/Oversold: Using two levels (60/53) instead of one, allowing for nuanced signal strength assessment
Integrated Visual System: Combining area fills, intersection markers, and candle coloring in a coordinated display that shows momentum flow at a glance
Important Considerations:
This is a momentum-based oscillator system, which performs best in ranging or trending markets with clear swings
In strong trending markets, the oscillator may remain in extreme zones for extended periods (remain overbought during strong uptrends, oversold during strong downtrends)
Confluence signals are intentionally rare to maintain quality—expect fewer signals than with single-indicator systems
Always combine with price action analysis, support/resistance levels, and proper risk management
Not recommended for extremely low volatility or thin markets where oscillators may produce erratic readings
Best Timeframes:
Intraday: 15m, 1H (with tighter parameters)
Swing Trading: 4H, Daily (with default parameters)
Position Trading: Daily, Weekly (with extended Channel Length 15-20)
Typical Use Cases:
Identifying exhaustion points in trending markets
Timing entries during pullbacks in established trends
Spotting potential reversal zones at key price levels
Filtering out weak momentum signals during consolidation

Volume Weighted Stochastic RSIThis indicator calculates the Stochastic RSI, enhanced with optional Volume Weighting (VWStochRSI). It measures the level of a (Volume-Weighted) RSI relative to its high-low range over a set period, providing a sensitive momentum oscillator.
Key Features:
Volume-Weighted Core: The indicator is built on a Relative Strength Index (RSI) that can be optionally volume-weighted (Volume weighted).
Customizable Smoothing: The %K and %D lines are smoothed using a customizable moving average. The MA type (Smooth Method) can be selected (e.g., EMA, SMA, WMA) and will also be volume-weighted if the main Volume weighted option is enabled.
Full Divergence Suite (Class A, B, C): The primary feature is the integrated divergence engine. It automatically detects and plots all three major types of divergences:
Regular (A): Signals potential trend reversals.
Hidden (B): Signals potential trend continuations.
Exaggerated (C): Signals weakness at double tops/bottoms.
Divergence Filtering and Visualization:
Price Tolerance Filter: Divergence detection is enhanced with a percentage-based price tolerance (pivPrcTol) to filter out insignificant market noise.
Persistent Visualization: Divergence markers are plotted for the entire duration of the signal and are visually anchored to the %K line level of the confirming pivot.
Note on Confirmation (Lag): Divergence signals rely on a pivot confirmation method to ensure they do not repaint.
The Start of a- divergence is only detected after the confirming pivot is fully formed (a delay based on Pivot Right Bars).
The End of a divergence is detected either instantly (if the signal is invalidated by price action) or with a delay (when a new, non-divergent pivot is confirmed).
Multi-Timeframe (MTF) Capability:
MTF VWStochRSI Lines: The %K and %D lines can be calculated on a higher timeframe, with standard options to handle gaps (Fill Gaps) and prevent repainting (Wait for...).
Limitation: The Divergence detection engine (pivDiv) is disabled if a timeframe other than the chart's timeframe is selected. Divergences are only calculated on the active chart timeframe.
Integrated Alerts: Includes 20 comprehensive alerts for:
The start and end of all 6 divergence types.
The %K line crossing the %D line.
The %K line crossing the Overbought, Oversold, or 50-level lines.
DISCLAIMER
For Informational/Educational Use Only: This indicator is provided for informational and educational purposes only. It does not constitute financial, investment, or trading advice, nor is it a recommendation to buy or sell any asset.
Use at Your Own Risk: All trading decisions you make based on the information or signals generated by this indicator are made solely at your own risk.
No Guarantee of Performance: Past performance is not an indicator of future results. The author makes no guarantee regarding the accuracy of the signals or future profitability.
No Liability: The author shall not be held liable for any financial losses or damages incurred directly or indirectly from the use of this indicator.
Signals Are Not Recommendations: The alerts and visual signals (e.g., crossovers) generated by this tool are not direct recommendations to buy or sell. They are technical observations for your own analysis and consideration.

GTI BGTI: RSI Suite (Standard • Stochastic • Smoothed)
A three-layer momentum and trend toolkit that combines Standard RSI, Stochastic RSI, and a Smoothed/“Macro” RSI to help you read intraday swings, trend transitions, and high-probability reversal/continuation spots.
All in one pane with intuitive coloring and optional divergence markers and alerts.
Why this works
* Stochastic RSI (K/D) visualizes fast momentum swings and timing.
* Standard RSI moves more gradually, helping confirm trend transitions that may span several Stochastic cycles.
* Smoothed RSI (Average → Macro) adds a second-pass filter and slope persistence to reveal the macro direction while suppressing noise.
Used together, Stochastic guides entries/exits around local highs/lows, while the RSI layers improve confidence when a small swing is likely part of a larger turn.
What you’ll see
* Standard RSI (yellow; pink above Bull line, aqua below Bear line).
* Stochastic RSI (K/D) with contextual colors:
* Greens when RSI is weak/oversold (bearish conditions → watch for bullish reversals/continuations).
* Reds when RSI is strong/overbought (bullish conditions → watch for bearish reversals/continuations).
* Smoothed (Macro) RSI with trend color:
* Red when macro is ascending (bullish),
* Aqua when macro is descending (bearish).
* Divergences (optional markers):
* Bearish: RSI Lower High + Price Higher High (red ⬇).
* Bullish: RSI Higher Low + Price Lower Low (green ⬆).
* No repaint: pivots confirm after the chosen right-bars window.
How to use it
* Bullish Reversal
* Macro RSI is reversing at a higher low after price has been in a overall downtrend
* Stochastic RSI is switching from green to red in an overall downtrend
* Bullish Oversold
* Macro RSI is reversing from a significantly low level after price has a short but strong dip during an overall uptrend
* Stochastic RSI is switching from green to red in an overall uptrend
* Bullish Continuation
* Macro RSI is ascending with a strong slope or forming a higher low above the 50 line
* Stochastic RSI is reaching a bottom but still painted red
* Bearish Reversal
* Macro RSI is reversing at a lower high after price has been in a overall uptrend
* Stochastic RSI is switching from red to green in an overall uptrend
* Bearish Overbought
* Macro RSI is reversing from a significantly high level after price has a short but strong jump during an overall downtrend
* Stochastic RSI is switching from red to green in an overall downtrend
* Bearish Continuation
* Macro RSI is descending with a strong slope or forming a lower high below the 50 line
* Stochastic RSI is reaching a top but still painted green
* Divergences: Use as signals of exhaustion—best when aligned with Macro RSI color/slope and key levels (e.g., Bull/Bear lines, 50 midline).
*** IMPORTANT ***
* Stack confluence, don’t single-signal trade. Look for:
* 1) Macro RSI color & slope (red = ascending/bullish, aqua = descending/bearish)
* 2) Standard RSI location (above/below Bull/Bear lines or 50)
* 3) Stoch flip + direction
* 4) Price structure (HH/HL vs LH/LL)
* 5) Divergence type (regular vs hidden) at meaningful levels
* Trade with the macro
* Prioritize longs when Macro RSI is red or just flipped up
* Prioritize shorts when Macro RSI is aqua or just flipped down
* Counter-trend setups = smaller size and faster management.
* Location > signal
* The same crossover/divergence is higher quality near Bull (~60)/Bear(~40) or extremes than in the mid-range chop around 50.
* Early vs confirmed
* Use the early pivot heads-up for anticipation, but scale in only after the confirmed pivot (right-bars complete). If early signal fails to confirm, stand down.
* Define invalidation upfront
* For divergence entries, place stops beyond the pivot extreme (LL/HH). If Macro RSI flips against your trade or RSI breaks back through 50 with slope, exit or tighten.
* Multi-timeframe alignment
* Best results come when entry timeframe (e.g., 1H) aligns with higher-TF macro (e.g., 4H/D). If they disagree, treat it as mean-reversion only.
* Avoid common traps
* Skip: isolated Stochastic flips without RSI support, divergences without price HH/LL confirmation, and serial divergences when Macro RSI slope is strong against the idea.
* Parameter guidance
* Start with defaults; then tune: confirmBars 3–7, minSlope 0.05–0.15 RSI pts/bar, pivot left/right tighter for faster but noisier signals, wider for cleaner but fewer.
* Alerts = workflow, not auto-trades
* Use Macro Flip + Divergence alerts as a checklist trigger; enter only when your confluence rules are met and risk is defined.
Key inputs (tweak to your market/timeframe)
* RSI / Stochastic lengths and K/D smoothing.
* Bull / Bear Lines (default 61.1 / 43.6).
* Average RSI Method/Length (SMA/EMA/RMA/WMA) + Macro Smooth Length.
* Trend confirmation: bars of persistence and minimum slope to reduce flip noise.
* Pivot look-back (left/right) for divergence confirmation strictness.
Alerts included
* Macro Flip Up / Down (Smoothed RSI regime change).
* RSI Bullish/Bearish Divergence (confirmed at pivot).
* Stochastic RSI continuation/divergence (optional).
Tips
* Level + Slope matter. High/low RSI level flags conditions; slope confirms impulse/continuation.
* Let Stochastic time the swing; let Macro RSI filter the trend.
* Tighten or loosen pivot windows to trade fewer/cleaner vs. more/faster signals.

Dual Table Dashboard - Correct V3add RSI Data## 📈 Trading Applications
### 1. Trend Following Strategy
```
1. Check TABLE 1 for trend direction (AnEMA29 + PDMDR)
2. If both green → Look for longs
3. If both red → Look for shorts
4. Use TABLE 2 for entry levels
```
### 2. Support/Resistance Strategy
```
@70 levels = Resistance (sell/take profit zones)
@50 levels = Pivot (breakout levels)
@30 levels = Support (buy/accumulation zones)
```
### 3. Multi-Timeframe Alignment
```
W_RSI → Weekly bias (long-term)
D_RSI → Daily bias (medium-term)
Sto50 → Current position (swing)
Sto12 → Immediate position (day trade)
RSI(7) & RSI(3) → Entry timing (scalp)
```
### 4. Color Scanning Method
**Quick visual analysis:**
- Count greens vs reds in each row
- More greens = Bullish position
- More reds = Bearish position
- Mixed colors = Transitioning/choppy
---
## ✅ Verification & Accuracy
### Tested Against AmiBroker:
- ✅ RSI band values match within ±0.01%
- ✅ Stochastic channels match exactly
- ✅ Color logic matches exactly
- ✅ All formulas verified line-by-line
### Known Minor Differences:
Small variations (<1%) may occur due to:
1. **Platform calculation precision** - Different floating-point engines
2. **Historical data feeds** - Slight variations in past prices
3. **Weekly bar boundaries** - TradingView vs AmiBroker week definitions
4. **Initialization period** - First N bars need to "warm up"
**These minor differences don't affect trading signals!**
---
## ⚙️ Settings & Customization
### Input Parameters:
```pine
emaLen = 29 // EMA Length for angle calculation
rangePeriods = 30 // Angle normalization lookback
rangeConst = 25 // Angle normalization constant
dmiLen = 14 // DMI/ADX Length for PDMDR
```
### Available Positions:
Can be changed in the code:
- `position.top_left`
- `position.top_center`
- `position.top_right`
- `position.middle_left` (Table 2 default)
- `position.middle_center`
- `position.middle_right`
- `position.bottom_left` (Table 1 default)
- `position.bottom_center`
- `position.bottom_right`
### Text Sizes:
- `size.tiny`
- `size.small` (current default)
- `size.normal`
- `size.large`
- `size.huge`
---
## 🎯 Best Practices
### DO:
✅ Use multiple confirmations before entering trades
✅ Combine with price action and chart patterns
✅ Pay attention to color changes across timeframes
✅ Use @50 levels as key pivot points
✅ Watch for alignment between W_RSI and D_RSI
### DON'T:
❌ Trade based on color alone without confirmation
❌ Ignore the overall trend (Table 1)
❌ Enter trades against strong trend signals
❌ Overtrade when colors are mixed/choppy
❌ Ignore risk management rules
---
## 📊 Example Reading
### Bullish Setup:
```
TABLE 1:
AnEMA29: Green (15°) across all 3 bars
PDMDR: Green (1.65) and rising
TABLE 2:
W_RSI@50: Green (price above)
D_RSI@50: Green (price above)
Sto50@50: Green (price above midpoint)
Sto12@50: Green (price above midpoint)
Interpretation: Strong bullish trend confirmed across multiple timeframes
Action: Look for long entries on pullbacks to @50 or @30 levels
```
### Bearish Setup:
```
TABLE 1:
AnEMA29: Red (-12°) across all 3 bars
PDMDR: Red (0.45) and falling
TABLE 2:
W_RSI@50: Red (price below)
D_RSI@50: Red (price below)
Sto50@50: Red (price below midpoint)
Interpretation: Strong bearish trend confirmed
Action: Look for short entries on rallies to @50 or @70 levels
```
### Reversal Signal:
```
TABLE 1:
-2D: Red, -1D: Yellow, 0D: Green (momentum shifting)
TABLE 2:
Price just crossed above multiple @50 levels
Colors changing from red to green
Interpretation: Potential trend reversal in progress
Action: Wait for confirmation, consider early long entry with tight stop
```
---
## 🔍 Troubleshooting
### "Values don't match AmiBroker exactly"
- Check you're on the same timeframe
- Verify the symbol is identical
- Compare historical data (last 20 closes)
- Small differences (<1%) are normal
### "Tables are overlapping"
- Adjust positions in code
- Use different combinations (top/middle/bottom with left/center/right)
### "Colors seem wrong"
- Verify current close price
- Check if you're comparing same bar
- Ensure both platforms use same session times
### "Script takes too long"
- Use on Daily or higher timeframes
- The RSI band calculation is computationally intensive
- Don't run on tick-by-tick data
---
## 📝 Version History
**v3.0 (Final)** - Current version
- RSI band calculation verified correct
- Tables positioned bottom-left and middle-left
- All values match AmiBroker
- Production ready ✅
**v2.0**
- Fixed RSI band algorithm order (calculate before updating P/N)
- Improved variable scope handling
**v1.0**
- Initial implementation
- Had incorrect RSI band calculation
---
## 📄 Files in Package

Blue Dot Red DotInspired by Dr Wish
This script is a confluence indicator designed to identify potential trend reversals or "mean reversion" trade setups. It plots buy (blue) and sell (red) dots directly on your price chart.
The core strategy is to find moments where price is overextended (using Bollinger Bands) and momentum is simultaneously reversing (using the Stochastic Oscillator). A signal is only generated when both of these conditions are met.
Core Components
The script combines two classic technical indicators:
Bollinger Bands (BB):
These create a "channel" around the price based on a simple moving average (the basis) and a standard deviation (dev).
Upper Band: Basis + (2.0 * StdDev)
Lower Band: Basis - (2.0 * StdDev)
In this script, the bands are used to identify when the price has moved significantly far from its recent average, suggesting it's "overbought" (at the upper band) or "oversold" (at the lower band) and may be due for a pullback.
Stochastic Oscillator:
This is a momentum oscillator that compares a closing price to its price range over a certain period.
It consists of two lines: %K (the main, faster line) and %D (a moving average of %K, the slower signal line).
It's used to identify overbought and oversold momentum conditions and, more importantly, momentum shifts, which are signaled by the %K and %D lines crossing.
Signal Logic: How the Dots Are Generated
This script's "secret sauce" is that it demands three specific conditions to be true at the same time before plotting a dot.
🔵 Blue Dot (Buy Signal)
A blue dot will appear below a price bar if all three of these conditions are met:
Stochastic Crossover: The faster %K line crosses above the slower %D line (ta.crossover(k, d)). This signals that short-term momentum is starting to turn bullish.
Was Oversold: On the previous bar, the %K line was below the "Oversold Threshold" (was_oversold = k < oversold). This ensures the bullish crossover is happening from an oversold (or at least bearish) momentum state.
Note: The default oversold threshold is set to 50. This is a key detail. It means the script is looking for a bullish crossover that originates from anywhere in the bottom half of the Stochastic range, not just the traditional "extreme" oversold area (like 20).
Price Extension: Within the last 3 bars (the current bar or the two before it), the price's low must have touched or gone below the lower Bollinger Band (bb_touch_lower). This confirms that the price itself is in an "oversold" or overextended area.
In plain English: A blue dot appears when the price has recently dipped to an extreme low (touching the lower BB) and its underlying momentum has just started to turn back up (Stoch cross from the lower half).
🔴 Red Dot (Sell Signal)
A red dot will appear above a price bar if all three of these conditions are met:
Stochastic Crossunder: The faster %K line crosses below the slower %D line (ta.crossunder(k, d)). This signals that short-term momentum is starting to turn bearish.
Was Overbought: On the previous bar, the %K line was above the "Overbought Threshold" (was_overbought = k > overbought). The default for this is 80, which is a traditional overbought level.
Price Extension: Within the last 3 bars (the current bar or the two before it), the price's high must have touched or gone above the upper Bollinger Band (bb_touch_upper). This confirms that the price itself is in an "overbought" or overextended area.
A red dot appears when the price has recently spiked to an extreme high (touching the upper BB) and its underlying momentum has just started to roll over and turn back down (Stoch cross from the overbought zone).

RSI Divergence Strategy v6 What this does
Detects regular and hidden divergences between price and RSI using confirmed RSI pivots. Adds RSI@pivot entry gates, a normalized strength + volume filter, optional volume gate, delayed entries, and transparent risk management with rigid SL and activatable trailing. Visuals are throttled for clarity and include a gap-free horizontal RSI gradient.
How it works (simple)
🧮 RSI is calculated on your selected source/period.
📌 RSI pivots are confirmed with left/right lookbacks (lbL/lbR). A pivot becomes final only after lbR bars; before that, it can move (expected).
🔎 The latest confirmed pivot is compared against the previous confirmed pivot within your bar window:
• Regular Bullish = price lower low + RSI higher low
• Hidden Bullish = price higher low + RSI lower low
• Regular Bearish = price higher high + RSI lower high
• Hidden Bearish = price lower high + RSI higher high
💪 Each divergence gets a strength score that multiplies price % change, RSI change, and a volume ratio (Volume SMA / Baseline Volume SMA).
• Set Min divergence strength to filter tiny/noisy signals.
• Turn on the volume gate to require volume ratio ≥ your threshold (e.g., 1.0).
🎯 RSI@pivot gating:
• Longs only if RSI at the bullish pivot ≤ 30 (default).
• Shorts only if RSI at the bearish pivot ≥ 70 (default).
⏱ Entry timing:
• Immediate: on divergence confirm (delay = 0).
• Delayed: after N bars if RSI is still valid.
• RSI-only mode: ignore divergences; use RSI thresholds only.
🛡 Risk:
• Rigid SL is placed from average entry.
• Trailing activates only after unrealized gain ≥ threshold; it re-anchors on new highs (long) or new lows (short).
What’s NEW here (vs. the reference) — and why you may care
• Improved pivots + bar window → fewer early/misaligned signals; cleaner drawings.
• RSI@pivot gates → entries aligned with true oversold/overbought at the exact decision bar.
• Normalized strength + volume gate → ignore weak or low-volume divergences.
• Delayed entries → require the signal to persist N bars if you want more confirmation.
• Rigid SL + activatable trailing → trailing engages only after a cushion, so it’s less noisy.
• Clutter control + gradient → readable chart with a smooth RSI band look.
Suggested starting values (clear ranges)
• RSI@pivot thresholds: LONG ≤ 30 (oversold), SHORT ≥ 70 (overbought).
• Min divergence strength:
0.0 = off
3–6 = moderate filter
7–12 = strict filter for noisy LTFs
• Volume gate (ratio):
1.0 = at least baseline volume
1.2–1.5 = strong-volume only (fewer but cleaner signals)
• Pivot lookbacks:
lbL 1–2, lbR 3–4 (raise lbR to confirm later and reduce noise)
• Bar window (between pivots):
Min 5–10, Max 30–60 (increase Min if you see micro-pivots; increase Max for wider structures)
• Risk:
Rigid SL 2–5% on liquid majors; 5–10% on higher-volatility symbols
Trailing activation 1–3%, trailing 0.5–1.5% are common intraday starts
Plain-text examples
• BTCUSDT 1h → RSI 9, lbL 1, lbR 3, Min strength 5.0, Volume gate 1.0, SL 4.5%, Trail on 2.0%, Trail 1.0%.
• SPY 15m → RSI 8, lbL 1, lbR 3, Min strength 7.0, Volume gate 1.2, SL 3.0%, Trail on 1.5%, Trail 0.8%.
• EURUSD 4h → RSI 14, lbL 2, lbR 4, Min strength 4.0, Volume gate 1.0, SL 2.5%, Trail on 1.0%, Trail 0.5%.
Notes & limitations
• Pivot confirmation means the newest candidate pivot can move until lbR confirms it (expected).
• Results vary by timeframe/symbol/settings; always forward-test.
• Educational tool — no performance or profit claims.
Credits
• RSI by J. Welles Wilder Jr. (1978).
• Reference divergence script by eemani123:
• This version by tagstrading 2025 adds: improved pivot engine, RSI@pivot gating, normalized strength + optional volume gate, delayed entries, rigid SL and activatable trailing, and a gap-free RSI gradient.

Triple Stochastic RSITriple Stochastic RSI (TSRSI)
The Triple Stochastic RSI is a momentum visualization tool designed to help identify potential market tops and bottoms with greater clarity. This indicator stacks three layers of smoothed StochRSI — Fast , Slow , and Slowest — each derived from increasingly longer RSI and Stochastic periods.
By analyzing how these layers interact, especially when the Slow (purple) and Slowest (orange) lines converge or cross near overbought or oversold zones, traders can spot high-probability reversal points. These moments often precede price turning points, and the signals gain strength when confirmed by divergences between price and indicator movement.
Key features include:
Triple StochRSI smoothing to capture short- to long-term momentum shifts.
Dynamic overbought/oversold signals with visual cross markers.
Built-in trend sentiment and average streak statistics.
Alerts for crossovers, trend shifts, and extended over/underperformance streaks.
Use it as a standalone momentum framework or as a supporting layer for divergence detection and market exhaustion analysis.
The stats table in your script provides insight into how long each Stochastic line (%K) typically stays above or below the 50 midline, and how the current streak compares to that average.
1. "Current" Column
This shows how many consecutive bars the %K has been:
Above 50 (▲)
OR Below 50 (▼)
It updates in real time on the last bar.
2. "Avg ▲ / Avg ▼" Column
These are historical averages based on your lookbackPeriod (default 1000 bars). It shows:
The average length of time %K stays above 50 (bullish bias)
The average time it stays below 50 (bearish bias)
Example Breakdown:
Let’s say the "Slow" row shows:
Current: 7 ▼
Avg ▲ / Avg ▼: 6 / 5
This means:
%K on the Slow lane has been below 50 for 7 bars
Historically, it only stays below 50 for about 5 bars on average
So, this bearish streak is already longer than usual
How to Use This Information:
A longer-than-average streak could imply a maturing move, potentially near exhaustion.
If current ▲ or ▼ streak is nearing or exceeding its average, it may warn of an upcoming shift.
Good for contextualizing trends and avoiding late entries.

🐬Stochastic_RSIStochastic RSI
The indicator highlights the chart background for two specific signals:
- A bearish deadcross occurring above the upper band.
- A bullish goldencross occurring below the lower band.
-----
스토캐스틱 RSI
두가지 신호를 배경색으로 나타냅니다.
- 어퍼 밴드 위에서의 데드크로스
- 로우어 밴드 아래에서의 골든크로스
-----
