Indikator Pine Script®
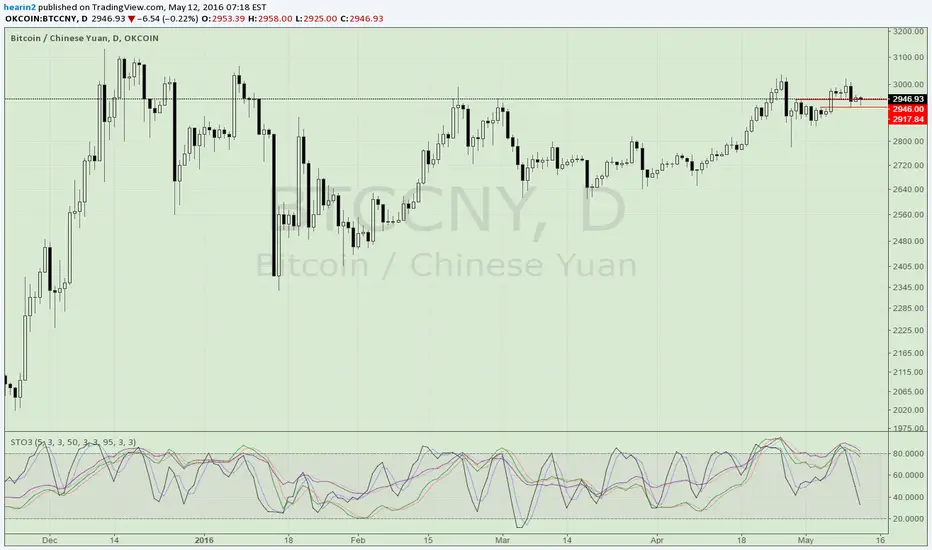
Osilator Stochastic

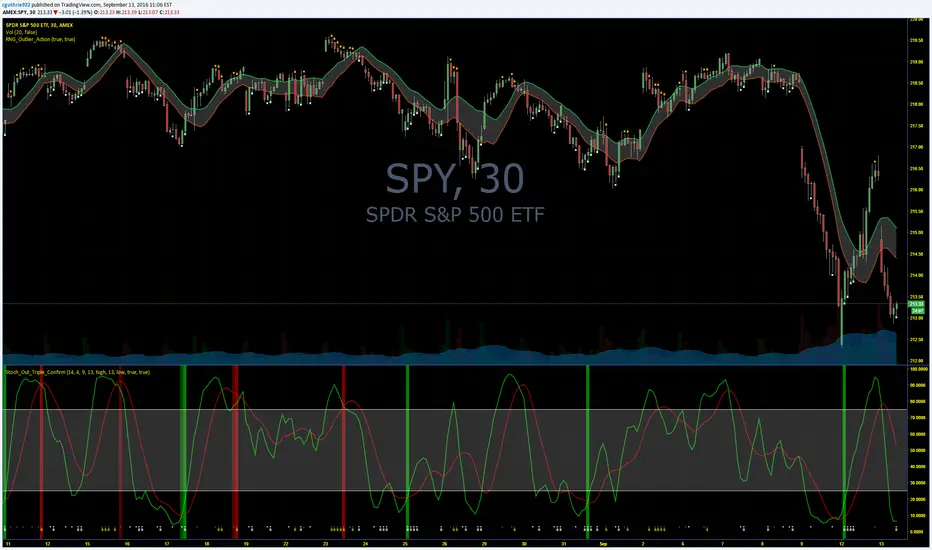
Guth_3X_ConfirmThis indicator has three built in indicators based on the SMA of HIGH, SMA of LOW, and Stochastic. The baseline indicator is the retreats after departures from SMA of HIGH and LOW.
The first time a HIGH that is above the SMA HIGH has a lower HIGH but it still above the SMA HIGH, a (-) will appear at the bottom. This signals an aggressive entry point for potential coming downtrend. The second time the HIGH produces a lower high but is still above the SMA HIGH, a (S) will appear at the bottom which signals a more conservative entry point for potential coming downtrend. All of the opposite information is true of reversals beyond the SMA LOW.
When these reversals appear the same time the Stochastic is overbought or oversold, a red bar (overbought and potentially coming down) or a green bar (oversold and potentially coming up) will appear. NOTE: Aggressive symbols occur more often and will always occur when a conservative symbol appears. When a conservative indicator and respective overbought/oversold level occur at the same time, the bar is darker in color.
You can enter positions at any one of the indicators, however, the darker bars are what I look for. This has a high success rate but cannot guarantee results every time. I recommend adjusting the SMA, and Stoch parameters as well as time periods. I have had success with this indicator while day trading the 5, 10, 15, 30, 65 minute periods as well as daily and weekly periods. Every symbol traded can provide differing results based on the parameters used.
Please feel free to leave feedback and I know this can work well for you!
Indikator Pine Script®
Stochastic Momentum Index (SMI)Stochastic Momentum Index (SMI) or Stoch MTM is used to find oversold and overbought zones. It also helps to figureout whether to enter short trade or long trade.
Red Shade in the Top indicates that the stock is oversold and the Green shade in the bottom indicates overbought.
Strategy:
Enter Long once the Overbought Zone ended and there's a crossover below -35.
Exit Long once the oversold zone is ended and there's a crossover.
Enter Short once the oversold zone is ended and there's a crossover above 35.
Exit Short once the Overbought Zone ended and there's a crossover.
Backup: Always use with another indicator because there will be multiple up and down movement in one Trend.
Indikator Pine Script®

MTF Stochastic CCI ALERTWorks good on 5 or 15min set to the 2hr or 4hr time frame.
Set an alarm (Set an alert on each Long/Short "crossing down", 0.8 (or anything below 0.99), "on condition" )
Or just as a visual.
Best to use other factors to confirm but most of the time it does a pretty decent job.
Indikator Pine Script®
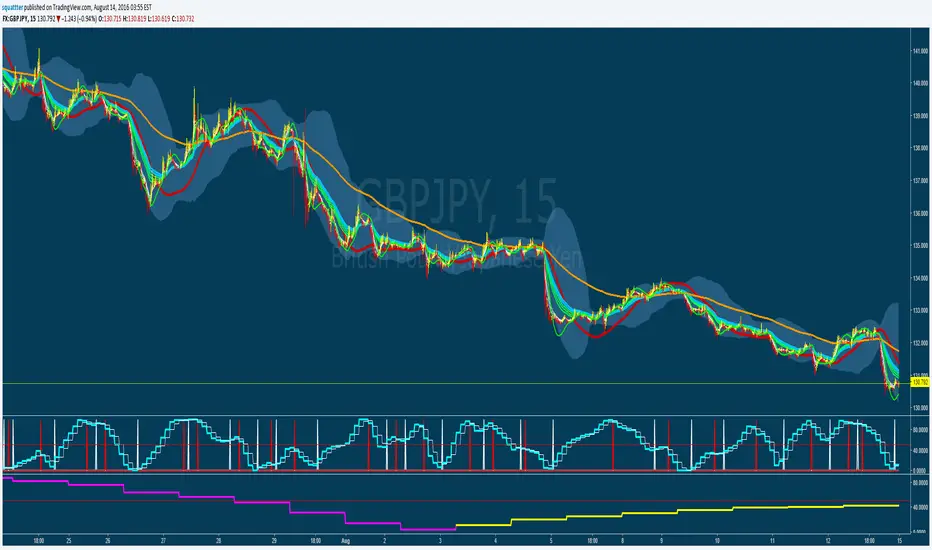
Stochastic RSI - MTF - Up/down colours - 4hr default - squattterStochastic RSI - MTF - Up/down colours - 4hr (240) default
Indikator Pine Script®
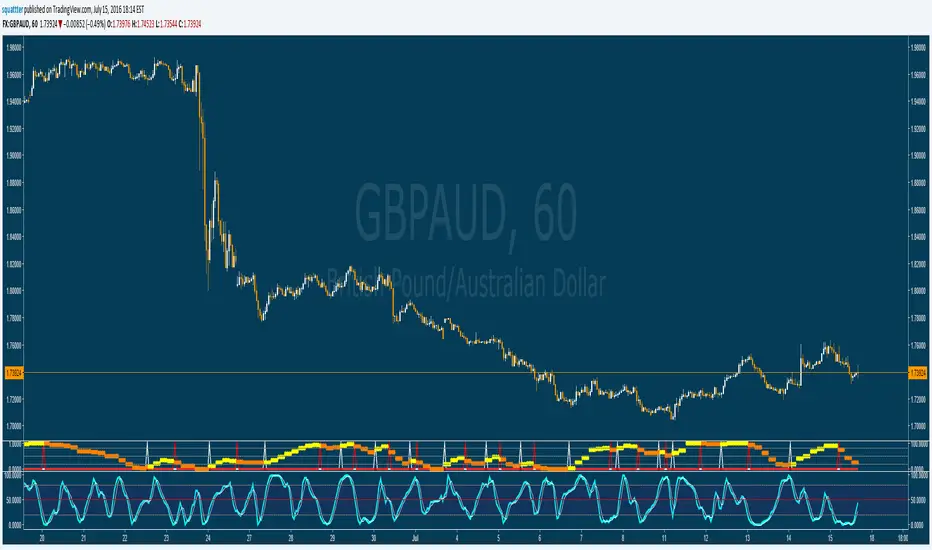
Stochastic CCI MTF w/ UP/DOWN colours - squattterStoch CCI has a nicer divergence than Stoch RSI.
Enjoy!
Indikator Pine Script®
Stochastic CCI MTF w/ UP/DOWN colours - squattterStoch CCI has nicer divergences than Stoch RSI.
Enjoy.
Indikator Pine Script®

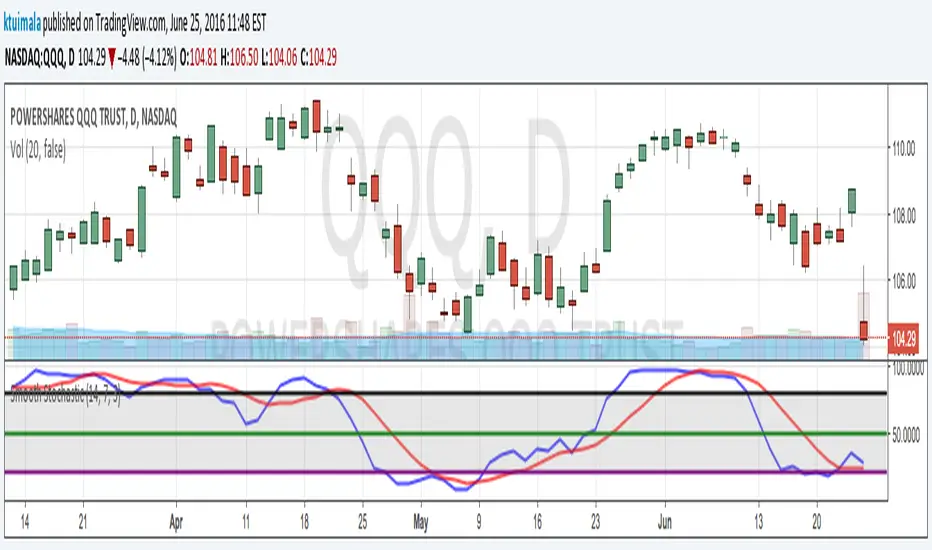
KT_Smooth_StochasticI normally don't publish my indicators. However, I couldn't find a smoothed stochastic on TradingView officially or unofficially. This is a standard implementation of a smoothed Fast Stochastic where %K and %D are calculated and then smoothed by n periods. This helps to reduce chop and gives better extreme signals.
I have defaulted the indicator to use commonly used settings where %K is over 14 periods, %D is over 7 period, and the smoothing factor is 3 periods. I have also defaulted the extreme lines to an upper band of 80, mid band of 50, and lower band of 20. However, my favorite settings are %K = 10, %D = 10, Smooth = 3, upper band = 75, mid band = 50, and lower band = 25.
Indikator Pine Script®
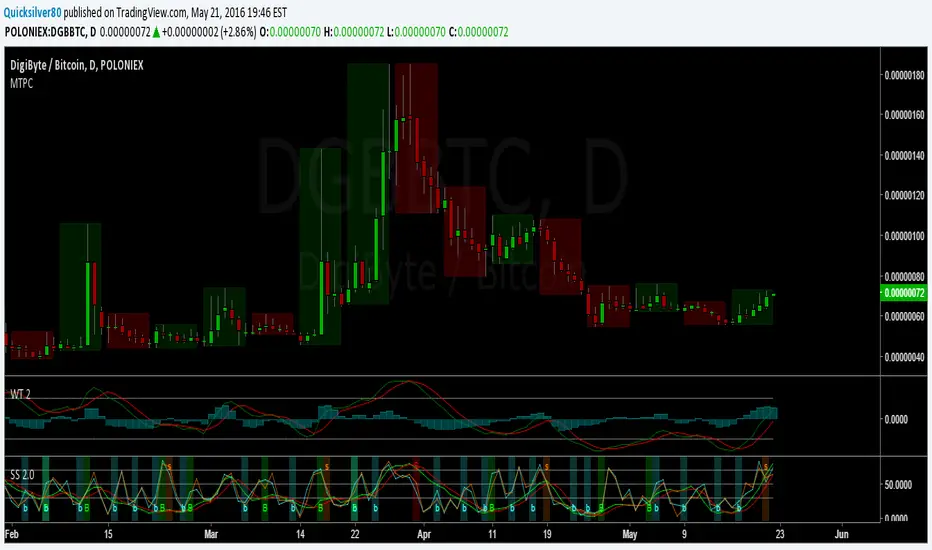
Sniper Stochastics 2 Sniper Stochastics 2 is like the other one - a triple stochastics consisting of different lengths, in this case 55,89,144.
One thing I noticed was that the stochastics lines can be a kind of divergence detector with the slow (red), medium (blue) and fast(black) lines making breakaways once they converge.
For example, if the lines are together and the black line starts to diverge upwards, it means that there is a positive divergence which will happen quickly and then end. The blue and the red lines are longer term divergences.
I wanted to share this one and the unique and interesting use of divergences with this indicator.
Indikator Pine Script®
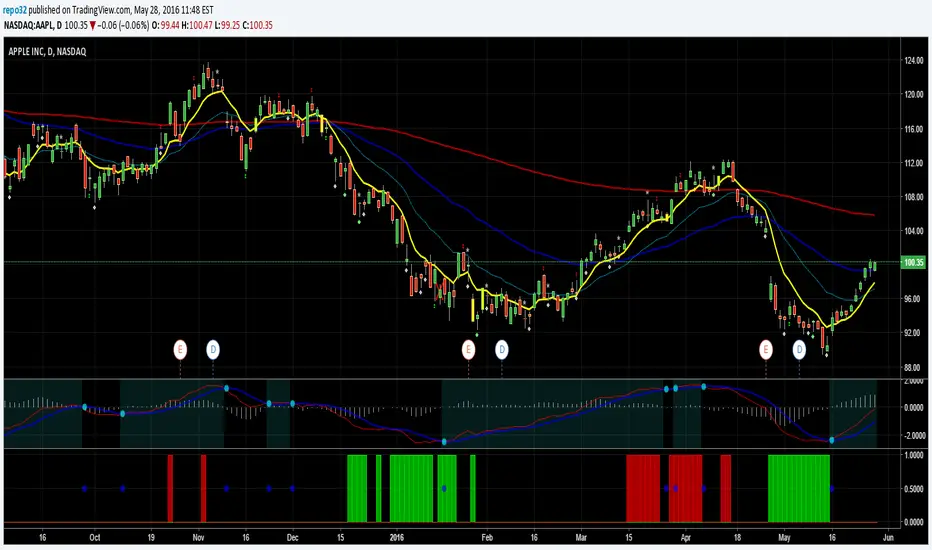
Rob RSI Stoch MACD Combo Alert//Created by Robert Nance on 5/28/16. Additional credit to vdubus.
//This was a special request from rich15stan. It combines my original RSI Stoch extremes with vdubus’ MACD VXI.
//This script will give you red or green columns as an indication for oversold/overbought,
//based upon the rsi and stochastic both being at certain levels. The default oversold is at 35.
//If Stochastic and RSI fall below 35, you will get a green column. Play with your levels to see how
//your stock reacts. It now adds the MACD crossover, plotted as a blue circle.
Indikator Pine Script®
Super StochSuper Stoch Update
// Short Name Changed To "SS 3.0"
// Added a third StochRSI.
// Default resolutions S1= W, S2= D, S3= 240 (4H)
// Signal function for all StochRSI's.
// Made a Variety of Cosmetic Changes
Indikator Pine Script®

Super StochAdded signal functionality to StochRSI 2
Set Default Resolution of StochRSI 1 to "D" and StochRSI 2 to "240"
Indikator Pine Script®
Stochastic HistogramLast Edited: 5/19/16
Description:
This is a basic Stochastic histogram that essentially shows when the indicator
is either above or below the 50 level. Colors can be customized to your liking.
Length and smoothing factor can be adjusted as well. Defaults are 14 (Length)
and 3 (Smoothing Factor).
NOTE: The above chart contains the built-in stochastic indicator for comparison.
Indikator Pine Script®

Stochastic Weighted Average for use on H1A weighted average of Hourly, Daily, Weekly and Monthly Stochastic.
Indikator Pine Script®

Indikator Pine Script®
SMI BarsUses SMI (Stochastic Momentum Index) to set bar colors:
When SMI above overbought, bar color is red.
When SMI is between 0 and overbought, bar color is maroon
When SMI is between oversold and 0, bar color is green
When SMI is below oversold, bar color is lime.
When SMI crosses above or below 0, bar color is orange.
Indikator Pine Script®

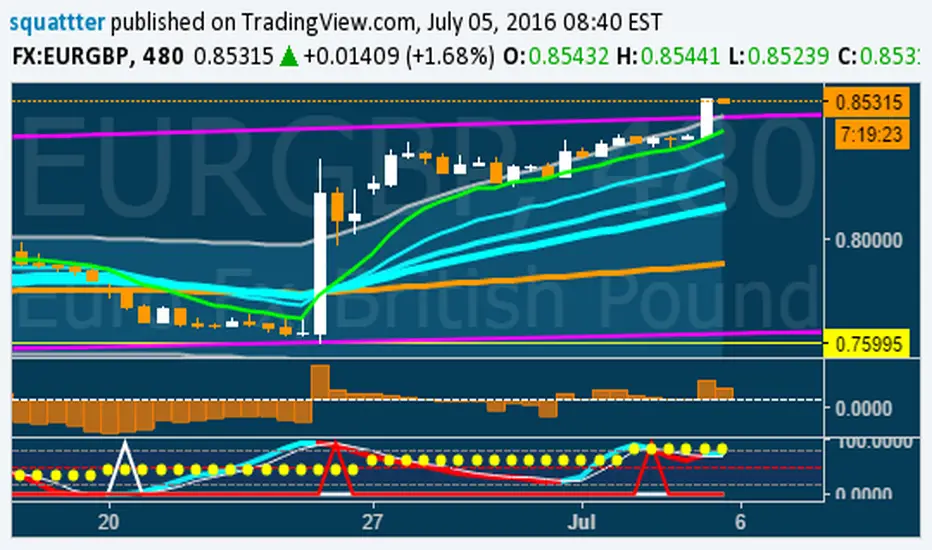
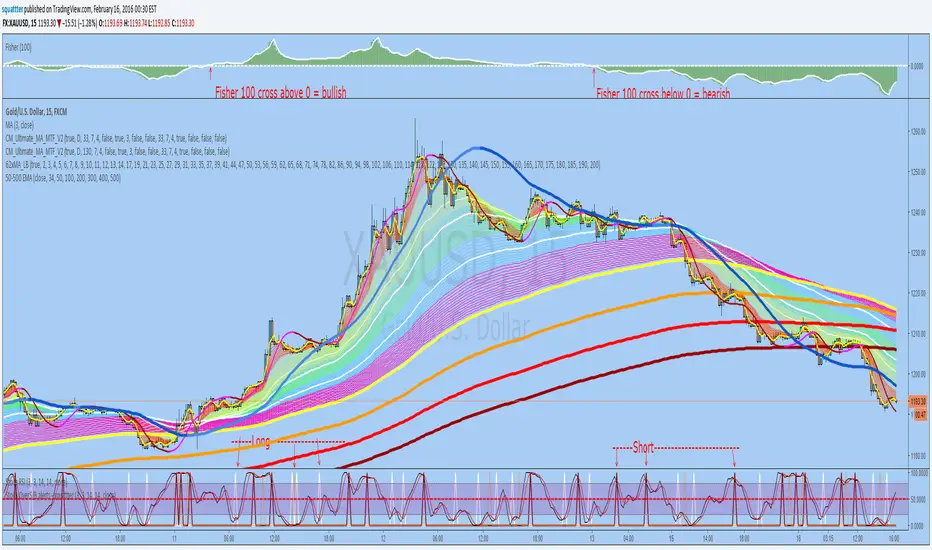
StochRSI overSold/Bought alerts - by squattterDepending on the new trend - Fisher 100 crossing 0;
Set an alert on each Long/Short "crossing down", 0.8 (or anything below 0.99), "on condition"
Indikator Pine Script®
Indikator Pine Script®

Indikator Pine Script®

Stochastic In BandsWhat about to display Stochastic Oscilator in EMA-ATR Bands? If you like the idea I would code advanced version
Indikator Pine Script®

Indikator Pine Script®

Jinqian168_V2RSI, EMA of RSI, EMA of RSI's EMA, and Stochastic.
V2 added Price Bar Coloring. Buy when Orange or Green, Sell when Yellow or Red.
Indikator Pine Script®

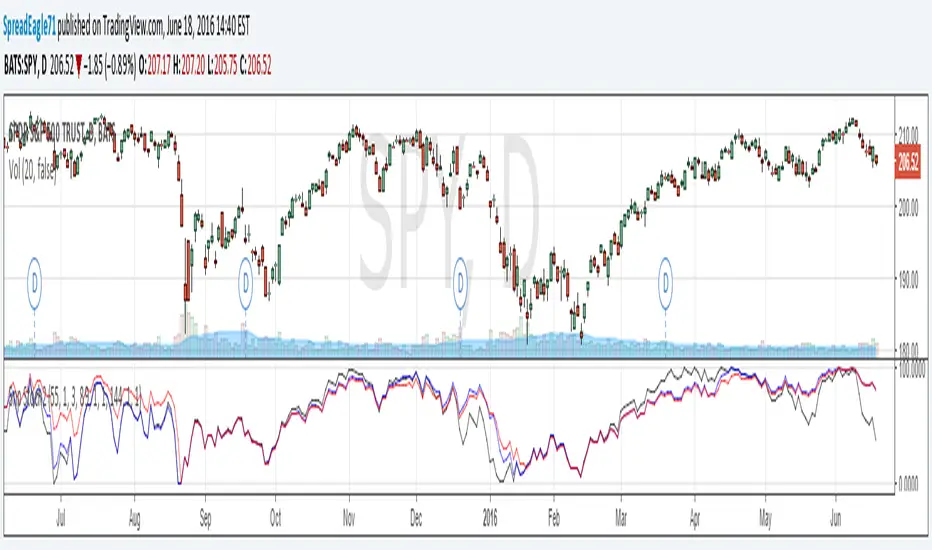
Sniper Stochastics Sniper Stochastics is a triple stochastic system.
Basically, watch the 20 and 80 crossovers. However, the settings of the three stochastics correspond to Fibonacci numbers 55, 89, and 144.
Since we have a fast, medium and slow speed stochastics; we can also watch the crossovers.
I have found that When the Red (144) is on top, it usually signals a turn upwards; conversely, a blue (89) on top of the others means that the market is going to go down.
So red on top = bullish and blue on top= bearish.
You can also think of them in terms of efficiency. If they all display the same and are overlapping in a single line; crossing an 80 or 20 line, this is a strong signal - bullish or bearish.
If on the other hand, you see them splayed out and moving away from eachother but the same direction; it signals a more inefficient process and thus a weaker signal.
I really enjoy using these and I hope you will too.
On the settings, I have turned off the %D so that they display only %K's. The Default is 55, 89 ,144.
Indikator Pine Script®
