Schaff Trend CycleThis indicator was originally developed by Doug Schaff in the 1990s (published in 2008).Indikator Pine Script®oleh evergetDiupdate 4545 4.3 K
Stochastic (public) by mnazrizversion 1.0 Green when a) K line cross up Oversold line b) K line meet D line Red when a) K line cross down Overbought line b) D line meet K lineIndikator Pine Script®oleh mnazriz21
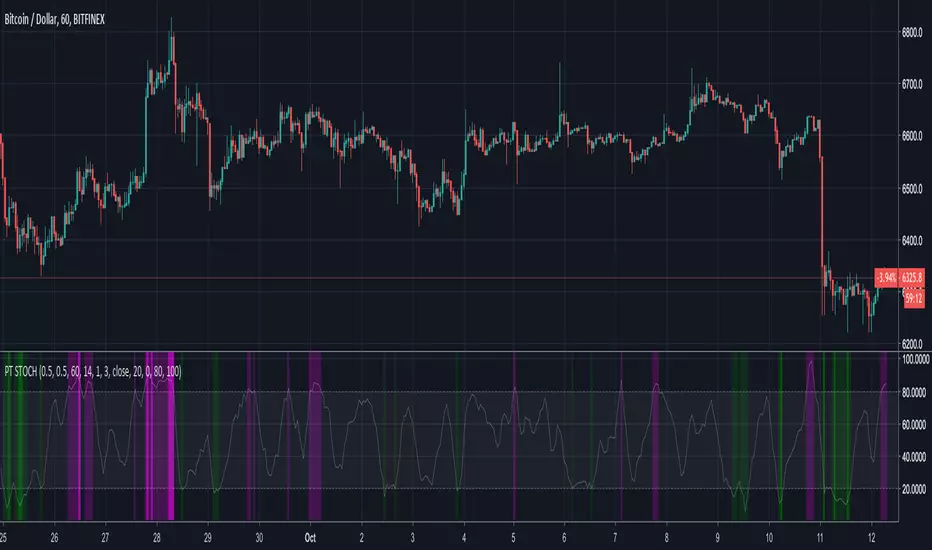
RSI / Stoch / SRSI / MFI / Aroon Overlay [SigmaDraconis]Combines 4 popular indicators (RSI, Stoch, SRSI, MFI) and 1 peculiar one (Aroon) in 1 for those who want to save indicators but not only. This is an evolution of my (simpler) "RSI / Stoch / Stoch RSI (SRSI) Overlay " that you can find on my scripts. Added bands for oversold/overbought areas (70/30 common for RSI and 80/20 for SRSI and MFI), as well as a middle 50 horizontal line. Neutral bands around 55-45 added as well that can be hidden for less clutter. I also recommend a more transparent coloring for these since Pine script doesn't allow default transparency for horizontal lines. By default only RSI and Stoch are activated, you can activate Aroon, MFI and SRSI on the inputs window. Some extra notes: * RSI, Stoch and MFI can help to strengthen one's decision as well as Aroon to predict a possible trend reversal, SRSI can show when RSI has high probability of being topped or bottomed when oversold/overbought but don't forget to look at volume and how the trend progresses that can keep SRSI above 80 or below 20 while RSI and price continues to trend, divergences are most helpful here to find possible reversal areas. * This chart depicts some interesting divergences, as well as Stoch tops and bottoms and confluences between RSI/MFI and Stoch on some over-extended tops and bottoms that shown being good reversal zones. RSI resistances are shown as well, failing to break above 60 or the neutral zone (this is a bearish BTC trend chart after all) or failing to gain support to break up certain levels (RSI notes a more bullish trend when consistently above 60 and more bearish below 40). If you like it and use it to profit, please tip me below :) Tip jars: BTC: 15nMBiEGVrdGcu9C1h6QRcTNRvugHkqrMQ ETH: 0xC33845946c48B61fBCbEA0367ec2238CaF2b73bc BTS: sigma-draconis Indikator Pine Script®oleh SigmaDraconis3737 3 K
Inside Bar Alert I need help!!! I created the alert but it triggering during the formation not once it has printed. Does anyone know who to make it trigger the alert once the inside bar is complete and make it plot an arrow when the inside bar has formed? Indikator Pine Script®oleh RealPipPusher1159
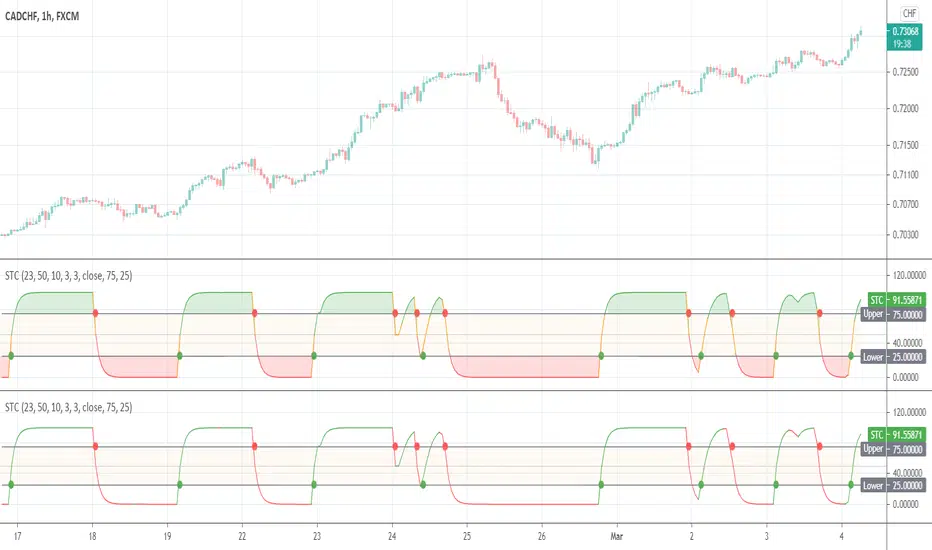
[ProfitTrailer] Stoch StudyProfitTrailer buy/sell study for STOCH strategy. The script highlights the regions where trailing is most likely to succeed.Indikator Pine Script®oleh abashinfection32
DiNapoli Bundle Oscillators 3-in-1DiNapoli Oscillators 3-in-1 is a Bundle that includes the 3 oscillators used by DiNapoli in just 1 single indicator : DiNapoli MACD (Dema) DiNapoli Preferred Stochastic DiNapoli Detrended Oscillator (DOSC) This Bundle version includes the following features : Ability to select which Oscillator to plot: MACD, Stochastic or Detrended Show/Hide the Oscillation Lines Show Crosses with Signal Line Add a label to each oscillator for ease of identification Adapt OB/OS Factor Ratio to each Market Show OB/OS Levels Show Preceding OB/OS Cloud Show Divergences (experimental) For convenience it also includes Custom Alerts . Now it is possible to get alerts on: Oscillator Cross Bullish Oscillator Cross Bearish Oscillator Cross OverBought Condition Entering OverBought Condition Exiting OverBought Condition OverSold Condition Entering OverSold Condition Exiting OverSold Condition Possible Regular Divergence Possible Regular Bullish Divergence Possible Regular Bearish Divergence This indicator is meant to be used by professional traders. If you would like to subscribe , please send me a private message.Indikator Pine Script®oleh gliderfundDiupdate 32
DiNapoli Preferred StochasticDiNapoli Preferred Stochastic is a custom indicator used in the context of identifying the position of weak hands. This version of the indicator includes the following features : Show/Hide the Oscillation Lines Highlight OB/OS Condition Highlight Cross with Signal Line Show Divergences (experimental) For convenience it also includes Custom Alerts . Now it is possible to get alerts on: Alert on Stochastic Cycle Bullish Stochastic Signal Bearish Stochastic Signal Possible Regular Divergence Possible Regular Bullish Divergence Possible Regular Bearish Divergence This indicator is meant to be used by professional traders. If you would like to subscribe, please send me a private message.Indikator Pine Script®oleh gliderfundDiupdate 1152
Ultimate Strength Index (USI),Stoch Multi Time Frame(MTF)[cI8DH]Ultimate Strength Index ( USI ) adds stochastic, multi time frame, signal line, histogram, and bar coloring options to RSI and Absolute Strength Index ( ASI ) . It can also turn into an indicator similar to Awesome Oscillator/MACD line. This indicator can be used for analyzing momentum and trendiness/choppiness, as well as identifying swings (stoch). The fix applied in True RSI is also applied here. Chart below shows example multi-TF setup with bar coloring. For analyzing volume, I made a similar indicator based on money flow and accumulation/distribution, which you can find in the link below. Aggregation Method aggregation method = MA Percent => True RSI: momentum and divergence, failure swings aggregation method = MA => Absolute Strength Index: accurate momentum and divergence aggregation method = Cumulative => Awesome Oscillator alternative : momentum and divergence, twin peaks, ... (set the smoothing to 5 and signal length to 29ish) Smoothing, signal line and histogram to detect trend and choppiness You can apply additional smoothing to USI . Also, you can add a signal line and histogram (histogram is the difference between main line and signal line). To do so, set the signal length to a number greater than one. Signal line can help you detect changes in trend similar to the signal line on MACD. If signal line criss-crosses USI , it shows market is choppy. The worst case is when this criss-crossing coincides with USI flattening near neutral line and histogram height is relatively short; that means market is ded (until it is not; expansion following a contraction period is a common phenomena)! (Bear in mind that histogram will be hidden in stoch mode, and main and signal lines will be hidden in cumulative mode) Stochastic To enable stoch, change the stoch length to a number greater than 1 (default stoch length for the built-in RSI stoch is 14). This length should be calibrated depending on TF and asset. If done correctly, it can be a powerful tool for identifying swings. Stoch can be combined with any aggregation method. I recommend using stoch with MA aggregation (i.e. ASI ). For conventional uses of stochastic, please read www.tradingview.com(STOCH) and www.tradingview.com(STOCH_RSI). Experimental Bar coloring Feature There is an option to color bars depending on USI's position relative to the signal line. If both TFs are used in coloring and they are in disagreement, the TF with greater histogram height wins. There are two shades of green and red. The darker shade means both TFs agree. If you use the signal line, bar coloring can help with calibrating the indicator (play with parameters until you see a good looking chart i.e. a lot of green candles followed by a lot of red candles in a row). Please note that bar colors might change until candle(s) close(s). The bar coloring rules will most likely change in the future. Notes - Smooth MA length N = EMA length 2*N-1 - With correct settings, you can also create an alternative to normalized MACD line in the cumulative mode. True RSI Absolute Strength Index Please give a like, and share the interesting configurations you find in the comments.Indikator Pine Script®oleh cI8DHDiupdate 1313383
My Script with stoch and bb I created a script to buy / sell when stoch oversold, overbought and BB when the price is above the upper BB and falls below it. I want to combine with rsi but I do not know how to do it and I want to put SL to avoid the trap of market. Do you have any way to help me optimize the scirpt?Indikator Pine Script®oleh linhvn1235525
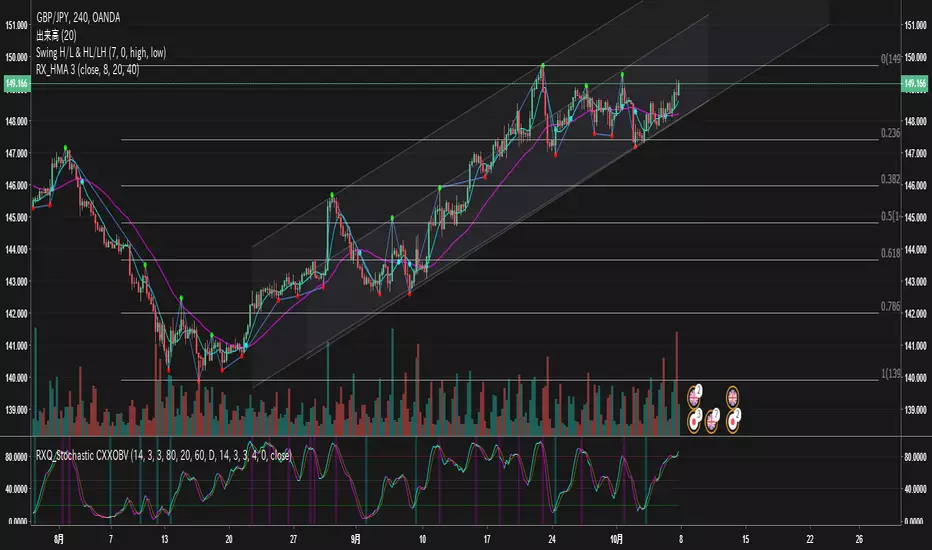
ManuB76 - Multiple stochastic indicatorOne of my preferred indicatorsIndikator Pine Script®oleh Manu76Diupdate 22146
Stochastic MomentumStochastic Momentum adds shorter and longer term Stochastic movements on the same chart to indicate relative momentum for short and slightly longer term outlooks. Can be used like a regular Stochastic indicator for overbought / oversold levels, divergence and additionally also the crossing of the shorter (blue) and longer (orange) levels. It is a leading indicator and often signals early moves of momentum, which may or may not translate into the same price movements. Indikator Pine Script®oleh EasyTradingSignals11156
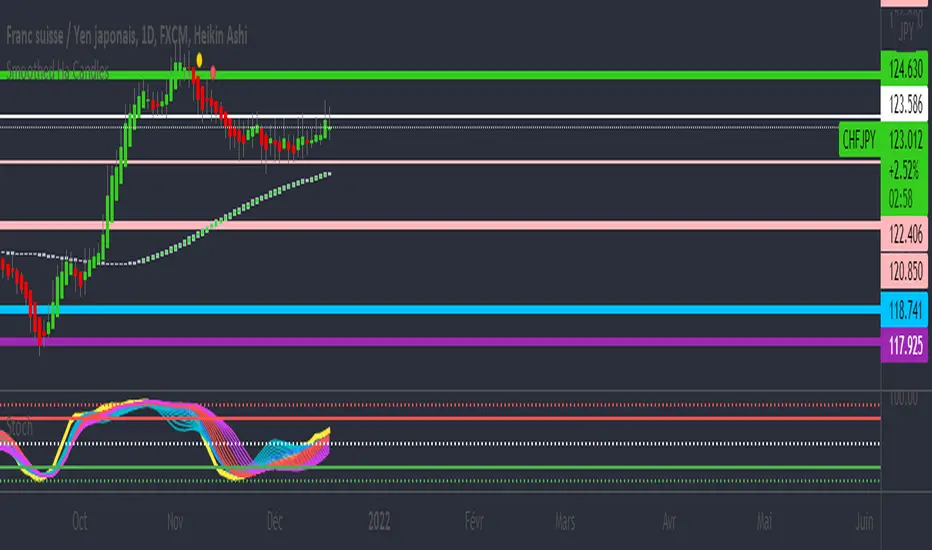
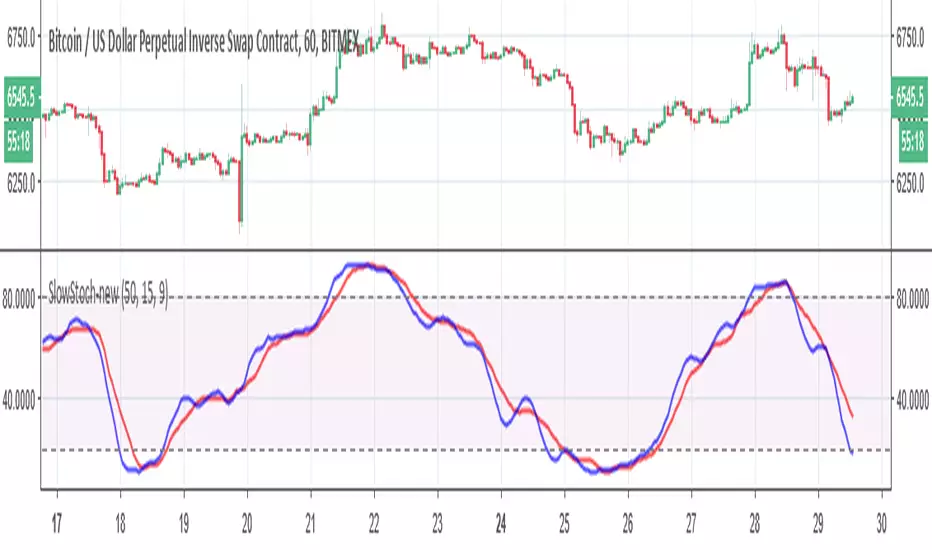
Slow Stochastic-newnothing fancy here, just some modification to the old stoch to make it more realistic Indikator Pine Script®oleh RafaelZioni33363
Multi Period Stochastic2 period stochastic with some pretty coloring below 20 and above 80Indikator Pine Script®oleh Wayne-oDiupdate 32
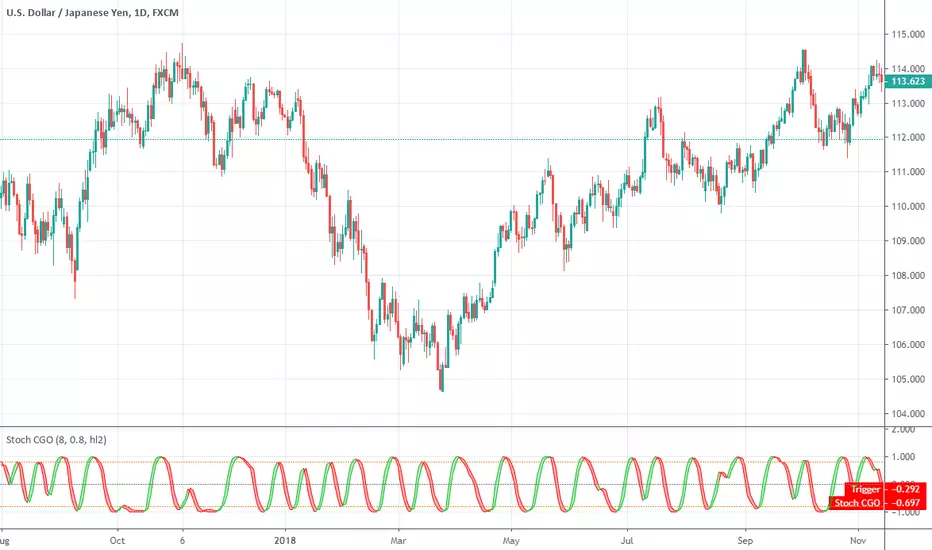
Stochastic CG Oscillator (Center of Gravity)Stochastic CG Oscillator (Center of Gravity) script. This indicator was originally developed by John F. Ehlers (see his book `Cybernetic Analysis for Stocks and Futures`, Chapter 8: `Stochasticization and Fisherization of Indicators`).Indikator Pine Script®oleh evergetDiupdate 44426
Stochastics && Money FlowSimple and conceivable implementation of Stochastics and Money Flow in one Indicator chart. Buying and selling points are visualised by dots.Indikator Pine Script®oleh brazo581Diupdate 889
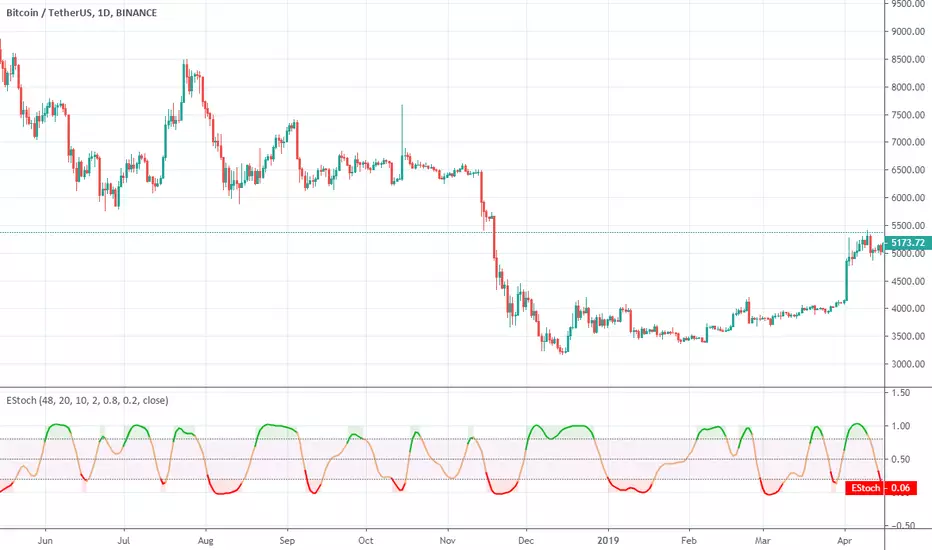
Ehlers StochasticEhlers Stochastic script. This indicator was originally developed by John F. Ehlers (Stocks & Commodities V. 32:1: Predictive And Successful Indicators).Indikator Pine Script®oleh evergetDiupdate 11391
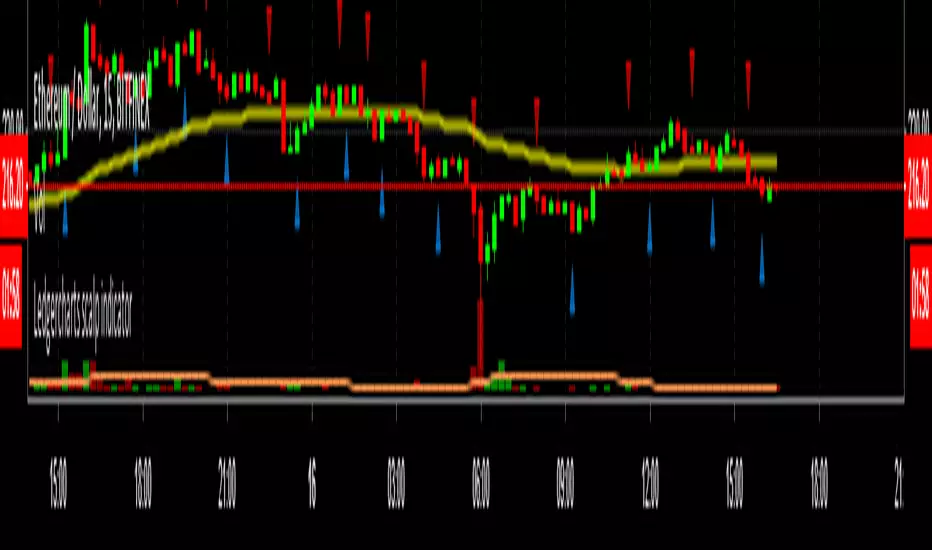
Ledgercharts scalp indicatorI'm using this indicator for finding scalp opportunities with high volume crypto coins. To be used in combination with support & resistance levels and/or other indicators. Works best on a 15-minute timeframe. DISCLAIMER: This script is not intended as financial advice and is for educational purposes only. Do your own research by verifying the accuracy of the information and know that your decisions are your own.Indikator Pine Script®oleh ledgerchartsDiupdate 7714
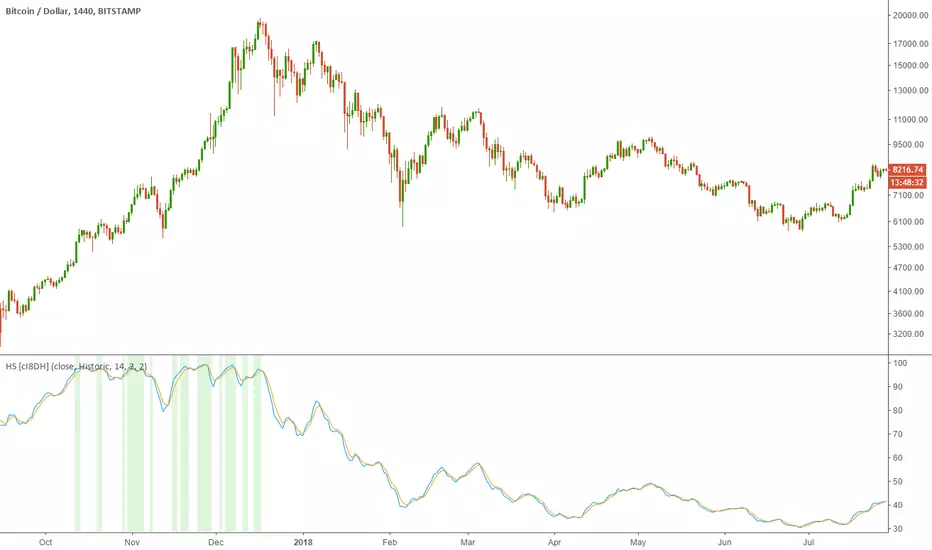
Historical Stochatic (HS) [cI8DH]This indicator calculates historical stochastic (HS). It also includes the standard stoch. HS works similar to the standard stochastic . The difference is that the standard stochastic has a set look-back period, while HS looks as far back as the first bar. This allows identifying ATHs and ATLs (background highlights green and red respectively). Basically, HS shows inverse retracement from ATL to ATH in percentage. This indicator works best on non-range bound indicators such as MACD. As you can see in the chart below, MACD is not useful to compare against periods that price is wildly different. Applying HS on MACD fixes this issue (To achieve the same results, add MACD indicator > change the source to MACD on HS settings > since MACD is a smoothed indicator, smoothing length is set to 1. To get similar smoothing length on the signal as in standard MACD, set %D to 5 smoothed MA which is equivalent to 9 EMA smoothing on standard MACD). Gain/Loss Moving Average (GLMA) is another indicator that can benefit well from HS. GLMA is the simplest and probably the most accurate momentum indicator. But it is not as convenient as RSI since it is not range bound. HS can make it range bound without compromising its accuracy. (To achieve the same results, add GLMA indicator > change the source to GLMA on HS settings > set %K length to 1). Chart below shows HS applied to Accumulation/Distribution Money Flow (ADMF) and compares it against its range bound counter part, ADP. Conclusion: There are different ways of making an indicator normalized or range bound. Some indicators use RSI's approach (positive changes MA / all changes MA) such as MFI, CMF, ADP. This approach is great but the divergence near extremes can sometimes be misleading. HS fixes this problem as long as the indicator is not making a new ATH or ATL . When it does make new ATH or ATL , this indicator gives a warning to avoid using it for detecting divergence. PS: It is a bit geeky to apply HS on other indicators. I will publish some of my indicators with HS and standard stoch built-in. So stay tuned if u r interested in this indicator. Read more here about using stochastic www.tradingview.com(STOCH)Indikator Pine Script®oleh cI8DH66175