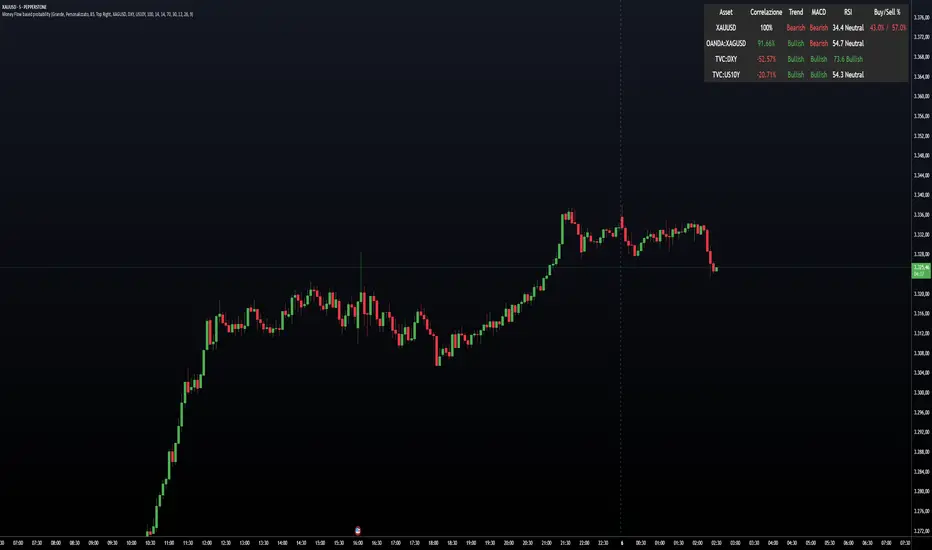
CorrelationMulti-Timeframe Correlation Indicator
This Pine Script indicator measures the correlation between the current symbol and a reference symbol (default: GLD) across three different timeframes. It provides traders with valuable insights into how assets move in relation to each other over short, medium, and long-term periods.
Key Features
Multiple Timeframe Analysis: Calculates correlation coefficients over three customizable periods (default: 20, 50, and 200 bars)
Visual Reference Lines: Displays horizontal lines at +1, 0, and -1 to indicate perfect positive correlation, no correlation, and perfect negative correlation
Color-Coded Outputs: Shows short-term correlation in green, medium-term in yellow, and long-term in red for easy visual interpretation
Understanding Correlation
The correlation coefficient measures the statistical relationship between two data series, ranging from -1 to +1:
+1: Perfect positive correlation (both assets move together in the same direction)
0: No correlation (movements are random and independent)
-1: Perfect negative correlation (assets move in opposite directions)
How To Use This Indicator
Market Relationships: Identify how strongly your current asset correlates with the reference symbol
Diversification Analysis: Find assets with negative correlations to build a diversified portfolio
Divergence Opportunities: Watch for changes in correlation patterns that might signal trading opportunities
Trend Confirmation: Use correlation with benchmark assets to confirm broader market trends
Customization Options
Reference Symbol: Change the default GLD to any other symbol you want to compare against
Period Lengths: Adjust the short, medium, and long timeframes to match your trading strategy and timeframe
This indicator helps traders make more informed decisions by understanding the interrelationships between different assets across various timeframes, potentially improving portfolio construction and risk management strategies.
Indikator Pine Script®