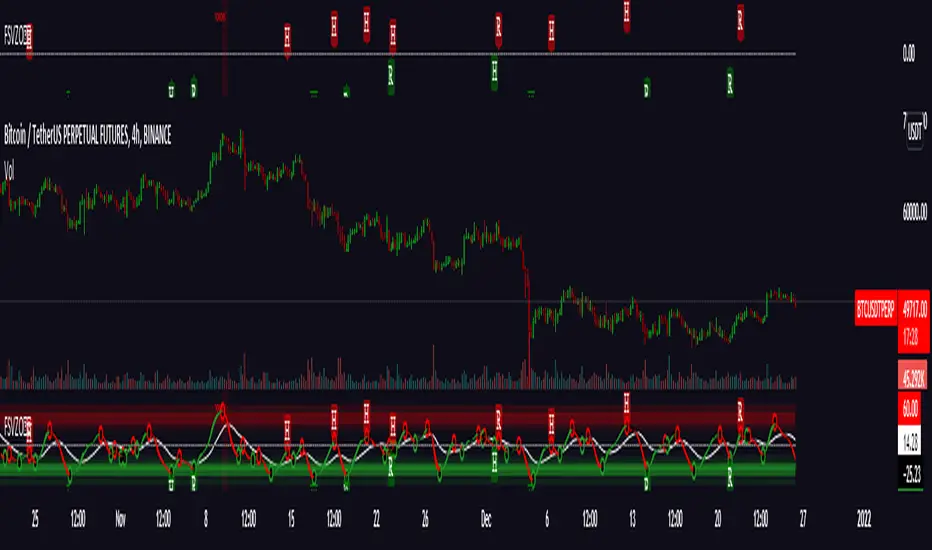
Regularized Volume Zone Oscillator FSVZORegularized VZO
Vanilla in link below
White noise and 1 confirm auto divs included
Standar Deviasi
Deviation Magnet - JDThis indicator shows price in relation to the standard deviations in a normalised way.
It can be seen as a kind of Bollinger Bands, where the bands stay the same size apart and price amplitude is modified between them,
or as a 'normalised' version of my BBC indicator.
Contrary to the popular use where price is seen as BOUNCING AGAINST the different deviations (or upper and lower BBands),
I tend to find that price likes to STICK to those deviations once it hits them (with a high or a low wick) and "rides them" for a while.
I call this "THE MAGNET EFFECT" of the standard deviations.
The indicator highlights those "MAGNET MOVES".
For most assets I like to use 50 period deviations better than the standard 20 period because it shows the bigger trends better
but of course this can be modified to your liking!
JD.
#NotTradingAdvice
#DYOR
I build these indicators for myself and provide them open source, to use for free to use and improve upon,
as I believe the best way to learn is toghether.

ATR Z ScoreThis script normalizes ATR to a Z Score, or a number of standard deviations it is from its long term average, positive or negative.

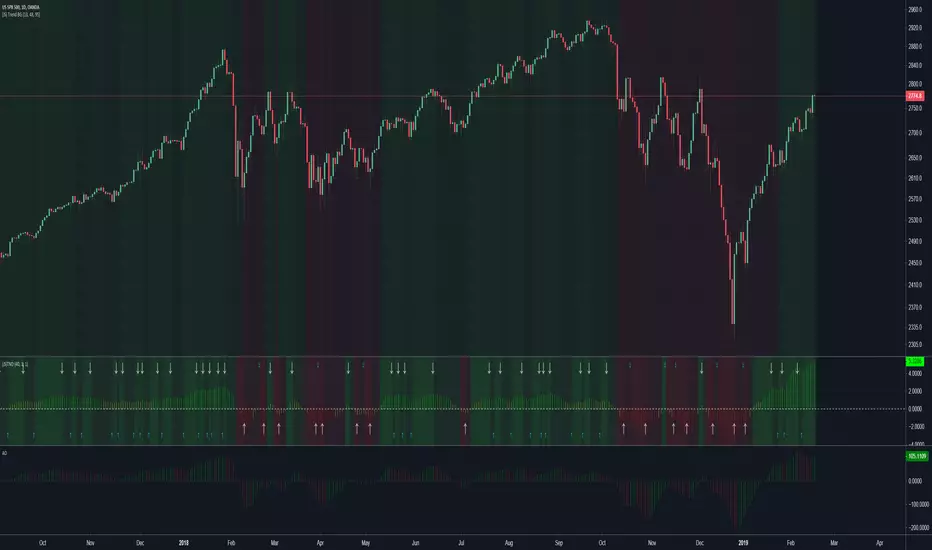
Implied Volatility Percentile (IV Percentile, HVP) [Improved]Indicator showing the Implied Volatility (IV) Percentile for any coin/security.
Areas of low volatility are clearly highlighted. As volatility increases, the IV line moves upwards and the script indicates if the move is Bullish or Bearish.
This script has been designed to be:
Simple - it removes noise and provides a clear visualization of volatility at a glance
Smart - you can define the 'low volatility' threshold and the time period to measure so it can adapt to highly volatile assets in all timeframes
Useful - increased volatility tells us nothing about direction. This script also provides a visual signal indicating if increased volatility corresponds with a bullish or bearish move
How it works:
The script compares the current volatility to the volatility of the last 365 periods. The IV is range-bound between 0% and 100% and so provides a clear view of current volatility relative to previous volatility.
Volatility is typically mean-reverting so the longer a period of low volatility, the more likely it is that an increase is upcoming. This knowledge can be used to place trades in advance of big moves.
Examples of how it can assist your trading:
Using the indicator before Bitcoin's 50% drop in November 2018:
Using the indicator before Cardano's (ADA) 60% rise in early 2019:
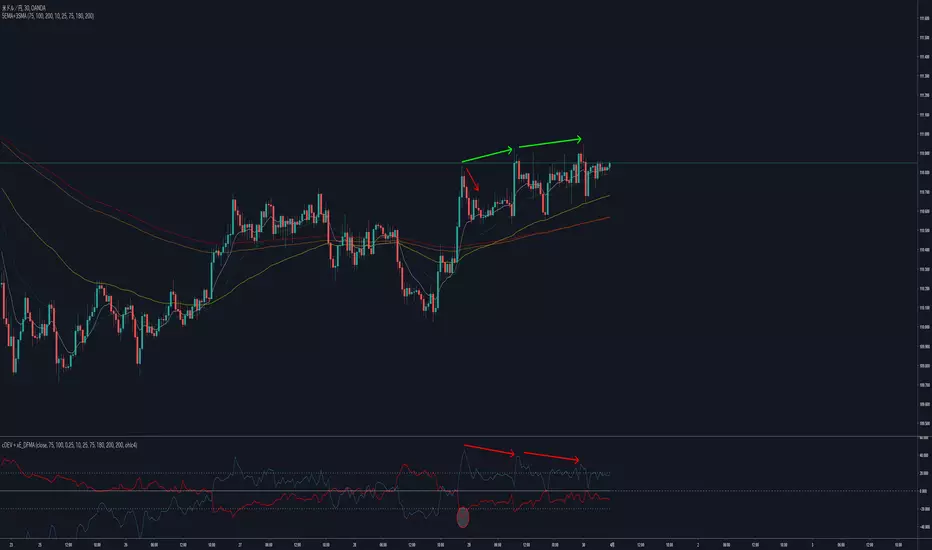
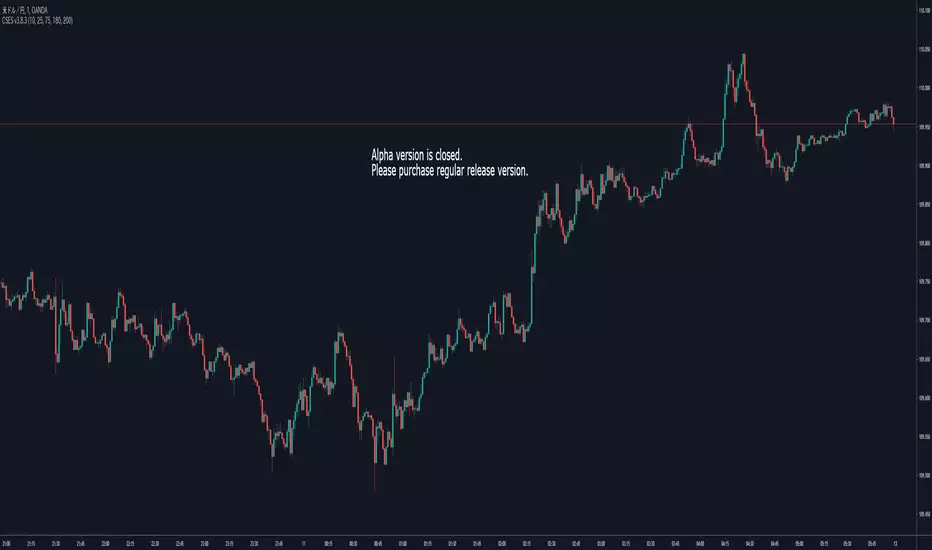
Custum Deviation + xEMA_DFMA alphaThis indicator is still an alpha version.
This indicator shows you that deviation from specific EMA (Red Line). It can help you to do Countertrade when price "skyrockets" or "Sudden drop".
Blue Line show you that sum of difference from Moving Average of 5 types EMAs. It shows "Divergence" like MACD.
Quad Bollinger Bands CCI Splash by ZekisQuad Bollinger Bands CCI Splash combine four Bollinger Bands with modified standard deviations and some other calcs and CCI indicator.
It's working very well in trending market (obviously) with a very high win/loss ratio.
It's working in any time frame.
The long threshold should be opposed to the short one (ex.: Long T. 50 / Short T. -50), but it can be 0 for both.
Greater difference between thresholds means fewer trades.
There are standard entries for Longs and Shorts and reentries marked with RE.
Also there are exits correlated with standard entries only.
Enjoy!
@Zekis

(JS) Tip-and-Dip OscillatorLet me start by saying I know that the name is goofy lol
This is an oscillator that that looks at price action vs. standard deviation in order to illustrate the trend. This thing looks like an Awesome Oscillator but the math behind this and the Awesome Oscillator are totally different (which is pretty interesting, given they look a lot alike). I included the Awesome Oscillator on the chart here so you can look at them and see where they are different.
So the Tip-and Dip Oscillator is meant to help you pinpoint tops and bottoms. I even added arrows where the top and bottom signals are given.
The oscillator itself has 3 colors, an up, down, and neutral color that come as green, red, and yellow. Since the readings given by the oscillator can greatly vary depending on the chart resolution, I included an option to edit the range to fit your chart.
Also - I have 4 different smoothing options that you can use depending on what your preference is. The default setting is the most sensitive so it will identify tops and bottoms more frequently, but it is the most accurate when pinpointing the correct reversal candle. As you smooth it out, the arrows will appear less, but my be slightly delayed and give a later reading. I personally prefer the default, but going up to the second setting in smoothing works nicely as well.
Enjoy!
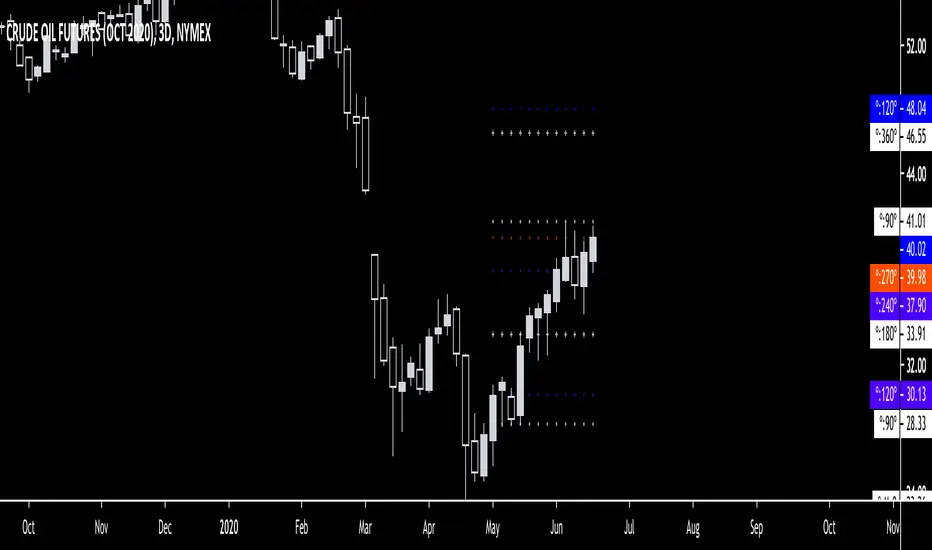
Gann Square Of 9 LevelsThis script uses the last hlc3 value of 1H, 4H, D and/or W and rotates it 360º up/down with four increments of 90º to find out potential support and resistance areas. Can be used as a dynamic support & resistance tool or just to gauge how overbought/oversold the market is. Special thanks to @Nv56 for his assistance in writing this script.
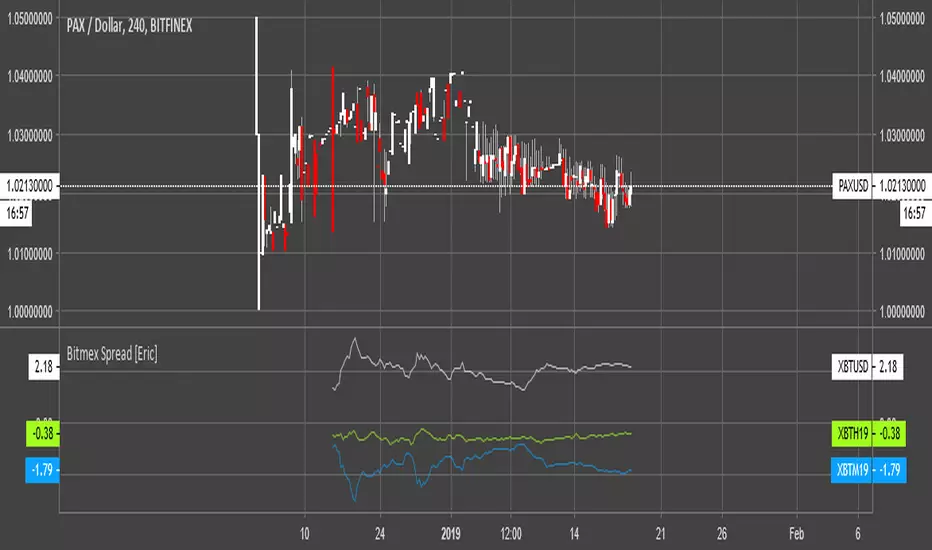
Bitmex Spread [Eric]This is a tool for taking advantage of the spread of different contracts on BITMEX, and USDT also.
For example,
BITMEX
When the spread is enlarge into 3rd deviation, it can only sustain for 0.03% of all the spreading time. So, in that case, we can short the higher contract and long the lower contract, to gain profit from it's future closing gap movement, with 3x we can gain 3%-5% in every trade.
USDT
When the spread of USDT enlarge, like on the chart, into 6%, we can buy USDT and hold it to the meanline 0, then sell it. 6% gained.
One indicator can help me gain profit from trading the spread on two different pairs: XBTUSD, XBTH19 and XBTM19 pair and USDT, USD pair.
Bollinger Bands MTF [LonesomeTheBlue]With this script you can follow Bollinger Bands for current and higher time frame together. Higher time frame is calculated by script.
if current period
1m => higher period=5m
3m => higher period=5m
5m => higher period=15m
15m => higher period=1h
30m => higher period=1h
45m => higher period=1h
1h => higher period=4h
2h => higher period=4h
3h => higher period=4h
4h => higher period=1day
1day => higher period=1week

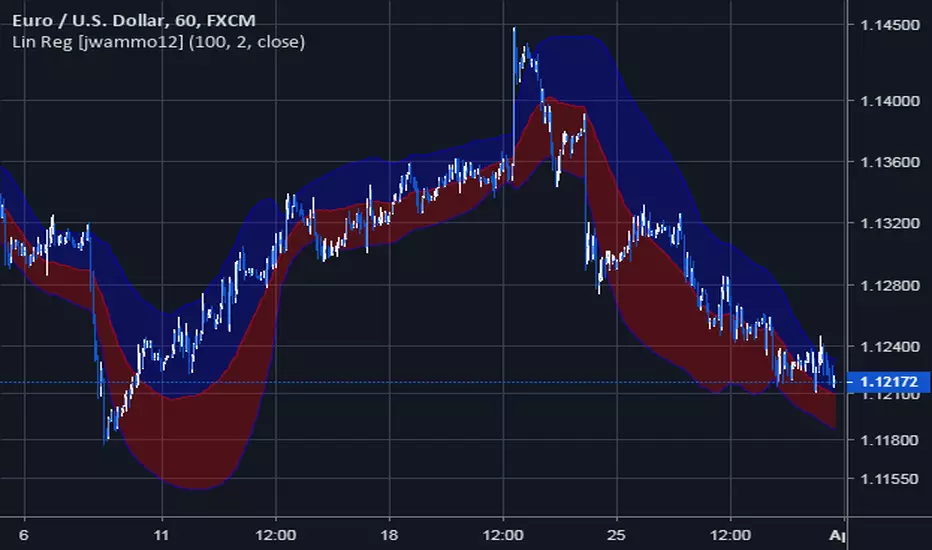
Linear Regression Channel [jwammo12]This is a non-repaint version of the built-in linear regression indicator in pine. It creates moving bands where the current bar matches the built-in Linear Regression indicator exactly (see screenshot). The key to replicating the built-in function is calculating the std deviation across the length of bars away from the current Linear Regression line, as opposed to the linear regression line that would have been calculated at the historic bar.
[RESEARCH] Mean Absolute DeviationHello traders and developers!
I was wondering how built-in "dev" function in Pine is calculated so I made a little research.
I examined 7 samples:
0) "dev" function itself
1) "dev" according to its description: series - sma(series)
2) Mean Absolute Deviation
3) ratio of the absolute difference from 1) divided by period
4) ratio of the difference from 1) divided by period
5) Median Absolute Deviation
6) tricky for-loop to calculate Mean Absolute Deviation
The results of the null and sixth samples are identical.
So, TV built-in "dev" function represents Mean Absolute Deviation and it's description is incorrect.
Where it is used? For example: Commodity Channel Index. You can check its original formula and if you used simple standard deviation instead of MAD in your CCIs - well guys, you were wrong.
Good luck!

Objective Analysis of Spread (VSA)Note: Pardon for a busy chart. It really is irrelevant for this indicator. Just look at the bottom part of the chart for the indicator (SpAn).
This script is meant to add objectivity to the estimation of spread in VSA. This is best used with a similar volume indicator that measures volume in the same fashion, but a simple rule of "higher/lower than the previous 2 bars" for estimation of volume size can be used as well in conjunction with this indicator.
A 30-period (adjustable) SMA difference between the high and the close is used to estimate average spread. This value is used to plot bands of 0.8 and lower (blue) standard deviation for narrow spread, 0.8-1.3 (yellow) for medium spread, 1,3-1.8 (green) for wide spread, 1.8-3 (red) for ultra-wide spread. Anything above 3 (no color) is plain crazy. =)
How to use:
A histogram of each bar spread is plotted as well. See where each histogram bar ends. For example, if it ends in the green area, this bar has a wide spread.
Added indicator:
An ATR (14-period, adjustable) is plotted as a black line for your reference. May be used for stops. Otherwise, it is not necessary for VSA.
Feedback and suggestions for improvement are welcome.

VWAP Stdev BandsCurrent price always obeys VWAP and is very useful for intraday traders. The Price will never go beyond the second deviation of VWAP at any point of time. The deviation bands are also very useful in predicting the volatility of the script.
Breakout trades can be taken based on the previous day's VWAP and it's deviations.
One can say that the stock has experienced breakout if current price crosses the fourth deviation of the previous day's VWAP or price bounces off that level, the price movement will be rapid if this occurs providing a good trading opportunity with low risk-reward ratio.
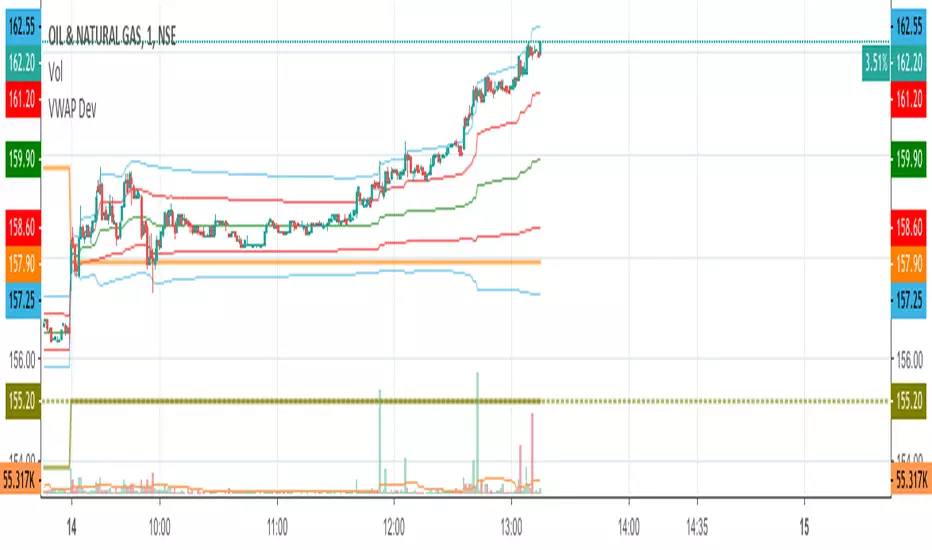
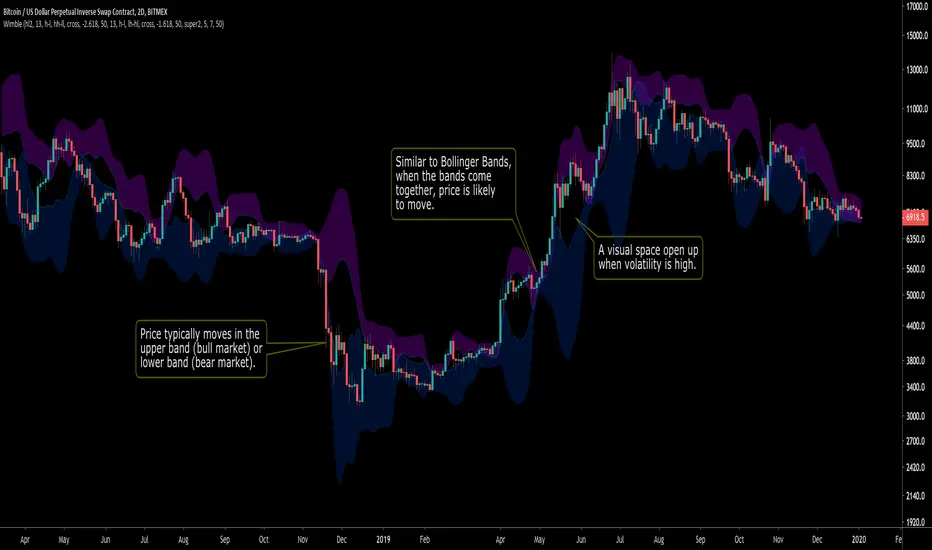
WimbleA standard deviation toolbox. Highly configurable.
Inspired by Bollinger Bands, Wimble creates two bands (from standard deviation) for visually clarity of price movement.
See the comments at the beginning of the script for a complete description.
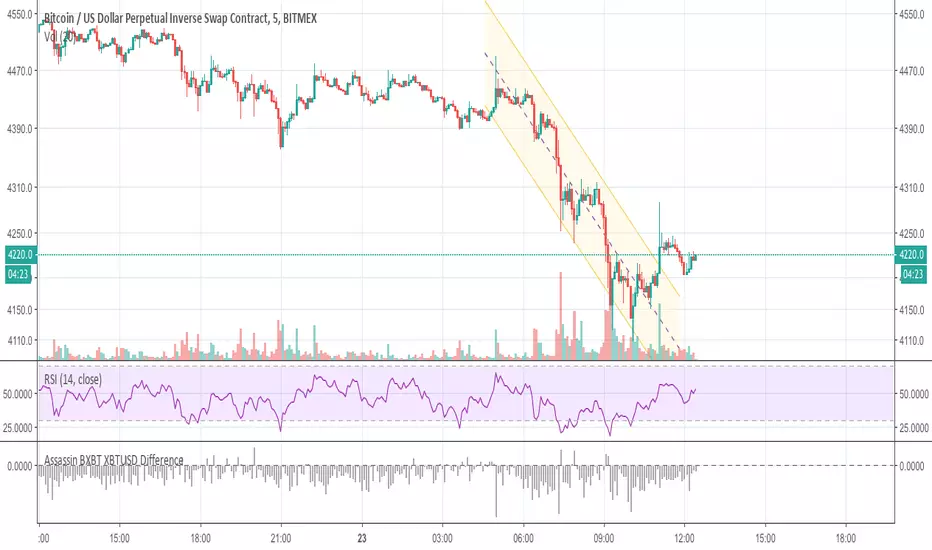
RSI Bands Multi Time Frame [Jigga + LazyBear]This is a modified version of LazyBear's RSI Bands script. I added the possibility to display multiple RSI bands, so you can see the zones, where it is viable to enter a long or a short. You can also use different time frames, so you can visually see where any specific value of RSI is for your given time frame. This gives you a lot of possibilities. Default settings use 1h time frame and the most common reversal areas for RSI. Feel free to change the settings as you see fit. If the script makes your candles too small, you can go to style and turn off individual RSI bands. After that you will still be able to see the zones, but the scale of your chart won't be affected.
It also displays the middle line, which shows you the current trend and can prevent you from entering a long, when RSI is oversold during a strong downtrend or a short, when RSI is overbought during a strong uptrend.
Do not forget to use a proper stop loss and risk management.
Here you can see it in action in different markets:
BTC - BitMex
NASDAQ Composite - Stocks
EUR / USD - Forex


Historical Volatility RankSame formulation of IVR but based on Historical Volatility instead.
Serves the same purpose as IV rank.

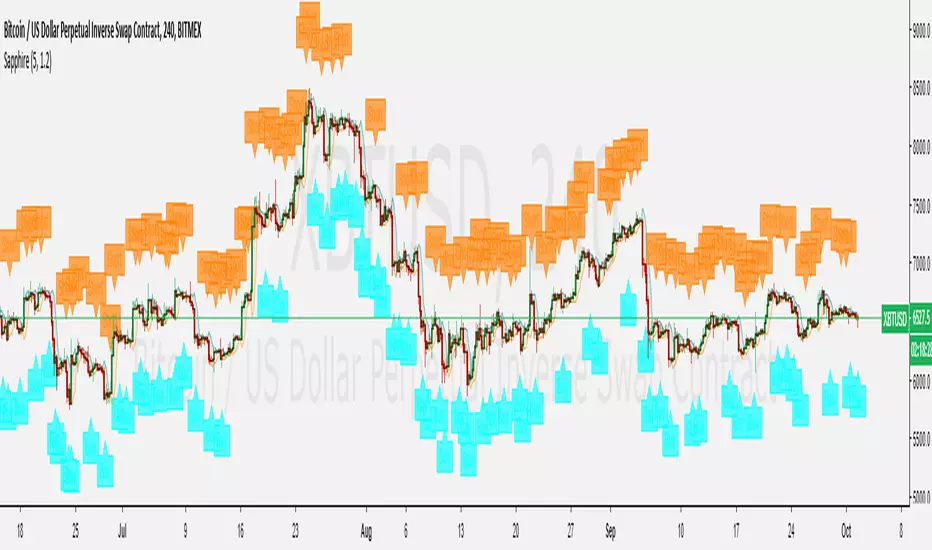
Sapphire [use not suggested]Sapphire looks for standar deviation trade signals and does not filter the results in anyway. You will often be told by the indicator to buy & hold at a loss or to exit positions prematurely and miss out on noteworthy gains (in excess of 15% at times!).
This script was published as an educational example and not suggested for use in trading .
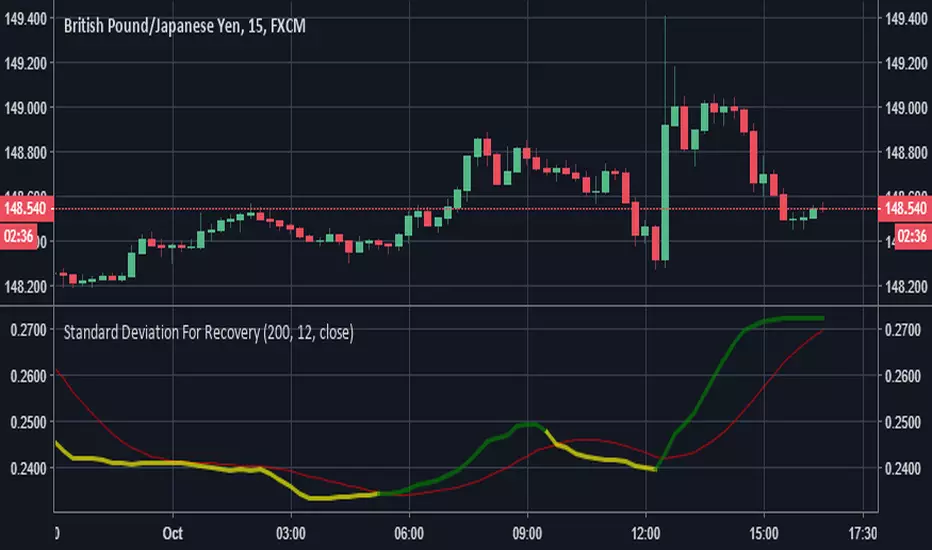
Standard Deviation For RecoveryStandard Deviation For Recovery, If you are using martin gale strategy, you can use this, just use the first GREEN line on the indicator, please note once GREEN, does not mean it's always safe to continue...
It's just a tool
SapphireTrade indicator based on standard deviation models. To avoid the numerous false trades this can trigger on normal charts, suggested use is with renko charts.
