Stablecoin Supply Ratio [Alpha Extract]Stablecoin Supply Ratio Indicator
The Stablecoin Supply Ratio (SSR) indicator compares Bitcoin's market capitalization to the aggregate supply of major stablecoins, offering insights into relative purchasing power and liquidity. This tool helps traders:
✔ Assess Bitcoin's buying power relative to the available stablecoin liquidity.
✔ Detect periods of capital inflow or outflow from stablecoins.
✔ Identify market sentiment shifts based on stablecoin reserves.
🔶 CALCULATION
The indicator aggregates the supply of key stablecoins and compares it to Bitcoin's market cap:
Stablecoin Aggregation
• Inputs:
USDT, USDC, DAI, USDD (daily closing values).
BUSD Market Cap (Glassnode data).
• Total Stablecoin Supply:
Sum of the listed stablecoins' market caps.
Stablecoin Supply Ratio (SSR)
• Formula:
SSR = Bitcoin Market Cap / Total Stablecoin Supply
• Normalized SSR:
Normalized by dividing SSR by its 200-day SMA.
Bollinger Bands
• Bands are applied to the normalized SSR using a configurable moving average type and 2 standard deviations.
Example Calculation:
ssr = btcmc / stablecoin_liq
ratio = ssr / ta.sma(ssr, 200)
basis = ta.sma(ratio, 200)
dev = 2 * ta.stdev(ratio, 200)
upper = basis + dev
lower = basis - dev
🔶 DETAILS
Visual Features:
• Normalized SSR:
Plotted as a light green line.
• Upper Band:
Red line indicating SSR overbought zone.
• Lower Band:
Green line signaling SSR oversold zone.
Interpretation:
• High SSR: Indicates stablecoin reserves are low relative to Bitcoin's market cap, reducing stablecoin buying power.
• Low SSR: Suggests high stablecoin liquidity relative to Bitcoin's market cap, increasing potential buying pressure.
• Band Crosses: Movements beyond the upper or lower bands may signal sentiment extremes.
🔶 EXAMPLES
Market insights include:
• Capital Outflows: SSR rising into the upper band may reflect decreasing stablecoin reserves, potentially signaling a liquidity drain.
• Capital Inflows: SSR dropping near the lower band could indicate growing stablecoin reserves, potentially fueling Bitcoin demand.
🔶 SETTINGS
Customization Options:
• MA Type: Choose between SMA, EMA, WMA, SMMA, and VWMA for band calculation.
• Period: Adjust the 200-day smoothing period.
• Deviation Multiplier: Modify the standard deviation multiplier (default: 2).
The Stablecoin Supply Ratio indicator is a valuable tool for traders monitoring liquidity dynamics and stablecoin trends to anticipate Bitcoin market moves and capital flows. Indikator

BTC Dominance Excluding StablecoinsBTC Dominance Excluding Stablecoins
Description:
The "BTC Dominance Excluding Stablecoins" indicator calculates Bitcoin's dominance as a percentage of the total cryptocurrency market capitalization, excluding the market caps of major stablecoins (USDT and USDC). Unlike the standard BTC.D ticker, which includes stablecoins in the total market cap, this indicator provides a clearer view of Bitcoin’s dominance relative to the "non-stable" crypto market. This can be useful for traders and analysts who want to assess Bitcoin’s strength without the influence of stablecoin market caps, which often skew dominance metrics during periods of high stablecoin usage.
How It Works:
Bitcoin Market Cap: Fetches Bitcoin’s market capitalization using CRYPTOCAP:BTC.
Total Market Cap: Retrieves the total cryptocurrency market cap via CRYPTOCAP:TOTAL.
Stablecoin Adjustment: Subtracts the market caps of USDT (CRYPTOCAP:USDT) and USDC (CRYPTOCAP:USDC) from the total market cap.
Dominance Calculation: Computes Bitcoin’s dominance as (BTC Market Cap / Adjusted Total Market Cap) * 100, where the adjusted total excludes stablecoins.
Output: Plots the resulting dominance percentage as a line chart.
Features:
Displays Bitcoin dominance excluding stablecoins on any timeframe.
Customizable line color and thickness for better visualization.
Provides a more accurate representation of Bitcoin’s market share in the volatile, non-stablecoin crypto ecosystem.
Usage:
Add this indicator to your TradingView chart to compare Bitcoin’s dominance against the broader altcoin market, free from stablecoin distortions. Use it alongside other indicators like BTC.D or price charts to analyze market trends, especially during periods of high stablecoin inflows or outflows.
Notes:
The indicator currently excludes USDT and USDC, the two largest stablecoins by market cap. Additional stablecoins (e.g., DAI, BUSD) can be added by modifying the script if desired.
Data is sourced from TradingView’s CRYPTOCAP symbols, which may have slight delays or variations depending on exchange data feeds.
Best used on daily or higher timeframes for smoother, more reliable results.
Author:
Created by K Du₿
Version:
Pine Script v5
Indikator

Indikator

Blockunity Stablecoin Liquidity (BSL)Monitor the liquidity of the crypto market by tracking the capitalizations of the major Stablecoins.
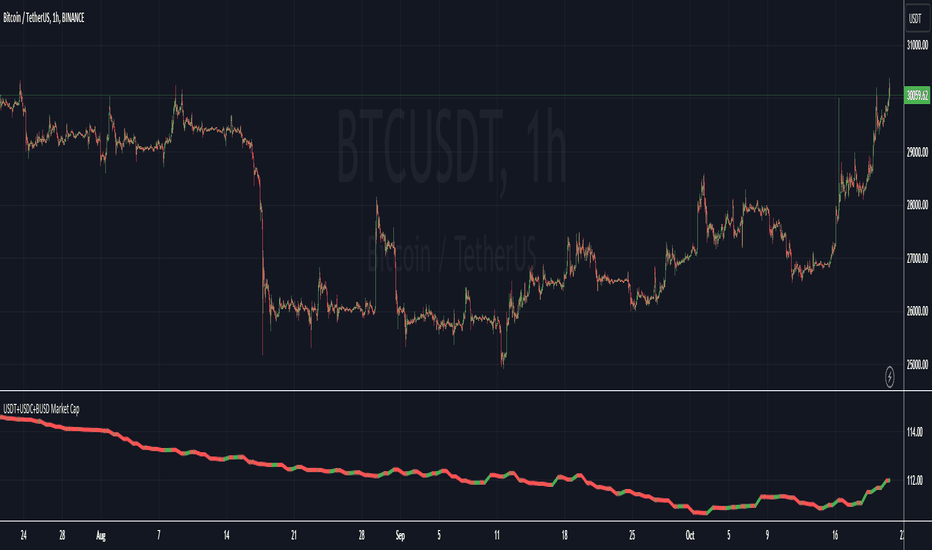
Stablecoin Liquidity (BSL) is an ideal tool for visualizing data on major Stablecoins. The number of Stablecoins in circulation is one of the best indices of liquidity within the crypto market. It’s an important metric to keep an eye on, as an increase in the number of Stablecoins in circulation offers a great opportunity to see cryptoasset prices rise. The tool’s multiple on-board display modes enable analysis of its data in the best possible conditions.
The Idea
The goal is to provide the community with the ideal tool to visualize the liquidity of the crypto market, via the state of the market capitalizations of the major Stablecoins.
How to Use
The tool is very easy to use and interpret. First of all, let's distinguish two main elements:
The chart as 3 distinct display modes to let you observe data in the best possible conditions.
There is a panel that summarizes the market capitalizations of the main Stablecoins.
Display Mode: Cumulative
In Cumulative mode (default), the different capitalizations are displayed one on top of the other with colored bands.
You can see that when the number of Stablecoins in circulation increases, crypto asset prices enter an uptrend. And if the liquidity of Stablecoins dries up, the trend will become bearish.
Display Mode: Aggregated
Aggregated mode displays a single line, which is the sum of the different capitalizations, varying between green and red depending on the state of this data according to its moving average declared in the 'Aggregated MA Lengh' field.
You can thus easily see trend changes and therefore opportunities to enter or exit the crypto market.
Display Mode: Independent
The Independent mode also displays the different capitalizations, but detached from each other with labels.
This display mode is particularly interesting for studying transfers from one Stablecoin to another, as can be seen below.
Other Settings
You can choose whether or not to include each of the Stablecoins data, and configure their display color. Note that in 'Cumulative' display mode, the data is taken into account even if the box is unchecked.
How it Works
The tool works in a simple way: We take the market capitalization data of the Stablecoins that interest us, then we process them according to the different display modes.
Let us know if you would like other ways of visualizing this data! Indikator

Indikator

Stablecoin Supply Ratio Oscillator
The Stablecoin Supply Ratio Oscillator (SSRO) is a cryptocurrency indicator designed for mean reversion analysis and sentiment assessment. It calculates the ratio of CRYPTO:BTCUSD 's market capitalization to the sum of stablecoins' market capitalization and z-scores the result, offering insights into market sentiment and potential turning points.
Methodology:
The SSRO is calculated as follows-
method ssro(float src, array stblsrc, int len) =>
float ssr = src / stblsrc.sum() // Source of the underlying divided by the sum of stablecoin sources
(ssr - ta.sma(ssr, len)) / ta.stdev(ssr, len) // Z-Score Transformed
This ratio is Z-Scored to provide a standardized measure, allowing users to identify periods of market fear or greed based on the allocation of capital between the underlying and Stablecoins ( CRYPTOCAP:USDT , CRYPTOCAP:USDC , CRYPTO:TUSD , CRYPTOCAP:BUSD , CRYPTOCAP:DAI , CRYPTOCAP:USDD , CRYPTOCAP:FRAX ). The z-scored values indicate potential areas of discount (buying opportunities) or premium (selling opportunities) relative to historical patterns.
Customization:
Underlying Asset: SSRO is customizable to different underlying assets, offering a versatile tool for various cryptocurrencies.
Calculation Length: Users can adjust the length of the calculation, tailoring the indicator to short or long-term analysis.
Visualization: SSRO can be displayed as candles, providing a visual representation of premium and discount areas.
Interpretation:
Market Sentiment: Lower SSRO values may indicate market fear, suggesting a preference for stablecoins as a relatively safer haven for capital. Conversely, higher values may suggest market greed, as more capital is allocated to the underlying asset.
Utility and Use Cases:
1. Mean Reversion Analysis: SSRO identifies potential mean reversion opportunities, guiding traders on optimal entry and exit points.
2. Sentiment Analysis: The indicator provides insights into market sentiment, aiding traders in understanding market dynamics.
3. Macro Analysis: The majority of cryptos follow \ correlate to CRYPTO:BTCUSD , Therefore by assessing premium and discount areas of CRYPTO:BTCUSD relative to the chosen underlying asset, users gain insights into potential market tops and bottoms.
4. Divergence Analysis: SSRO divergence from price trends can signal potential reversals, providing traders with additional confirmation for their decisions.
The Stablecoin Supply Ratio Oscillator is a valuable tool for cryptocurrency traders, offering a nuanced perspective on market sentiment and mean reversion opportunities. Its customization options and visual representation make it a versatile and powerful addition to the crypto analyst's toolkit. Indikator

Indikator

Indikator

Indikator

Indikator

Indikator

Indikator

Indikator

Indikator

Indikator