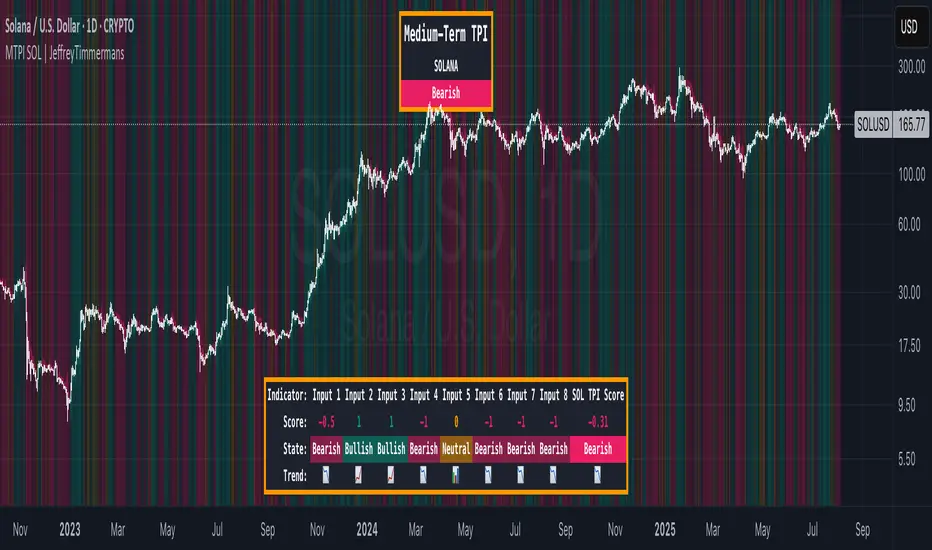
MTPI SOL | JeffreyTimmermansMedium-Term Trend Probability Indicator
The "Medium-Term Trend Probability Indicator" on SOL (Solana) is a custom-built tool designed to analyze Solana (SOL) from a medium-term perspective. Unlike short-term indicators that react quickly to intraday volatility or long-term models that focus on macro cycles, the MTPI is optimized to detect medium-term market trends—capturing key turning points and momentum shifts that unfold over multiple weeks.
This version of the MTPI is applied to SOL, making it a Solana-specific trend-following tool with particular sensitivity to its price behavior and structural dynamics.
Key Features
Medium-Term Focus:
Built to monitor price action over several weeks to months, the MTPI filters out short-term noise while remaining responsive to meaningful trend changes.
8 Input Signals:
The MTPI aggregates 8 carefully selected trend-following inputs, each tuned to reflect mid-cycle behavior in SOL’s price movements.
Market Regimes:
The MTPI classifies market behavior into one of three clear regimes:
Bullish → Momentum and structure align to support a continued uptrend
Bearish → Majority of signals point to trend deterioration or downside momentum
Neutral → Mixed signals, often during consolidation or early transition phases
Visual Background:
The background color shifts dynamically to reflect the active regime—making it easy to visually interpret the prevailing market condition.
Comprehensive Dashboard:
The lower panel displays:
The state of each individual input (Bullish, Bearish, Neutral)
The numerical MTPI Score (average of all 8 signals)
The final Trend Classification (Bullish / Bearish / Neutral)
How It Works
Input Analysis:
Each of the 8 inputs outputs a score based on its internal signal:
+1 = Bullish condition
-1 = Bearish condition
0 = Neutral / indecisive
Score Calculation:
The MTPI Score is calculated as the average of all 8 input signals:
Score > +0.1 = Bullish regime
Score < -0.1 = Bearish regime
Score between -0.1 and +0.1 = Neutral regime
Background Coloring:
Color-coded backgrounds instantly reflect the current trend classification based on the MTPI Score, helping traders stay aligned with the market direction at all times.
Use Cases
Mid-Term Positioning:
Identify strong trend phases on SOL with reduced noise and increased directional clarity.
Confirmation Layer:
Use MTPI as a mid-term confirmation tool alongside short-term setups or long-term macro models (like LTPI).
Rotation or Transition Detection:
Spot key moments when SOL transitions from expansion to contraction phases (and vice versa).
Dynamic Alerts:
Bullish Signal: MTPI Score crosses above +0.1
Bearish Signal: MTPI Score crosses below -0.1
Neutral Zone: MTPI Score enters between -0.1 and +0.1
Conclusion
The Medium-Term Trend Probability Indicator (MTPI – SOL) provides a powerful framework for identifying trend phases on Solana with mid-term relevance. By combining 8 intelligent inputs into a single score and market classification, it offers clarity in times of uncertainty and confidence in times of momentum. Whether used alone or as part of a broader multi-timeframe strategy, the MTPI helps refine entries, exits, and macro alignment in the dynamic world of Solana trading.
SOL
SOL & BTC EMA with BTC/SOL Price Difference % and BTC Dom EMAThis script is designed to provide traders with a comprehensive analysis of Solana (SOL) and Bitcoin (BTC) by incorporating Exponential Moving Averages (EMAs) and price difference percentages. It also includes the BTC Dominance EMA to offer insights into the overall market dominance of Bitcoin.
Features:
SOL EMA: Plots the Exponential Moving Average (EMA) for Solana (SOL) based on a customizable period length.
BTC EMA: Plots the Exponential Moving Average (EMA) for Bitcoin (BTC) based on a customizable period length.
BTC Dominance EMA: Plots the Exponential Moving Average (EMA) for BTC Dominance, which helps in understanding Bitcoin's market share relative to other cryptocurrencies.
BTC/SOL Price Difference %: Calculates and plots the percentage difference between BTC and SOL prices, adjusted for their respective EMAs. This helps in identifying relative strength or weakness between the two assets.
Background Highlight: Colors the background to visually indicate whether the BTC/SOL price difference percentage is positive (green) or negative (red), aiding in quick decision-making.
Inputs:
SOL Ticker: Symbol for Solana (default: BINANCE
).
BTC Ticker: Symbol for Bitcoin (default: BINANCE
).
BTC Dominance Ticker: Symbol for Bitcoin Dominance (default: CRYPTOCAP
.D).
EMA Length: The length of the EMA (default: 20 periods).
Usage:
This script is intended for traders looking to analyze the relationship between SOL and BTC, using EMAs to smooth out price data and highlight trends. The BTC/SOL price difference percentage can help traders identify potential trading opportunities based on the relative movements of SOL and BTC.
Note: Leverage trading involves significant risk and may not be suitable for all investors. Ensure you have a good understanding of the market conditions and employ proper risk management techniques.

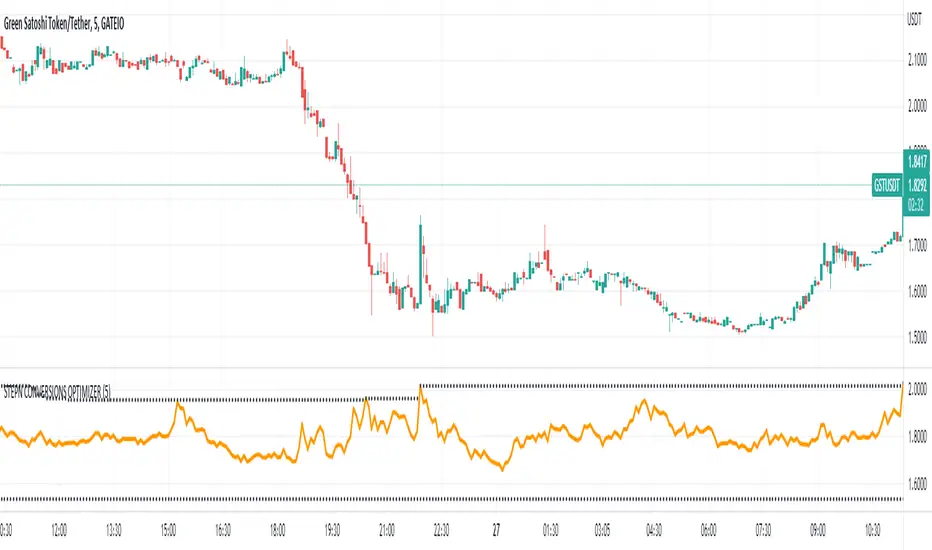
STEPN CONVERSION OPTIMIZERThis is a very simple indicator that anyone can use but it is especially geared towards STEPN users who often have to switch between different tokens (GST, GMT, SOL, BNB).
The idea of the indicator is that at a glance you can know if it is a good time or not to make a conversion. What the indicator does is divide the value of the token that we have by the one that we want to change in each bar and with this data a graph is created with which you know how much you are going to receive for each token and how much you would have received at any other time.
It is completely configurable for any conversion between STEPN tokens, you can also include two dotted lines that indicate when the maximum and minimum conversion rate has been reached, which makes it very easy to know where you are.
The data collection is independent of the graph on screen so it's great to have it on screen waiting for the ideal moment for the change while you do other things.
The timeframe is also configurable in case you are not very interested in precision, by default the data is taken from the 5-minute chart.
I created this indicator for myself but seeing how useful it is to me and that not only am I not losing money like before but I am even earning money with conversions, I have decided to share it.
Feedback would be appreciated and if you like it and find it as useful as it does for me, show some love.
Price DEFI Categories against BTC & ETH/* Work in progress. The indicator is not finished. *\
The indicator shows the pricing of 3 DEFI categories against 2 possible baselines, BTC and ETH.
To do:
* Make a simple array in the source code to enter and remove new projects to the category. -> Maybe can also make it so that the source code does not have to be altered (projects can be added through input etc.)
* Adjust weightings depending on project data but this is not as important since weightings are being priced in by the market.
* Try to find a way to update input to string instead of booleans. As of currently, I could not seem to use input strings into plot functions because of an error.
* and more. Leave some feedback, that would be highly appreciated!
