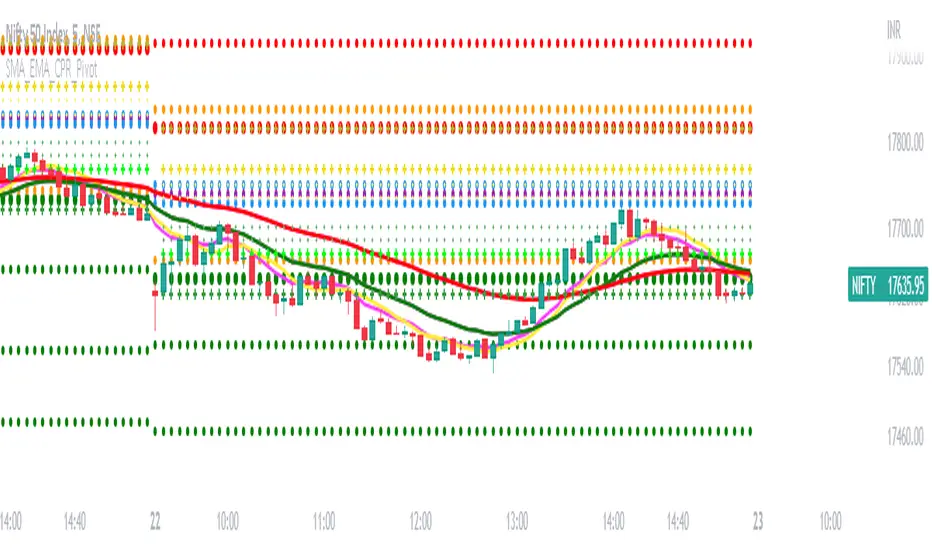
SMA_EMA_CPR_PivotThis Script can do multiple jobs in single indicator.
Like -:
Plot 3 SMA as per your inputs.
Plot 3 EMA as per your inputs.
Plot CPR Levels.
Plot Pivot Levels.
Plot Previous Day High Low.
Indicator can used in Intraday stock trading, Positional Trading and options trading.
Please Enjoy.
Sma
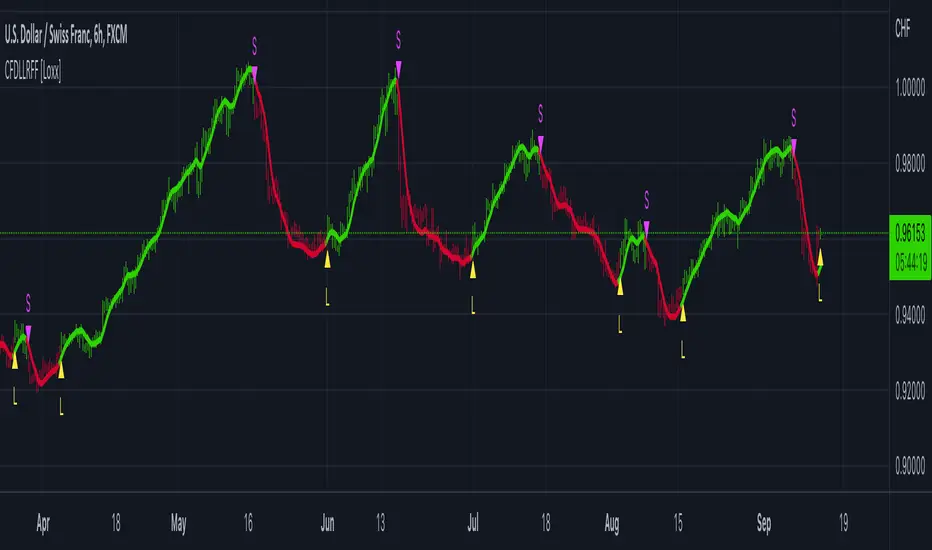
Fractal-Dimension-Adaptive SMA (FDASMA) w/ DSL [Loxx]Fractal-Dimension-Adaptive SMA (FDASMA) w/ DSL is a fractal-dimension-index-adaptive SMA. The SMA is accelerated during a trend and slowed down during a sideways market, so as to avoid false signals. This indicator uses the fractal dimension to compute an ingest period length into the SMA to output the FDASMA.
What is the Fractal Dimension Index?
The goal of the fractal dimension index is to determine whether the market is trending or in a trading range. It does not measure the direction of the trend. A value less than 1.5 indicates that the price series is persistent or that the market is trending. Lower values of the FDI indicate a stronger trend. A value greater than 1.5 indicates that the market is in a trading range and is acting in a more random fashion.
What are DSL Discontinued Signal Line?
A lot of indicators are using signal lines in order to determine the trend (or some desired state of the indicator) easier. The idea of the signal line is easy : comparing the value to it's smoothed (slightly lagging) state, the idea of current momentum/state is made.
Discontinued signal line is inheriting that simple signal line idea and it is extending it : instead of having one signal line, more lines depending on the current value of the indicator.
"Signal" line is calculated the following way :
When a certain level is crossed into the desired direction, the EMA of that value is calculated for the desired signal line
When that level is crossed into the opposite direction, the previous "signal" line value is simply "inherited" and it becomes a kind of a level
This way it becomes a combination of signal lines and levels that are trying to combine both the good from both methods.
In simple terms, DSL uses the concept of a signal line and betters it by inheriting the previous signal line's value & makes it a level.
Included
2 Signal types
Alerts
Loxx's Expanded Source Types
Bar coloring
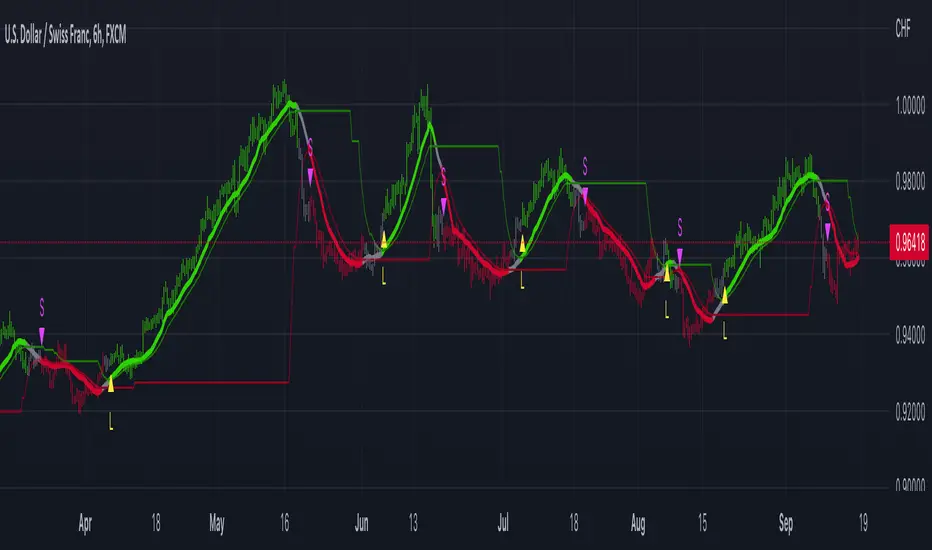
Clutter-Filtered, D-Lag Reducer, Spec. Ops FIR Filter [Loxx]Clutter-Filtered, D-Lag Reducer, Spec. Ops FIR Filter is a FIR filter moving average with extreme lag reduction and noise elimination technology. This is a special instance of a static weight FIR filter designed specifically for Forex trading. This is not only a useful indictor, but also a demonstration of how one would create their own moving average using FIR filtering weights. This moving average has static period and weighting inputs. You can change the lag reduction and the clutter filtering but you can't change the weights or the numbers of bars the weights are applied to in history.
Plot of weighting coefficients used in this indicator
These coefficients were derived from a smoothed cardinal sine weighed SMA on EURUSD in Matlab. You can see the coefficients in the code.
What is Normalized Cardinal Sine?
The sinc function sinc (x), also called the "sampling function," is a function that arises frequently in signal processing and the theory of Fourier transforms.
In mathematics, the historical unnormalized sinc function is defined for x ≠ 0 by
sinc x = sinx / x
In digital signal processing and information theory, the normalized sinc function is commonly defined for x ≠ 0 by
sinc x = sin(pi * x) / (pi * x)
What is a Generic or Direct Form FIR Filter?
In signal processing, a finite impulse response (FIR) filter is a filter whose impulse response (or response to any finite length input) is of finite duration, because it settles to zero in finite time. This is in contrast to infinite impulse response (IIR) filters, which may have internal feedback and may continue to respond indefinitely (usually decaying).
The impulse response (that is, the output in response to a Kronecker delta input) of an Nth-order discrete-time FIR filter lasts exactly {\displaystyle N+1}N+1 samples (from first nonzero element through last nonzero element) before it then settles to zero.
FIR filters can be discrete-time or continuous-time, and digital or analog.
A FIR filter is (similar to, or) just a weighted moving average filter, where (unlike a typical equally weighted moving average filter) the weights of each delay tap are not constrained to be identical or even of the same sign. By changing various values in the array of weights (the impulse response, or time shifted and sampled version of the same), the frequency response of a FIR filter can be completely changed.
An FIR filter simply CONVOLVES the input time series (price data) with its IMPULSE RESPONSE. The impulse response is just a set of weights (or "coefficients") that multiply each data point. Then you just add up all the products and divide by the sum of the weights and that is it; e.g., for a 10-bar SMA you just add up 10 bars of price data (each multiplied by 1) and divide by 10. For a weighted-MA you add up the product of the price data with triangular-number weights and divide by the total weight.
Ultra Low Lag Moving Average's weights are designed to have MAXIMUM possible smoothing and MINIMUM possible lag compatible with as-flat-as-possible phase response.
What is a Clutter Filter?
For our purposes here, this is a filter that compares the slope of the trading filter output to a threshold to determine whether to shift trends. If the slope is up but the slope doesn't exceed the threshold, then the color is gray and this indicates a chop zone. If the slope is down but the slope doesn't exceed the threshold, then the color is gray and this indicates a chop zone. Alternatively if either up or down slope exceeds the threshold then the trend turns green for up and red for down. Fro demonstration purposes, an EMA is used as the moving average. This acts to reduce the noise in the signal.
What is a Dual Element Lag Reducer?
Modifies an array of coefficients to reduce lag by the Lag Reduction Factor uses a generic version of a Kalman velocity component to accomplish this lag reduction is achieved by applying the following to the array:
2 * coeff - coeff
The response time vs noise battle still holds true, high lag reduction means more noise is present in your data! Please note that the beginning coefficients which the modifying matrix cannot be applied to (coef whose indecies are < LagReductionFactor) are simply multiplied by two for additional smoothing .
Things to note
Due to the computational demands of this indicator, there is a bars back input modifier that controls how many bars back the indicator is calculated on. Because of this, the first few bars of the indicator will sometimes appear crazy, just ignore this as it doesn't effect the calculation.
Related Indicators
STD-Filtered, Ultra Low Lag Moving Average
Included
Bar coloring
Loxx's Expanded Source Types
Signals
Alerts
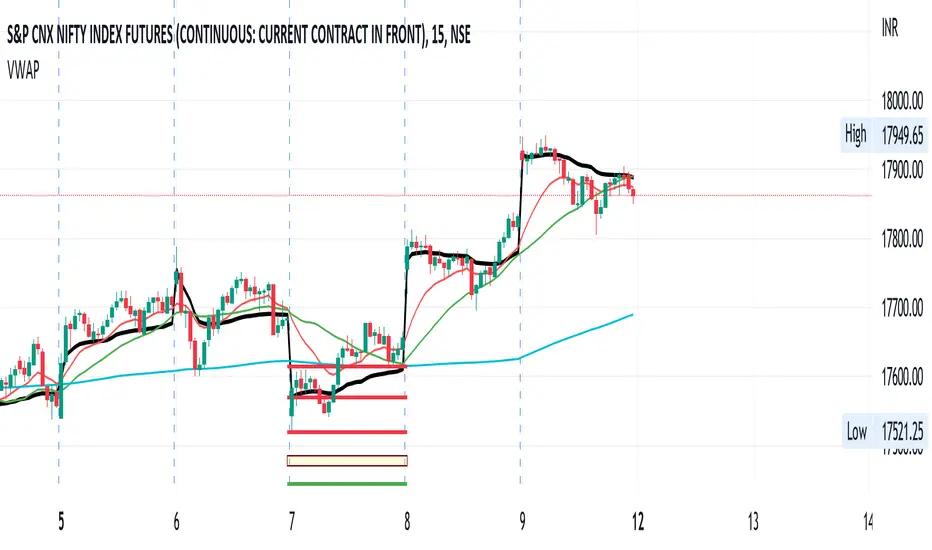
VWAP+SMA+EMAThis is the only indicator combing the results of VWAP + 2 SMAs + 2 EMAs.
This is a free indicator. Enjoy using it.
Kunal Jain
Ichimoku Cloud and Bollinger Bands (by Coinrule)The Ichimoku Cloud is a collection of technical indicators that show support and resistance levels, as well as momentum and trend direction. It does this by taking multiple averages and plotting them on a chart. It also uses these figures to compute a “cloud” that attempts to forecast where the price may find support or resistance in the future.
The Ichimoku Cloud was developed by Goichi Hosoda, a Japanese journalist, and published in the late 1960s. It provides more data points than the standard candlestick chart. While it seems complicated at first glance, those familiar with how to read the charts often find it easy to understand with well-defined trading signals.
The Ichimoku Cloud is composed of five lines or calculations, two of which comprise a cloud where the difference between the two lines is shaded in.
The lines include a nine-period average, a 26-period average, an average of those two averages, a 52-period average, and a lagging closing price line.
The cloud is a key part of the indicator. When the price is below the cloud, the trend is down. When the price is above the cloud, the trend is up.
The above trend signals are strengthened if the cloud is moving in the same direction as the price. For example, during an uptrend, the top of the cloud is moving up, or during a downtrend, the bottom of the cloud is moving down.
The Bollinger Bands are among the most famous and widely used indicators. A Bollinger Band is a technical analysis tool defined by a set of trendlines plotted two standard deviations (positively and negatively) away from a simple moving average ( SMA ) of a security's price, but which can be adjusted to user preferences. They can suggest when an asset is oversold or overbought in the short term, thus providing the best time for buying and selling it.
This strategy combines the Ichimoku Cloud with Bollinger Bands to better enter trades.
Long orders are placed when these basic signals are triggered.
Long Position:
Tenkan-Sen is above the Kijun-Sen
Chikou-Span is above the close of 26 bars ago
Close is above the Kumo Cloud
The closing price is greater than the upper standard deviation of the Bollinger Bands
Short Position:
Tenkan-Sen is below the Kijun-Sen
Chikou-Span is below the close of 26 bars ago
Close is below the Kumo Cloud
The upper standard deviation of the Bollinger Band is greater than the closing price
The script is backtested from 1 January 2022 and provides good returns.
The strategy assumes each order is using 30% of the available coins to make the results more realistic and to simulate you only ran this strategy on 30% of your holdings. A trading fee of 0.1% is also taken into account and is aligned to the base fee applied on Binance.
This script also works well on BTC 30m/1h, ETH 2h, MATIC 2h/30m, AVAX 1h/2h, SOL 45m timeframes

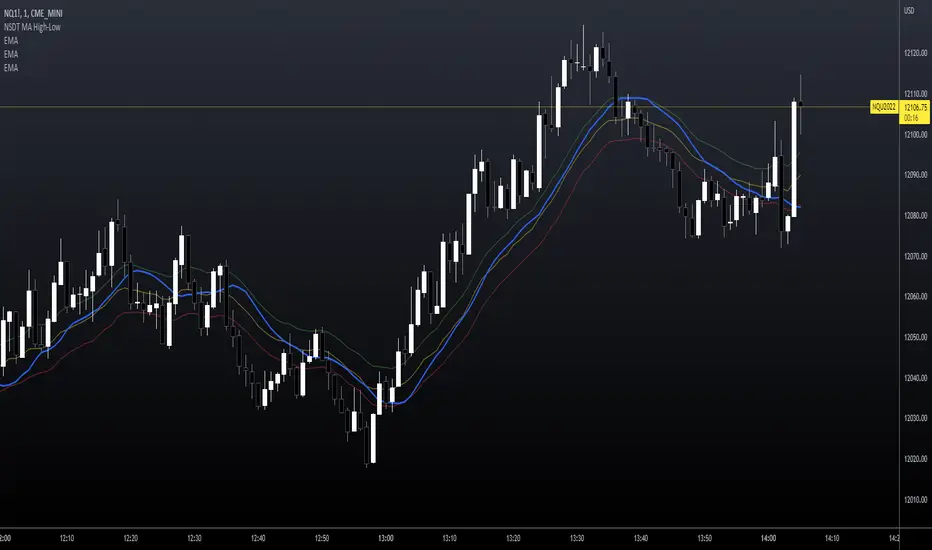
NSDT MA High-LowThis may seem like a pretty basic Moving Average indicator but I haven't seen one that changes the calculation point depending if the market is going up or down.
I've added three EMA's (length of 20) on this sample chart to demonstrate the differences. These are not included with the indicator.
Green, EMA calculated on High
Red, EMA calculated on Low
Yellow, EMA calculated on Close (default)
Blue, EMA calculated on HIGH when rising but on LOW when falling. (looks at 3 candles back to gauge direction)
* * * Note you can choose between 5 different Moving Average types
Notice how the Blue line (when going up it's calculated on the High) is catching up to the Green line (which is already calculated on the High)?
Notice how the Blue line (when going down so it's calculated on the Low) is catching up to the Red line (which is already calculated on the Low)?
This gives a faster response in the direction of the market because it switches between calculating on the High or Low based on market direction.
This script is free and open source.


OHLC Moving AverageThis indicator shows 4 moving averages of Open, High, Low and Close at the same time with an option to select SMA or EMA.
If you implement this indicator twice, you can make it look like the following chart.
One set of MA(red) is for current timeframe and another set(blue) is for higher timeframe, which is to identify potential support and resistance zones.
--------------------------
四本値(始値、高値、安値、終値)それぞれの移動平均線を同時に表示することのできるインジケーターです。
MAタイプはSMAかEMAを選択することができます。
このインジケーターを二つセットすると以下のように上位足の移動平均線とセットで表示することも可能です。
(赤がチャートの時間軸の4本値の移動平均線、青が上位足の4本値の移動平均線)
上位足の移動平均線をサポート・レジスタンスのゾーンとして捉える時などに活用できます。

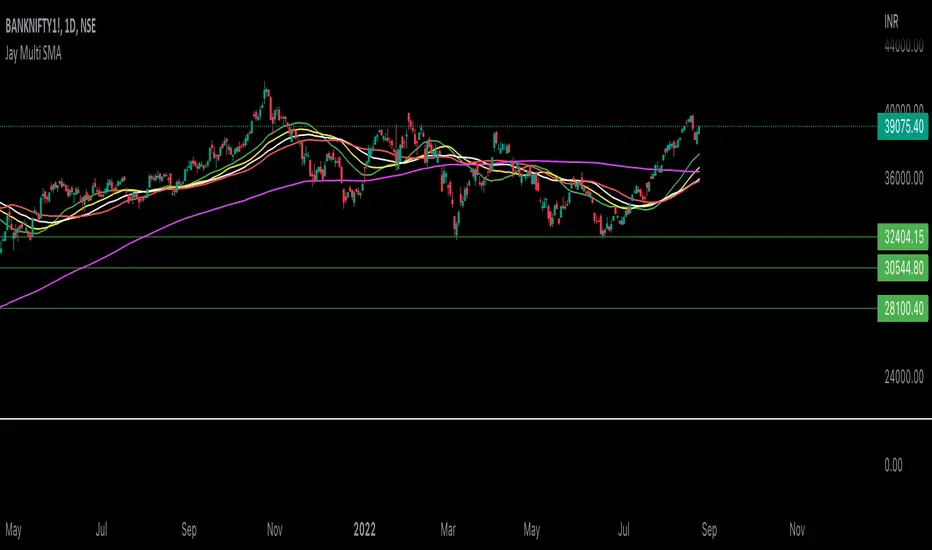
Jay Multi SMAIt's strategy of swing & positional trades.. It's based on the concept of crossing of SMA with there diff length...
Percent above or Below Moving Average Candle colourFilter:
If green candle is 'x' % above moving average than colour of candle is turn in blue colour.
If red candle is 'x' % below moving average than colour of candle is turn in orange colour.

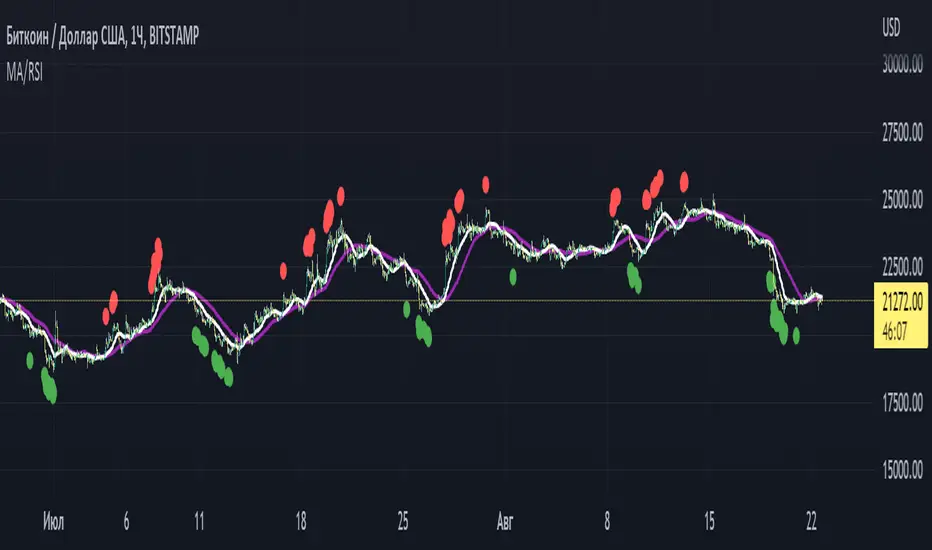
Pranoyama MA/RSI toolEng: The indicator highlights the overbought and oversold RSI levels on the bars. Also draws two moving averages: sma or ema. The RSI levels, the type of moving averages and their period are set by the user.
Rus: Индикатор подсвечивает на барах уровни перекупленности и перепроданности по RSI, а так же рисует две скользящие средние на выбор: sma или ema. Уровни RSI, тип скользящих средних и их период устанавливаются пользователем.
p.s. Это адаптация ранее опубликованного мной индикатора
TradingCube : Moving Average : Data tablePlots moving average both EMA as well as SMA on Multiple timeframes at once in a Tabular Format
for rapid indication of momentum shift as well as slower-moving confirmations.
Displays EMA/SMA 5 8, 13, 21,34,55,89,100,200,400 by default as well as provide the users the flexibility to choose the timeframe as per their set up.

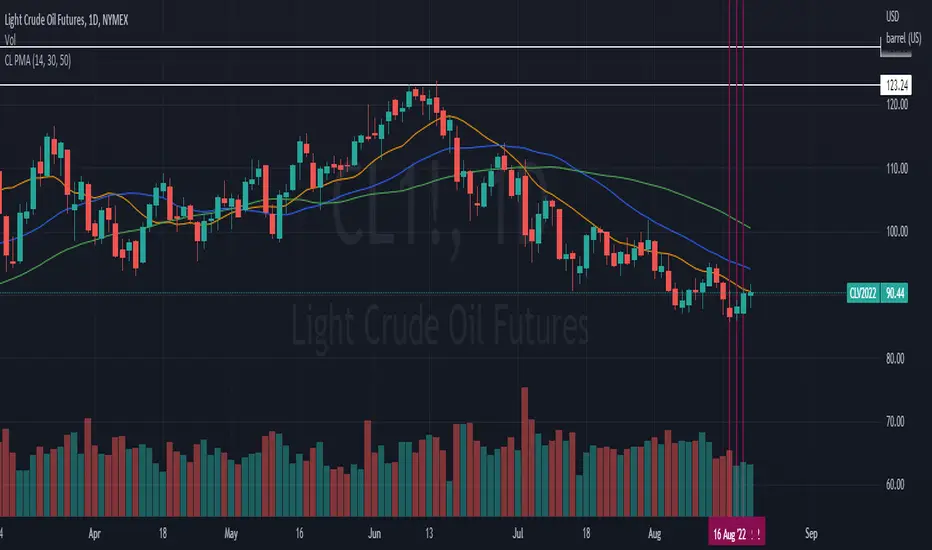
CL PMAPivot moving averages useing SMA's. This study is just a tweak from the study already done by @QUANTCT. I just cleaned it up and used SMAs instead of EMAs so he deserves most credit.
Multiple Daily SMA EMA on Intra 1min 5min 15min ChartsThis script is helping you auto plot daily SMA EMA and extensions when you are looking at intraday charts. The script is customizable where user can select which ever levels they are interested in viewing. These daily lines act as support and resistance levels for intraday
The green line represent 20 EMA Daily
The yellow line represent 50 SMA Daily
The olive line represent 200 SMA Daily
The red line is upper Bollinger Band Daily
The black line is lower Bollinger Band Daily
To help you understand which lines are what I would recommend you add this indicator and select "D" timeframe and then see which lines you would like to view for your 1min chart or 5 min chart you can customize from the setting options which plot color you would like to view.

Hodrick-Prescott Extrapolation of Price [Loxx]Hodrick-Prescott Extrapolation of Price is a Hodrick-Prescott filter used to extrapolate price.
The distinctive feature of the Hodrick-Prescott filter is that it does not delay. It is calculated by minimizing the objective function.
F = Sum((y(i) - x(i))^2,i=0..n-1) + lambda*Sum((y(i+1)+y(i-1)-2*y(i))^2,i=1..n-2)
where x() - prices, y() - filter values.
If the Hodrick-Prescott filter sees the future, then what future values does it suggest? To answer this question, we should find the digital low-frequency filter with the frequency parameter similar to the Hodrick-Prescott filter's one but with the values calculated directly using the past values of the "twin filter" itself, i.e.
y(i) = Sum(a(k)*x(i-k),k=0..nx-1) - FIR filter
or
y(i) = Sum(a(k)*x(i-k),k=0..nx-1) + Sum(b(k)*y(i-k),k=1..ny) - IIR filter
It is better to select the "twin filter" having the frequency-independent delay Тdel (constant group delay). IIR filters are not suitable. For FIR filters, the condition for a frequency-independent delay is as follows:
a(i) = +/-a(nx-1-i), i = 0..nx-1
The simplest FIR filter with constant delay is Simple Moving Average (SMA):
y(i) = Sum(x(i-k),k=0..nx-1)/nx
In case nx is an odd number, Тdel = (nx-1)/2. If we shift the values of SMA filter to the past by the amount of bars equal to Тdel, SMA values coincide with the Hodrick-Prescott filter ones. The exact math cannot be achieved due to the significant differences in the frequency parameters of the two filters.
To achieve the closest match between the filter values, I recommend their channel widths to be similar (for example, -6dB). The Hodrick-Prescott filter's channel width of -6dB is calculated as follows:
wc = 2*arcsin(0.5/lambda^0.25).
The channel width of -6dB for the SMA filter is calculated by numerical computing via the following equation:
|H(w)| = sin(nx*wc/2)/sin(wc/2)/nx = 0.5
Prediction algorithms:
The indicator features the two prediction methods:
Metod 1:
1. Set SMA length to 3 and shift it to the past by 1 bar. With such a length, the shifted SMA does not exist only for the last bar (Bar = 0), since it needs the value of the next future price Close(-1).
2. Calculate SMA filer's channel width. Equal it to the Hodrick-Prescott filter's one. Find lambda.
3. Calculate Hodrick-Prescott filter value at the last bar HP(0) and assume that SMA(0) with unknown Close(-1) gives the same value.
4. Find Close(-1) = 3*HP(0) - Close(0) - Close(1)
5. Increase the length of SMA to 5. Repeat all calculations and find Close(-2) = 5*HP(0) - Close(-1) - Close(0) - Close(1) - Close(2). Continue till the specified amount of future FutBars prices is calculated.
Method 2:
1. Set SMA length equal to 2*FutBars+1 and shift SMA to the past by FutBars
2. Calculate SMA filer's channel width. Equal it to the Hodrick-Prescott filter's one. Find lambda.
3. Calculate Hodrick-Prescott filter values at the last FutBars and assume that SMA behaves similarly when new prices appear.
4. Find Close(-1) = (2*FutBars+1)*HP(FutBars-1) - Sum(Close(i),i=0..2*FutBars-1), Close(-2) = (2*FutBars+1)*HP(FutBars-2) - Sum(Close(i),i=-1..2*FutBars-2), etc.
The indicator features the following inputs:
Method - prediction method
Last Bar - number of the last bar to check predictions on the existing prices (LastBar >= 0)
Past Bars - amount of previous bars the Hodrick-Prescott filter is calculated for (the more, the better, or at least PastBars>2*FutBars)
Future Bars - amount of predicted future values
The second method is more accurate but often has large spikes of the first predicted price. For our purposes here, this price has been filtered from being displayed in the chart. This is why method two starts its prediction 2 bars later than method 1. The described prediction method can be improved by searching for the FIR filter with the frequency parameter closer to the Hodrick-Prescott filter. For example, you may try Hanning, Blackman, Kaiser, and other filters with constant delay instead of SMA.
Related indicators
Itakura-Saito Autoregressive Extrapolation of Price
Helme-Nikias Weighted Burg AR-SE Extra. of Price
Weighted Burg AR Spectral Estimate Extrapolation of Price
Levinson-Durbin Autocorrelation Extrapolation of Price
Fourier Extrapolator of Price w/ Projection Forecast

Moving Averages RefurbishedIntroduction
This is a collection of multiple moving averages, where you can have a rainbow of moving averages with different types that can be defined by the user.
There are already other indicators in this rainbow style, however certain averages are absent in certain indicators and present in others,
needing the merge to have a more complete solution.
Resources
Here there is the possibility to individually define each moving average.
In addition, it is possible to adjust some details, such as themes, coloring and periods.
Regarding the calculation of averages, credit goes to the following authors.
What I've done here is to group these averages together and allow them to combine.
Credits
TradingView
PineCoders
CrackingCryptocurrency
MightyZinger
Alex Orekhov (everget)
alexgrover
paragjyoti2012
Moving averages available
1. Exponential Moving Average
2. Simple Moving Average
3. Relative Moving Average
4. Weighted Moving Average
5. Ehlers Dynamic Smoothed Moving Average
6. Double Exponential Moving Average
7. Triple Exponential Moving Average
8. Smoothed Moving Average
9. Hull Moving Average
10. Fractal Adaptive Moving Average
11. Kaufman's Adaptive Moving Average
12. Volatility Adjusted Moving Average
13. Jurik Moving Average
14. Optimized Exponential Moving Average
15. Exponential Hull Moving Average
16. Arnaud Legoux Moving Average
17. Coefficient of Variation Weighted Exponential Moving Average
18. Coefficient of Variation Weighted Moving Average
19. * Ehlrs Modified Fractal Adaptive Moving Average
20. Exponential Triangular Moving Average
21. Least Squares Moving Average
22. RSI Moving average
23. Simple Triangular Moving Average
24. Triple Hull Moving Average
25. Variable Index Dynamic Average
26. Volume-weighted Moving Average
27. Zero-Lag Exponential Moving Average
28. Zero-Lag Simple Moving Average
29. Elastic Volume Weighted Moving Average
30. Tillson T3
31. Geometric Moving Average
32. Welles Wilder Moving Average
33. Adjusted Moving Average
34. Corrective Moving average
35. Exponentially Deviating Moving Average
36. EMA Range
37. Sine-Weighted Moving Average
38. Adaptive Moving Average TABLE
39. Following Adaptive Moving Average
40. Hilbert based Kaufman's Adaptive Moving Average
41. Median
42. * VWAP
43. * Rolling VWAP
44. Triangular Simple Moving Average
45. Triangular Exponential Moving Average
46. Moving Average Price Correlation
47. Regularized Exponential Moving Average
48. Repulsion Moving Average
49. * Symmetrically Weighted Moving Average
* fixed period averages

Moving Averages Proximity Oscillator [LuxAlgo]This indicator returns the percentage or count of prices greater than simple moving averages with periods in a user set range, as well as the moving average period that is the closest to price values.
Settings
Minimum Length: Minimum SMA period
Maximum Length: Maximum SMA period
Smooth: Control the degree of smoothness of the indicator outputs
Normalized: Normalize the indicator outputs in a range (0, 100)
Src: Input source of the indicator
Usage
The indicator returns two outputs.
The "Price Above MA's" output returns for a current price value the number of times this one is greater than simple moving averages with periods ranging from Minimum Length to Maximum Length . This oscillator can be expressed as a percentage if Normalized is selected.
This oscillator allows identifying the direction of an underlying trend in the price. Higher Minimum Length and Maximum Length settings will return indications regarding longer term price variations, while shorter ranges will return less detailed outputs. This can be seen in the chart above where Minimum Length = 80 to Maximum Length = 100 .
The "Proximity Index" output on the other end does not return information regarding the direction of an underlying trend but the period of the simple moving average with periods ranging from Minimum Length to Maximum Length that is the closest to the current price value.
For various simple moving averages of differing periods, we can see that SMA's with shorter periods will tend to stay closer to the price, when price start reverting it will reach higher periods moving averages.
As such, this second indicator output can help identify the start of new trends, with higher values indicating price is reverting toward longer-term moving averages, suggesting a new trend forming.

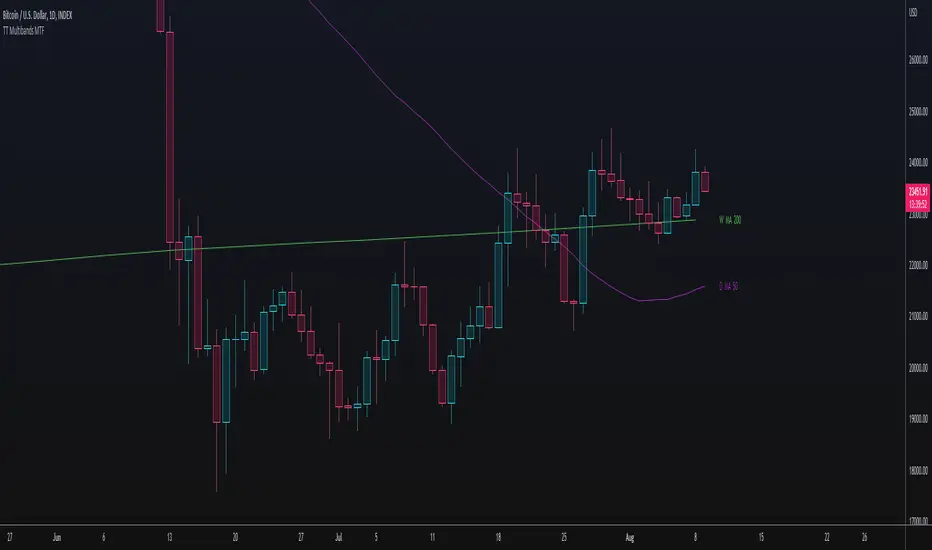
TT Multibands MTFThis Multi Moving Average Indicator is for a long list of Moving Averages:
- Simple Moving Average (SMA)
- Exponential Moving Average (EMA)
- Weighted Moving Average (WMA)
- Hull Moving Average (HMA)
- Double Exponential Moving Average (DEMA)
- Triple Exponential Moving Average (TEMA)
- Volume Weighted Moving Average (VWMA)
- Kaufman's Adaptive Moving Average (KAMA)
- Relative Moving Average (RMA)
- Arnaud Legoux’s Moving Average (ALMA)
Advantages:
- Auto Plotting the Lable: < TIMEFRAME + BAND TYPE + LENGTH >
- Multi TimeFrame (MTF)
- Usable with Custom Time Frames: You can choose any Time Frame out of your Custom Time Frame List
- "No Repainting"
- "No Gaps" on lower Chart Time Frames (HD, no "Stairs")
"No Repainting" and "No Gaps" TRUE
"No Gaps" FALSE
DB MACD TTM SQZ HistogramDB MACD TTM SQZ Histogram
What does the indicator do?
The DB MACD TTM SQZ Histogram combines the MACD with the TTM Squeeze into a single histogram. Traders may use the "Multiplier" settings to weight MACD vs. TTM SQZ. The MACD will default have a multiplier value of 2 vs. 1 for TTM SQZ. The reasoning behind the default 2:1 multiplier is to allow the faster MACD to have a strong hand in the histogram. In addition to the histogram, the indicator will display a red dot when a BB/KC squeeze (TTM SQZ) is present. The TTM SQZ uses a length of 20, BB m-factor of 2, and KC m-factor of 1.5 to match the "Mastering the Trade" squeeze. The histogram is calculated by taking the MACD histogram and the TTM SQZ histogram and first standardizing them into reasonable decimal percentages. Once standardized, each decimal percentage is then multiplied by the individual multiplier. Finally, the two values are summed into the combined histogram value. The end result is a standardized weighted combination of the MACD (faster) with the TTM SQZ (slower) histogram.
How should this indicator be used?
The DB ETHUSD MMA Indicator should be combined with other indicators as a secondary visual indicator or market buy/sell periods. The indicator is not meant to replace the MACD or TTM SQZ. Analyzing the MACD and TTM SQZ wave patterns individually is extremely useful. The indicator allows the trader to quickly obtain a combined analysis of the two indicators with a predetermined preference (multiplier) towards one vs. the other.
In other words, the indicator is very helpful when the MACD and TTM SQZ are conflicting in providing market direction. Those familiar with MACD or TTM SQZ histograms recognize there are four periods in the full cycle; growing below zero line, growing above zero line, falling above zero line, and falling below zero line. Typically a trader would look for buying opportunities when the cycle is showing "growing below zero line." and sell when the price reaches the "falling above zero line." The qualification of the wave pattern of the four periods must be reviewed before trades. If the wave is choppy, then alternative timeframes should be reviewed. Think of wake on a lake or ocean waves. Choppy is unpredictable but smooth waves are more predictable.
The red dot on the zero line would indicate that a squeeze is present in the current timeframe, building pressure. The red dot does not indicate a pressure release of up or down. Instead, it simply means the spring is being compressed. When a squeeze is present, pressure builds and may release in either direction. You can combine this indicator with BB and KC on the plot with BB (20 len, 2 m-factor) and KC (20 len, 1.5 m-factor). You can review the BB/KC outer bands to see possible breakout resistance or support when a squeeze is on. If the price is outside the BB/KC outer banks, move to a higher timeframe.
Does the indicator include any alerts?
Not Yet. Perhaps in the Future (If Desired)
Enjoy!

J-AutomationJust a simple automation for FX trading.
This strategy goes long if the MACD histogram and the MACD momentum are both above zero and the fast MACD moving average is above the slow MACD moving average. As additional long filter the recent price has to be above the SMA 200. If the inverse logic is true, the strategy goes short.
SMA VWAP BANDS [qrsq]Description
This indicator is used to find support and resistance utilizing both SMA and VWAP. It can be used on lower and higher time frames to understand where price is likely to reject or bounce.
How it works
Rather than using the usual calculation for the VWAP, instead this script smooths the volume first with the SMA and then respectively calculates the smoothed multiplication of high, low and close price with the volume individually. These values are then divided by the smoothed volume to find individual VWAP's for each of the sources. The standard deviations of these are calculated, resulting in an upper, lower and middle band. It is essentially VWAP bands with some smoothed calculations in the middle.
How to use it
I like to use the bands for LTF scalping as well as HTF swings.
For scalping:
I tend to use either the 5m or 15m TF
I then set the indicator's TF to 1m
I will take a scalp based on the bands confluence with other PA methods, if price is being either supported or rejected.
For swings:
I tend to use a variety of TFs, including: 30m, 1H, 4H, D
I then set the indicator's TF to "Chart"
I will take a swing based on the bands confluence with other PA methods, if price is being either supported or rejected.
I also tend to use them on perpetual contracts as the volume seems to be more consistent and hence results in more accurate support and resistance.

Gate Signal by Market yogiThis indicator is made by Nischay Rana (Market Yogi)
How to use this Indicator
This is simple group of 8 moving averages, which can be configured in various ways according to your trading requirement.
1. moving average ribbon
2.moving average channel
3.moving average gate signal
4.This indicator has bonus indicator of bollinger bands inbuilt.
Logic:
As price has tendency to get closer to their moving averages. The logic behind this indicator is to use the contraction and expansion concepts of moving averages to find best entry exit points.
This nature of Price action is use to capture the big move after the convergence of all moving averages.
CAUTION : Do not blindly trade the gates as gate has tendency to break out on either side. So use this indicator in confluence with price action and other technical analysis to capture bigger moves.
Higher the gate width more gates are found. Similarly lesser the gate width less gate are found. i.e. Tight squeeze of all the moving averages.
"ENJOY HAPPY TRADING.."
Truly Yours Market Yogi
